Cisco Secure Access Help

PDF

Cisco Secure Access Help

About the Remote Access Log Report

Want to summarize with AI?

Log in

Describes About the Remote Access Log Report in Cisco Secure Access. The Remote Access Log report lists users that have remotely connected to Secure Access and requested access to destinations.


The Remote Access Log report lists connection events for users who connect remotely to Secure Access. Use the report to investigate connection activity, troubleshoot failed sessions, and identify access issues. Some relevant fields include:

  • Display username for failed events – Helps you identify the affected user.

  • ASA syslog message ID – Helps you identify the syslog message associated with the event.

  • Device ID and device name – Helps you identify the endpoint.

  • Machine name – Identifies the client machine when the value is returned for the event.

  • Endpoint posture information – Provides posture details for failed events when posture data is returned.

  • Connection information – Includes the VPN profile, session type, IP addresses, operating system, and Secure Client version.

Use the time-range control and the filter menu to refine the report. Depending on the selected time range and the data returned for that period, you can filter by user, country, region, posture profile, session type, device name, machine name, IP address, VPN profile, reason code, and Security Group Tag information. Some filters provide fixed choices, some provide values found in the report data, and some accept a value that you enter.

You can also hover over a supported value in a table column and select the search control to add that value to the applied filters. Use table settings to change the visible columns or table density. The report supports sorting for supported columns, including User, Region, and VPN Profile.

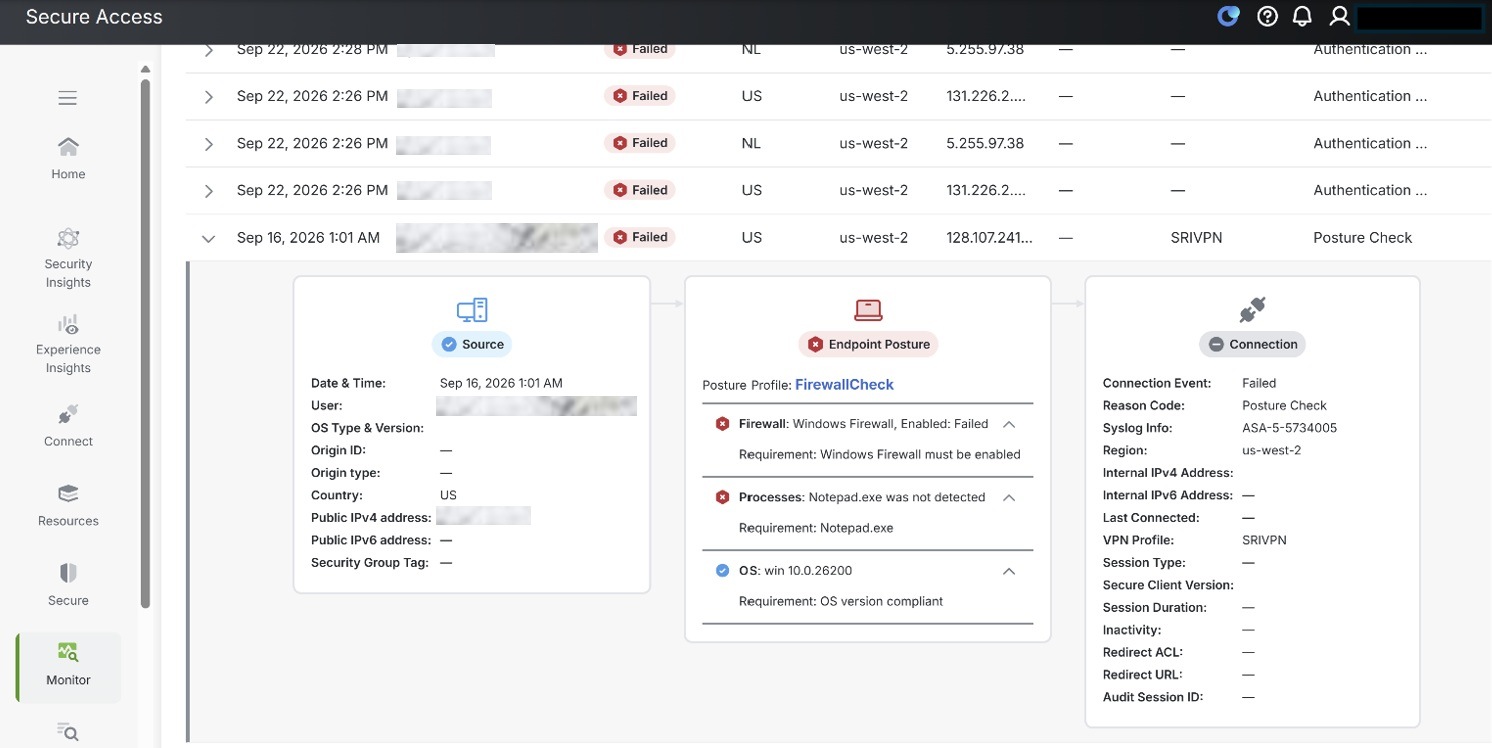
Select a row to expand its details. The expanded area can include Source, Endpoint Posture, Connection, and Tunnels information. Endpoint Posture details can include the posture attributes evaluated for the event and the posture profile used for the evaluation. If the posture profile is linked, select the link to open that posture profile.

For failed posture checks, the Remote Acess Logs now provide a section in the details panel that include the status, the region, the affected posture profile, and any detected errors such as a disabled firwall or a missing executionable file. an example of such failure is shown here:
You can schedule automatic delivery of Remote Access Log reports or export them as CSV files for further analysis. For more information, see Schedule a Remote Access Log report and Export Report Data to CSV.

The exported CSV file of Remote Access Logs includes the following columns: Date, Time, User, Device Name, Connection Event, Event Details, Public IP, Internal IP, VPN Profile, Session Type, OS Type and Versions, Secure Client Version, Session Duration, and Region.


View the Remote Access Log Report

Before you begin

A minimum user role of Read-only. For more information, see Manage Accounts.

The Remote Access Log report lists users' connection events that are related to remote access, tracked over distinct time periods.

Procedure

  1. Navigate to Monitor > Reports > Remote Access Logs.

  2. Choose a time frame of remote access events.

  3. Use the search bar to find remote access events by identity or endpoint device OS version. Identity includes the columns User and Device Name.

    Note
    If you have configured rules to traffic originating from IP addresses in network segments that include Security Group Tags, then you can search for connection events by SGT. When present, SGTs will be appended to the User column value. For more information, see Integrate ISE with Secure Access and Integrate Catalyst SD-WAN with Secure Access.
  4. Refine your search using the following filters to help identify security issues that require attention.

    The filter menu can include the following filter types when they apply to the selected data:

    • Status

      • Connected

      • Disconnected

      • Failed

      • Warning

    • User

    • Machine Name

    • Device Name

    • IP Address

    • Country

    • VPN Profile

    • Posture Profile

    • Region

    • Session Type

    • Reason Code

      • Cert Auth Check

      • Posture Check

      • Authentication Check

      • Authorization Check

      • Addr Assignment Fail

      • TLS Check

      • IKEv2 Check

      • Unknown Failed Reason

      • Geocompliance Check

      • Access Allowed Geocompliance Service Unavailable

      • IP Assignment Failed

      • Unknown

      • AAA

      • User Requested

      • Connection Lost

      • Max Time Exceeded

      • Administrator Reset

      • IPSec Error

      • Client Type Not Supported

      • Connection Preempted

      • SA Expired

      • IKE Delete

      • Certificate Expired

      • Port Error

      • Posture Check Failed

      • Unknown Disconnection Reason

      • DDNS update failed

    • OS Version

    • Client Version

    • Security group tag lets you filter by connection events with Security Group Tags (SGT) you have configured rules to traffic originating from IP addresses in network segments that include SGTs. When present, SGTs are appended to the User column value. For more information, see Integrate ISE with Secure Access and Integrate Catalyst SD-WAN with Secure Access.

    Note
    Some filters provide fixed options, some display values found in the connection data, and some accept a value that you enter. A data-driven filter displays only option values that are present in the connection data for the selected time frame. If no option values are present, the filter remains hidden.
  5. The table includes the following categories:

    • User—The name of the user in Secure Access.

    • Device Name—The name of the device in Secure Access.

    • Connection Event—The identity used to determine which policy applied to this activity

    • Event Details— The category of activity or action committed. Hover over this column to view the Reason Code and any syslog info related to the event.

    • Public IPv4 Address— The public-facing IPv4 address configured in the VPN profile.

    • Assigned IPv4 Address— The internal IPv4 address configured in the VPN profile.

    • Assigned IPv6 Address—The internal IPv6 address configured for the VPN profile.

    • VPN Profile— The name of the VPN profile associated with the event.

    • OS Type and Versions— The OS type and software version of the machine associated with the event.

    • Secure Client Version— The version of the Secure Client.

    • Session Duration— Duration of the session, if terminated.

    • Region— The region configured in the VPN profile that is associated with the event.

    • Event Time— The day, year, and timestamp of the event.


View Event Details

To view details of an event, perform the following steps:

Procedure

  1. Navigate to Monitor > Reports > Remote Access Logs.

  2. Click the expand icon at the start of any row.

    This expands the row and displays the event details.

    Image displaying event details

What to do next

Result: The event details display in the expanded row as Source, Endpoint Posture, and Connection cards.

Extra information is available in the event details:

  • Last Connected - The timestamp when this user was last connected to the machine.

  • Source - The Source card can include Date & Time, User, OS Type & Version, Device Name, Origin ID, Origin type, Country, Public IPv4 address, Public IPv6 address, and Security Group Tag.

  • Endpoint Posture - The Endpoint Posture card displays posture information. It can show the posture profile applied to the event or indicate that no posture profile is applied. Click the link to view the posture associated with the event.

  • Connection - The Connection card can include Connection Event, Reason Code, Syslog Info, Region, Internal IPv4 Address, Internal IPv6 Address, Last Connected, VPN Profile, Session Type, and Secure Client Version. It can also display session duration, inactivity, redirect, security group tag, and audit session information.

  • Reason Code - The reason code for VPN incompatibilities.

  • Syslog Information - Syslog information related to the event you are examiningwith timestamps, syslog server IP, and indication of a logging message.

Review the following additional event details:

  • Duration - The duration of the session.

  • Inactivity - The amount of time that the session was inactive.

  • Redirect ACL - The redirect access control (ACL) that originates from the user or device.

  • Redirect URL - The URL where a user is automatically sent after attempting to access a different URL.

  • Security Group Tag - The unique identifier assigned to a device or user, representing their security role or access level within the network.

  • Audit Session ID - The unique identifier generated and associated with a user's process when they successfully log in or connect.

  • Tunnels - Select View tunnels to view tunnel information. If the event includes more than one tunnel, select the corresponding tunnel tab to view each tunnel's details.

From your search results, you can click an identity or destination and go to its detailed report.


View Zero Trust Access Events in the Remote Access Log

View the Enrollment Logs

From the Remote Access Log page (Monitor > Reports > Remote Access Logs) click the Zero trust Access tab. This page displays all the enrollment activity and events for the users in your organization. Some columns may not generate data if they are not applicable to the type of device used to enroll.

The following aspects of the event is addressed:

  • Source - The username that initiated the event or enrollment activity.

  • Event Type - The type of event that triggered an action. Users are either Enrolled or Unenrolled.

  • Event Status - The status of the event, whether it was successful or if it failed.

  • Event Details -The category of activity or action committed. If there are failures, reasons for the failures are displayed here.

  • Public IP address - The public-facing IP address configured in the VPN profile.

  • ZTA client version - The version of the Zero Trust Access client.

  • OS Type and Versions - The OS type and software version of the machine associated with the event.

  • Authentication Method - The type of authentication used to validate the event. At this time supported authentication methods are SAM or Identity certificate.

  • Event Time - The day, year, and timestamp of the event.

Note
In some instances, a single enrollment event generates multiple log lines depending on stage of enrollment. All events related to a single enrollment even will have the same Enrollment ID. This Enrollment ID field is available in the Event Details.

Columns are customizable. Click the gear icon in the upper right of the display table to modify which columns are included in your view. Ensure you apply the changes to save your selection.

Additionally, click the Filters button next to the advanced search bar to filter through the available results for specific components of the report. Use the time range drop-down option to search for a specific time frame; you can also add conditions through this option for specific dates that are not recent.

Note
You can recall previous searches made in the advanced search bar. Note that the recall feature only remembers searches made from your user account for the organization.

Scheduled Reports

You can schedule a report on the ZTA enrollment data in advance. See Schedule a Report for more information.

Export CSV

You can export the history of your organization or a specific query. See Export Report Data to CSV for more information.


View Zero Trust Access Enrollment Logging Event Details

Procedure

  1. Option 1: Click the View Details icon (the blue ellipsis at the right end of each row).

    The View Event Details interface.
  2. Option 2: Hover over an Event Details field in any row, then click Read More below the ASA syslog message ID.


What to do next

Result: The Event Details drawer displays detailed information about an individual event.

Extra information is available in the Event Details window:

  • Date & Time - The timestamp when this event occurred.

  • Source - The username that initiated the event or enrollment activity.

  • Event Status - Denotes whether the action of the event is Successful or a Failure.

  • Authentication Method - The type of authentication used to validate the event. At this time supported authentication methods are SAM or Identity certificate.

  • Public IP address - The public-facing IP address configured in the posture profile.

  • Enrollment ID - The unique Identifier

  • ZTA client version - The version of the Zero Trust Access client.

  • Device - The type of device detected in the event. This reflects the device of the user who initiated the event.

  • OS Type and Versions - The OS type and software version of the machine associated with the event.

  • Event Detail - A brief description of the category of activity or action committed.

From your search results, you can click an identity or destination and go to their respective detailed report.


Schedule a Remote Access Log Report

You can now schedule remote access log reports to be emailed to you at regular intervals. The scheduled report email includes an HTML table preview of the report, a downloadable CSV file containing all available data, and a direct link to a live version of the report in the portal. Any filters applied in the Remote Access Logs view, such as connection event, event details, or identities, are reflected in the scheduled report, ensuring only relevant data is included.

Scheduling is supported for both VPN and Zero Trust remote access logs, allowing tailored reporting based on your security and compliance requirements.

Note
Data older than 30 days cannot be included in scheduled or exported reports.

For step-by-step instructions on how to schedule a report, see Schedule a Report.