Cisco Crosswork Planning Design 7.2.x User Guide

PDF

Cisco Crosswork Planning Design 7.2.x User Guide

Visualize demands in the network plot

Want to summarize with AI?

Log in

Describes how to highlight demand paths in the network plot for better visualization and analysis.


Use this task to visualize demand paths in the network plot to understand traffic flows.

Demand paths represent specific data flows across the network. By visualizing these paths, you can quickly identify source and destination points and inspect how demands traverse through nested sites.

Procedure

1.

In the Network Summary panel on the right side, select the demands you want to visualize from the Demands table.

Selected demands appear as blue arrows in the network plot. The source is labeled as “A” and the destination is labeled as “Z”. If sites are nested, these “A” and “Z” labels appear in all relevant child sites.

Figure 1. Demand route
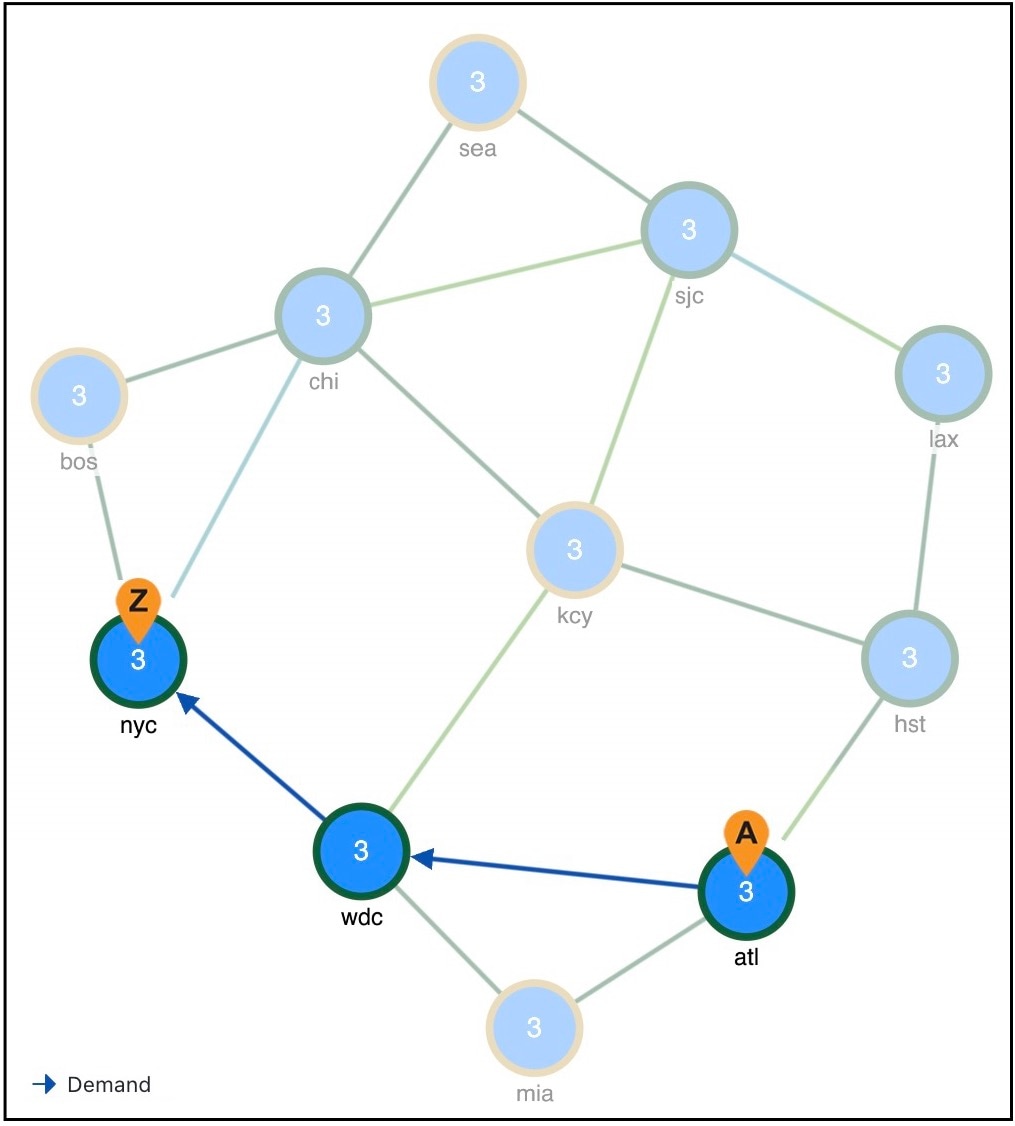
Demand route
2.

Hover over any selected demand in the Network Summary table to highlight its path in the network plot.

3.

To view only the nodes participating in the selected demand, perform these steps.

  1. Check the Participating only check box in the network plot.

    Figure 2. Participating only nodes
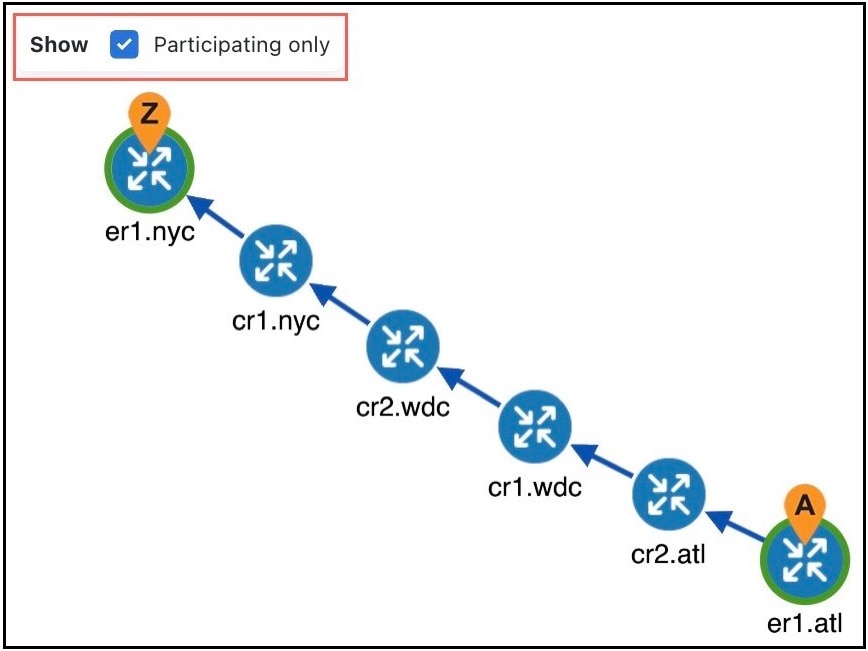
    Participating only nodes
  2. To return to the previous view, uncheck the Participating only check box or check the Show Groups check box.

The network plot displays selected demand paths with clear source and destination labels, allowing for rapid analysis of traffic flows.

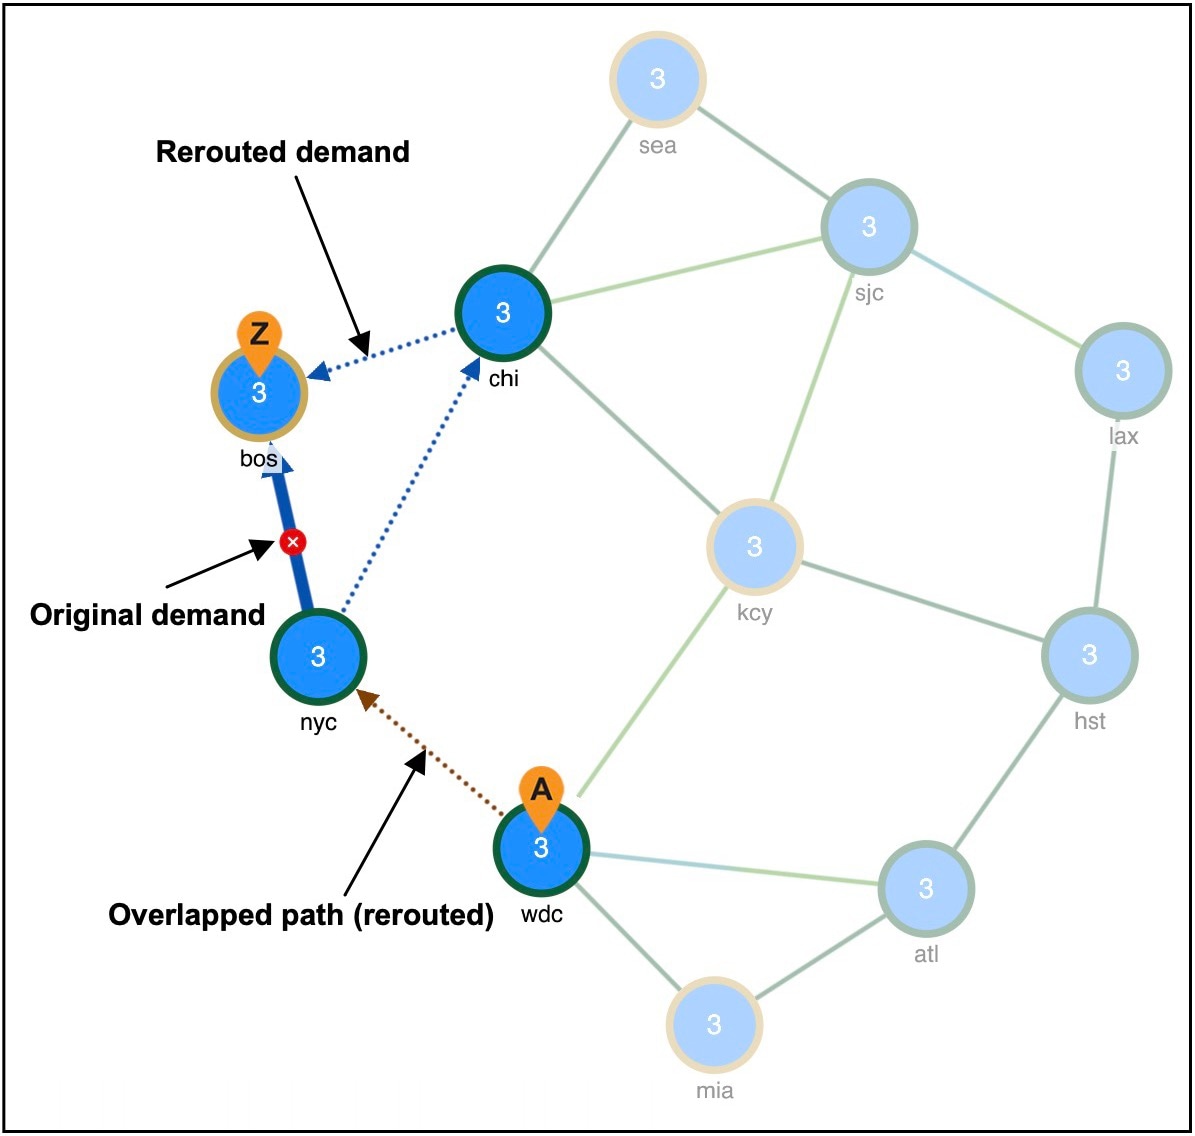
Traffic rerouting

Traffic rerouting is a network behavior that

  • automatically redirects demands when a failure occurs, and

  • uses visual indicators to differentiate between rerouted and overlapping routes.

Demands are typically used to show how traffic reroutes around failures. In a network plot, a blue dotted line represents the rerouted demand, while a brown dotted line represents a route that overlaps with another route.

Figure 3. Rerouted demands
Rerouted demands

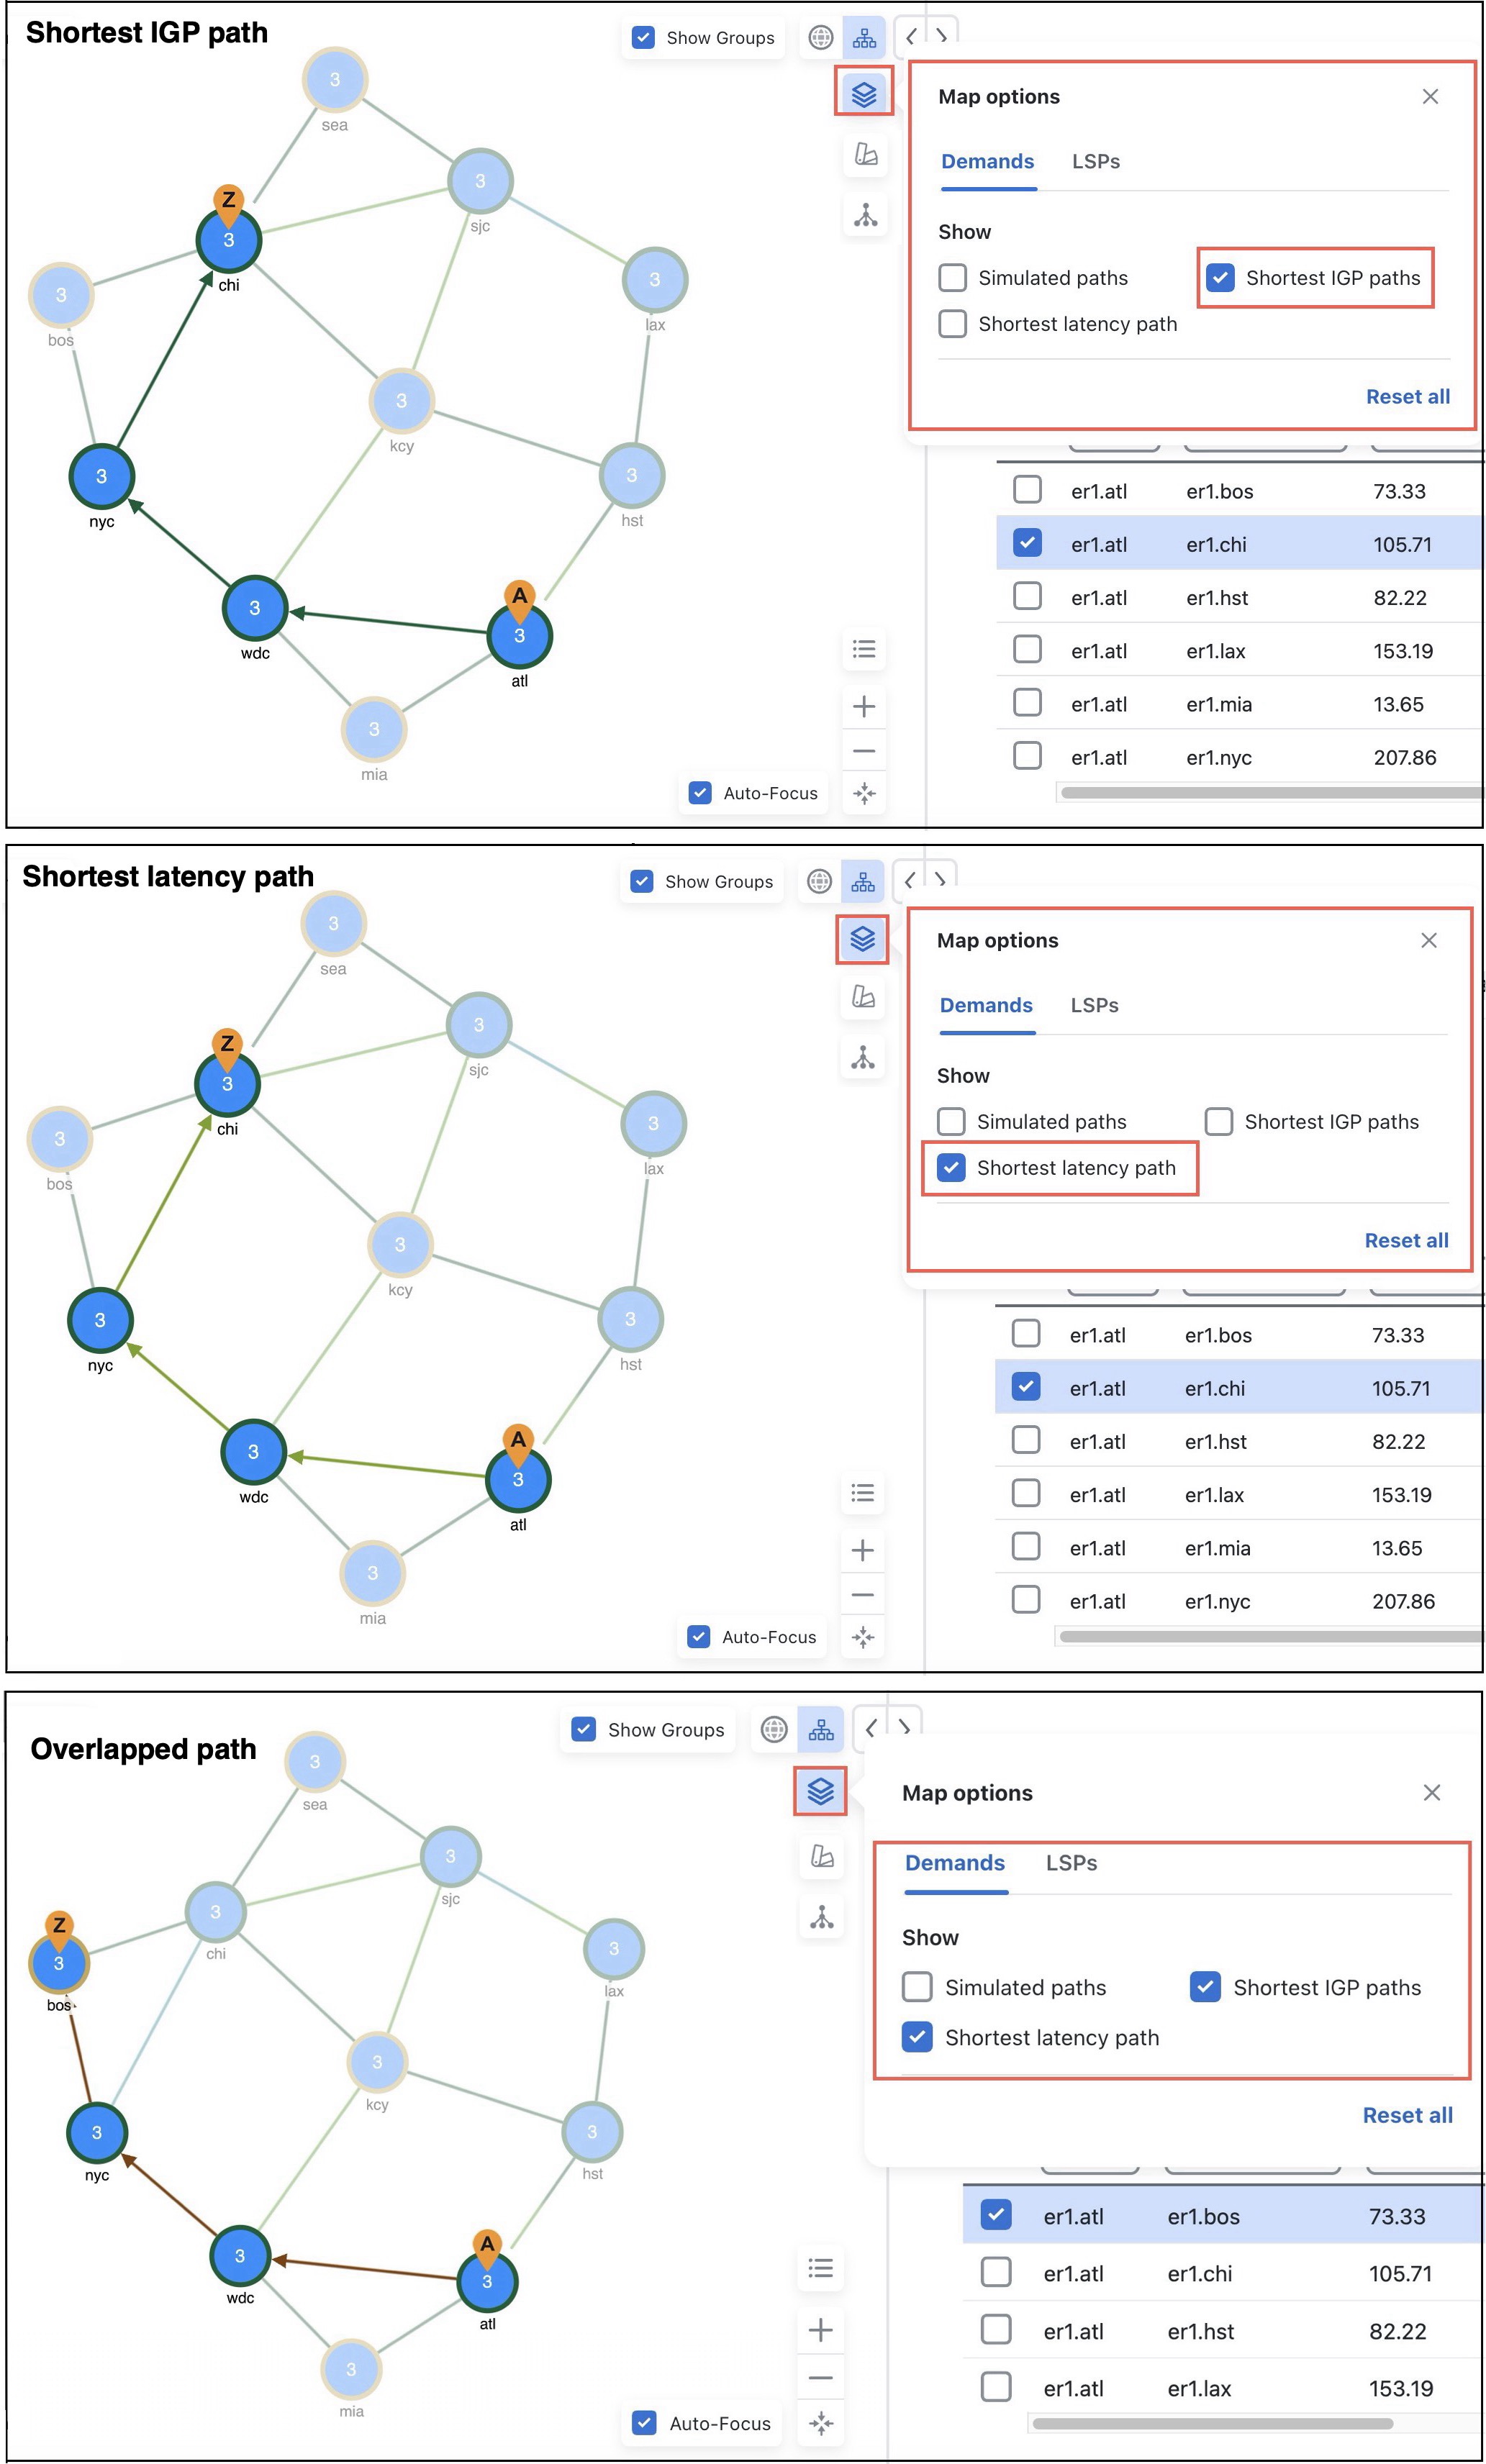
View shortest IGP and latency paths, and overlapped paths

Use this task to distinguish demand paths in the network plot based on IGP, latency, and path overlap.

Viewing different path types in the network plot enables quick understanding of how demands traverse the network and aids in troubleshooting.

For a description of shortest IGP paths and shortest latency paths, refer to Simulate IGP Routing Protocol.

Procedure

1.

In the network plot, click the Map options icon ().

2.

Under the Demands tab, check the relevant options:

  • Simulated paths: Displays the simulated demand paths. By default, this option is selected.

  • Shortest IGP paths: Displays the shortest IGP path for demands.

  • Shortest latency path: Displays the shortest latency path for demands.

3.

In the Network Summary panel, select the demands from the Demands table.

4.

Observe the network plot:

Figure 4. Shortest IGP and latency paths, and overlapped path
Shortest IGP and latency paths, and overlapped path
The network plot displays the selected demand's path with distinct color-coded arrows: dark green for shortest IGP, light green for shortest latency, and brown for overlapped paths.