Cisco Crosswork Planning Design 7.2.x User Guide

PDF

Cisco Crosswork Planning Design 7.2.x User Guide

Growth plans

Want to summarize with AI?

Log in

Explains how growth plans predict future network traffic using various forecasting methods and help incorporate performance simulation into planning decisions.


The Create growth plans tool lets you generate new plan files containing predictions of future traffic, based on growth forecasts for the current plan.

You can generate the predicted traffic growth in one of three ways:

Regardless of the method, the growth is compounded per period increment identified in the Create growth plans tool.

A series of plan files is created for each growth period, and each plan contains a report on the prediction process used to generate it. Each newly created plan shows the effects of the traffic growth visually in the plot using default traffic utilization colors, as well as in the Traffic column in the Demands table. You can incorporate worst-case performance into planning decisions by automatically running a simulation analysis on the new plans.

Create growth plans

Use this task to create growth plans that predict network infrastructure requirements based on potential traffic increases.

Procedure

1.

Open the plan file (refer to Open plan files). It opens in the Network Design page.

2.

From the toolbar, choose Actions > Tools > Create growth plans. Alternatively, you can choose Preset workflows > Evaluate impact of traffic growth.

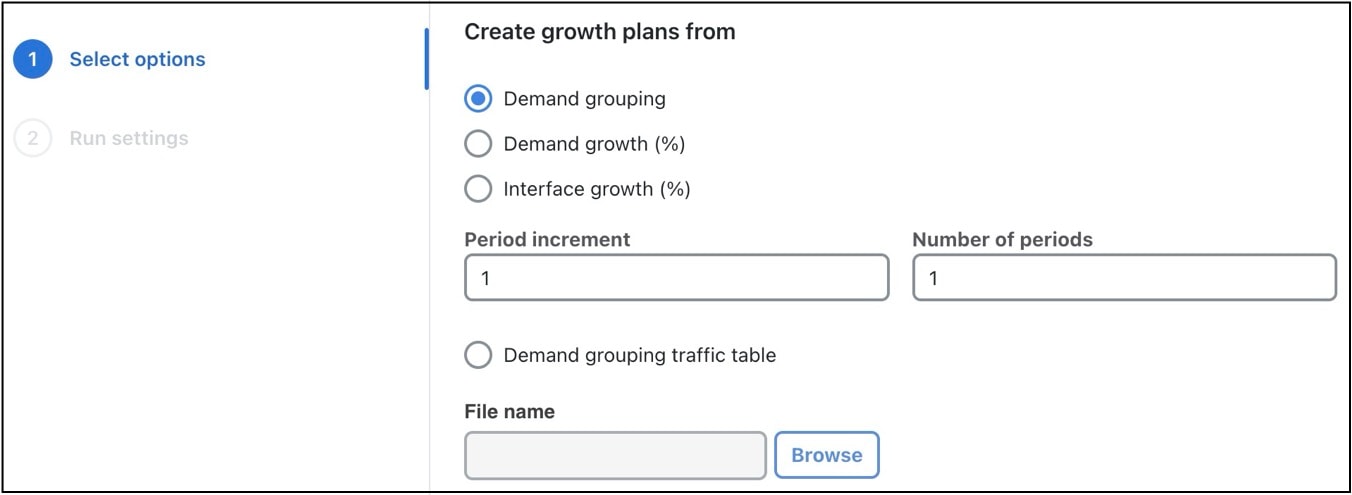
Figure 1. Create growth plans settings
Create growth plans settings
3.

Specify one of these growth methods:

4.

Enter the number of plans to create and the increment by which you want to create them. These options are not applicable, if you selected the Demand grouping traffic table option in Step 3.

  • Period increment: Number of percentage increments per period. For example, if a demand is set to grow at 10%, and the period increment is 2, the demand will grow by 21% in the first growth plan.

  • Number of periods: Number of growth plan files to create.

Plans are named using the period increment. For example, if you enter 4 as the increment and 2 as period, Cisco Crosswork Planning generates two growth plan files: one ending with _4 and one ending with _8.

5.

Click Next.

6.

On the Run Settings page, choose whether to execute the task now or schedule it for a later time. Choose one of these Execute options:

  • Now: Choose this option to execute the job immediately. The tool runs and changes are applied to the network model immediately. A summary report appears. You can access the report any time later using Actions > Reports > Generated reports option.

  • As a scheduled job: Choose this option to execute the task as an asynchronous job. Set these options:

    • Priority: Select the priority of the task.

    • Engine profiles: Select the engine profile as needed. This section lists all the available asynchronous engine profiles.

    • Schedule: Set the time at which you want to run the tool.

    The tool runs at the scheduled time using the selected engine profile. You can track the status of the job at any time using the Job Manager page (from the main menu, choose Job Manager). Once the job completes, import the output plan file into user space to visualize it. For more information, refer to Access output plan files from job manager.

    Note
    Ensure that you save the plan file before you schedule the job. Any unsaved changes in the plan file are not considered when you run the tool as a scheduled job.
7.

Submit your changes.

The generated growth plan is saved under Network Models > User space > Other files. To view the details, download the file (.tar file), extract it, and import the updated plan file to the user space (for more information, refer to Import plan files from the local machine).

Growth plans from demand grouping

Growth plans for network traffic, such as those produced either by trending analyses, or by financial or sales forecasts, are typically created for traffic aggregates. You can specify these aggregate growth forecasts or trending estimates as demand grouping traffic growth information. The Create growth plans tool allocates traffic to demands to match the aggregate traffic growth specified for each demand grouping. If two demand groupings contain a common demand (for example, a grouping of demands sourced from one site, and a grouping of demands destined for another site), this demand traffic is balanced between the requirement to match each of the demand grouping traffic aggregates.

Note

You cannot create, edit, or delete the Demand groupings from the UI. You can only view the Demand grouping details in the UI if it's already present in your plan file.


Create growth plans from demand growth

This method grows demand traffic based on the value identified in the Growth (%) column of the Demands table in the current network model. This approach is useful when all traffic in the network, all traffic within a given traffic level, or all traffic within a service class is forecast to grow at the same rate. When generating plans, you can choose how many plans to create. Each plan shows growth at the specified rate compared to the previous plan.

Complete these steps to populate the Growth (%) column in the Demands table.

Procedure

1.

Open the plan file (refer to Open plan files). It opens in the Network Design page.

2.

Select one or more demands from the Demands table.

3.

Click Edit icon.

4.

In the Traffic section, enter the growth rate in the Growth % column.

5.

Save your changes.

If traffic on a demand is 1000 Mbps, if the growth for that demand is defined as 10%, and if you create two growth plans, the first will show 1100 Mbps and the second will show 1210 Mbps on that same demand, representing 10% growth per period.


Create growth plans from interface growth

This method grows measured traffic based on the Growth (%) column in the Interfaces table in the current plan file. It differs from demand-based growth methods because this method grows measured traffic rather than demands (simulated traffic). This method is useful for basic forecasting of the current network state, rather than worst-case failure states, which require simulation. When generating the plans, you can choose how many plans to create, and each plan shows growth at the specified rate compared to the previous plan.

You can also use this method in conjunction with the Demand deduction tool to create demands from the forecast measurements.

Complete these steps to populate the Growth (%) column in the Interfaces table.

Procedure

1.

Open the plan file (refer to Open plan files). It opens in the Network Design page.

2.

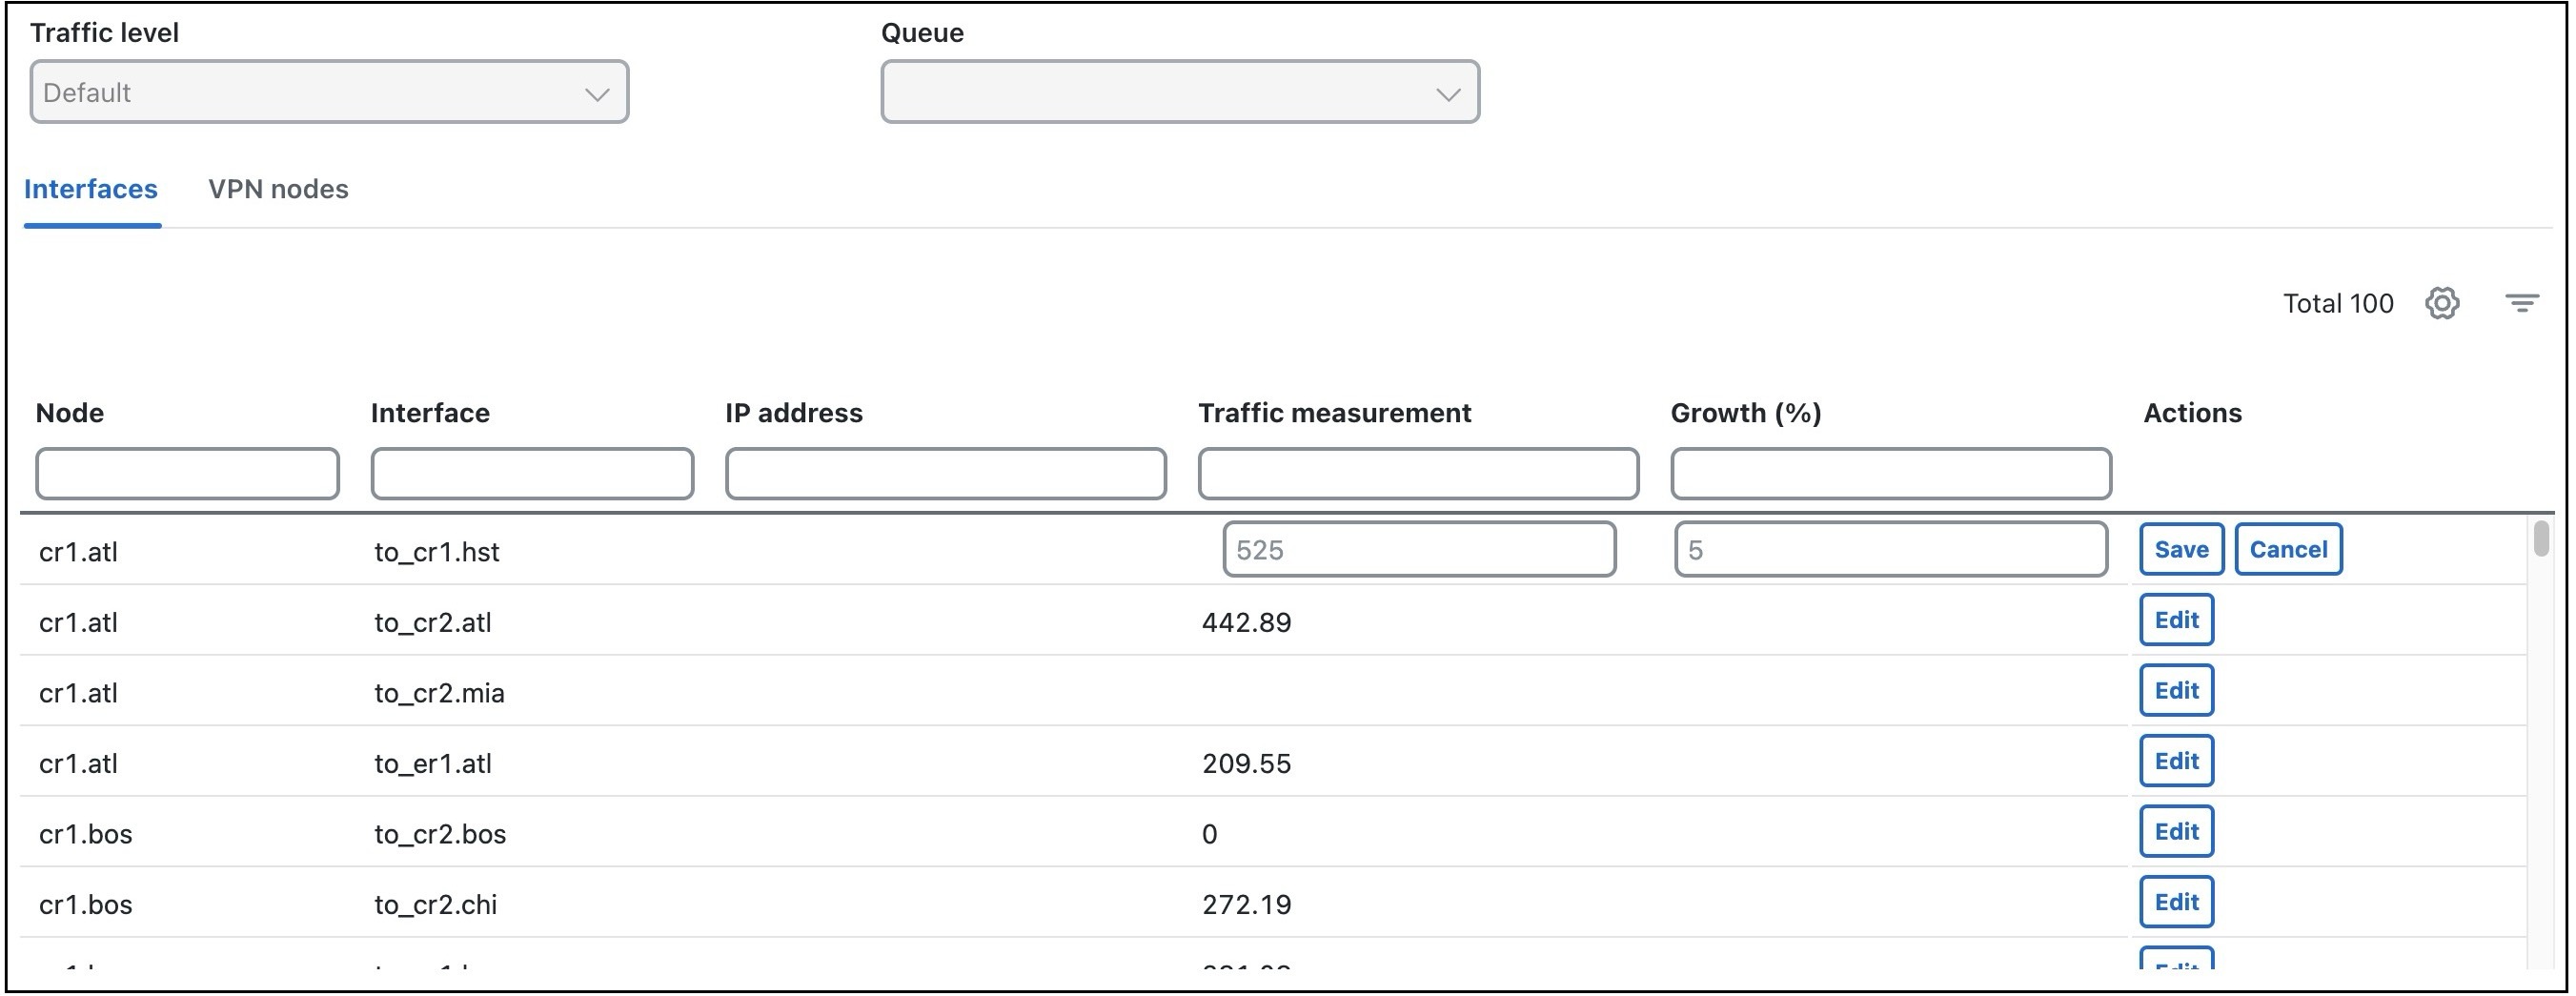
From the toolbar, choose Actions > Edit > Traffic > Measured traffic.

The Measured traffic page opens.

Measured traffic page
3.

For each applicable interface, click the Edit button and in the Growth (%) column, enter the percent by which you want to increase the interface traffic.

4.

Save your changes.

If the traffic on an interface is 525 Mbps, if the growth for that interface is defined as 5%, and you specify three growth plans, the first will show 551.25 Mbps, the second will show 578.81 Mbps, and the last will show 607.75 on the same interface, representing 5% growth per period.