Cisco Crosswork Planning Design 7.2.x User Guide

PDF

Cisco Crosswork Planning Design 7.2.x User Guide

Apply QoS settings globally

Want to summarize with AI?

Log in

Guides you through applying QoS settings globally, including selecting service classes or queues and updating your network plan to reflect changes in network summary tables and plot displays.


Selecting QoS settings and the traffic level at the global level determines the network summary table calculations and what is displayed in the network plot.

Before you begin

Ensure that the required queue or the service class is available.

Complete these steps to apply the QoS parameters globally for an opened plan file.

Procedure

1.

Open the plan file (refer to Open plan files). It opens in the Network Design page.

2.

In the toolbar, select Manage QoS from the QoS drop-down list, or use the Actions > Edit > Manage QoS option.

3.

Select the service class or queue from the QoS drop-down list.

The selected QoS setting applies globally to your network plan. The network plot and the network summary table display data based on the selected QoS parameter.


How QoS violations are indicated in the topology

Summary

Cisco Crosswork Planning visually signals when network interfaces exceed QoS bounds. This feature helps you quickly identify and address potential performance issues.

The key components involved in the process are:

  • Topology plot: Displays network interfaces and their current status.

  • QoS violation icon (): Marks interfaces that violate QoS thresholds.
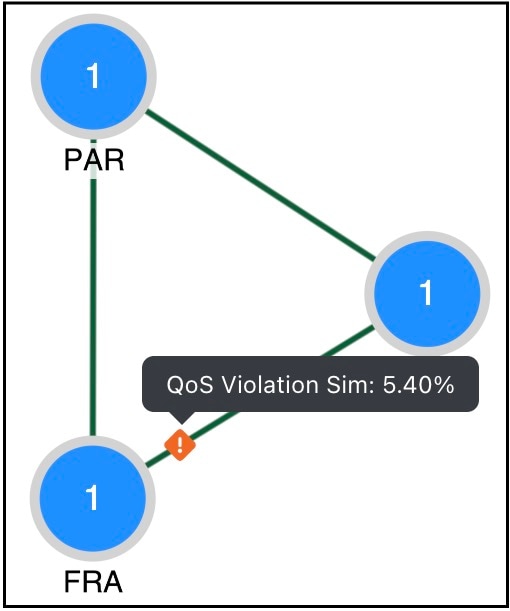
  • Severity text: Provides details about the violation.

Workflow

The process includes these stages:

  1. The system monitors interface utilization and QoS thresholds.
  2. When an interface exceeds its QoS bound, a violation icon appears on the topology plot.
  3. The severity text provides details about the violation.
    Figure 1. QoS violation indication
    qos-violation-indication
    Note

    Cisco Crosswork Planning indicates when an interface violates a QoS bound in the network plot, but does not display the QoS bound values on the interfaces.