Configuration Guide for Cisco Optical Site Manager, IOS XR Release 26.x.x

PDF

Configuration Guide for Cisco Optical Site Manager, IOS XR Release 26.x.x

Optical time domain reflectometer

Want to summarize with AI?

Log in

This section explains optical time domain reflectometer in Cisco Optical Site Manager. An Optical Time Domain Reflectometer (OTDR) is a built-in fiber diagnostic tool that.


An Optical Time Domain Reflectometer (OTDR) is a built-in fiber diagnostic tool that

  • sends light pulses through the optical fiber,

  • measures the reflected signals to detect faults, measure span loss,

  • and locates events such as fiber cuts or high reflections.

OTDR benefits

Cisco Optical Site Manager allows you to access the OTDR functionality of the underlying device in a unified manner, regardless of potential device differences.

The OTDR feature offers several advantages for fiber management:

  • Assess fiber quality during system installation before activating traffic.

  • Measure real-time loss and back reflection for the fiber pair connected to the TX and RX ports.

  • Monitor the fiber during live system operation.

  • Inspect the fiber following cable cut and repair events

  • Detect fiber degradation due to aging and environmental factors by automatically monitoring span loss and ORL thresholds.

From Release 26.1.1, OTDR scan is supported on NCS 2000, in addition to the NCS 1000.


Provision OTDR ports

Use this task to provision OTDR ports.

Use this task to provision OTDR ports on the TNCS-O and TNCS-2O control cards.

Before you begin

Log into Cisco Optical Site Manager

Follow these steps to provision OTDR ports.

Procedure

  1. Click Optical Setup in the left panel.

  2. Click the OTDR > Provisioning tabs.

  3. Perform these steps as needed.

    1. To add an OTDR port, click +Add.
      1. In the Create OTDR dialog box, choose the Port.

      2. Click Apply.

        The OTDR port is created and added to the table that displays the following information:

        Note

        When you create an OTDR port, there are two entries with the status for direction Tx and the direction Rx.

        • Port―Displays the OTDR port name.

        • Direction―Displays the direction of the port (Rx or Tx).

        • Scan Status―Displays the status of the OTDR scan; for example, status-progress, status-failure, or status-idle.

        • Scan Progress―Displays the progress of the OTDR scan, in percentage.

        • OTDR Training Status―Displays the status of the OTDR training; for example, status-trained, and status-not-executed. The status is unique for each direction.

        • ORL Training Status―Displays the status of the ORL training. The status is unique for each direction.

        • Scan Failure Message―Displays the reason for the scan failure.

        • High Reflection Location―Displays the location of high reflection that is detected when the scan fails.

        • ORL Threshold― Displays the threshold of the ORL measure. There is an alarm (Excessive ORL Measure) associated with this field.

        • Refractive Index―Displays the fiber refractive index, which depends on the installed fiber.

        • Backscatter―Displays the reflective light on the fiber, which is also dependent on the installed fiber.

        • Loss Sensitivity―Displays the limit under which the loss is not considered as real loss, in dB.

        • Reflection Sensitivity―Displays the limit under which the reflection is not considered as a real reflection, in dB.

    2. (Optional) If you want to delete a port, select one of the entries (Tx or Rx), and click Delete.

      Both entries (Tx and Rx) of the port are deleted.

  4. To run the OTDR scan, perform these steps:

    1. (Optional) Set the following values, if required.
      • Absolute Alarm Thresholds for loss and reflection

      • Loss Sensitivity and Reflection Sensitivity of the fiber

    2. Choose the OTDR port on which OTDR scan has to be performed.
    3. Click Start.

      "OTDR scan started" message appears.

      Note
      • You can run only one scan at a time either in TX or RX direction, for each port. When you start a scan on direction TX, the column that is related to TX direction is updated, and when you start the scan on RX, the other column is updated.

      • You can run scan on both ports (for example: ports 1 and 2 on TNCS-O, and ports 3 and 4 on TNCS-2O) at the same time.

      • You can perform as many scans as you want, but Cisco Optical Site Manager database can retain only up to two Tx scans and two Rx scans for each port. If you perform subsequent scans, the existing scan file is overwritten by the latest scan file. Hence, for each port, the web user interface displays only up to two TX scans and two RX scans.

      You can view the status of the scan under the Scan Status column.

  5. To view the OTDR scan traces, perform these steps:

    1. Click the Traces tab.
    2. To set a baseline, perform these steps:
      • From the Port drop-down list, choose one of the ports you have configured, to analyze.

      • From the Last Scan Traces drop-down list, choose the scan file that you want to analyze.

      • If the selected scan had desired results and you want to set the selected scan file as a baseline, click Baseline.

      • Click Yes to confirm.

      • Click Ok in the Action dialog box.

        The baseline is saved. You can have one baseline for each direction. You can use this baseline to compare with other OTDR scan results.

    3. Choose the scan file and baseline file, and click the Refresh icon next to the Port drop-down list.

      You can view the traces chart having Loss (dB) plotted against Distance (Km). The baseline chart is plotted in blue color, and the selected otdr scan chart is plotted in green color.

      To zoom into the graph, press Shift key and drag the mouse pointer to select the portion of the graph.

    4. Click Download to download the data file saved in the Standard OTDR Record (SOR) format.
      The SOR file contains fiber trace data that are recorded by the OTDR instrument when testing an optical fiber.
    5. Click the Export as SVG icon to download the traces file in SVG format.

The provision OTDR ports task is complete.


Automatic OTDR scan

Automatic OTDR scan is started by checking the check box of the following parameters:

  • System Start-up, Fiber cut & Repair-When there is a fiber cut or after fiber repair, automatic OTDR scan is started. You can set a time delay for the OTDR scan by choosing the Start Delay (Min) value.

  • Span Loss Increase-When the span loss increases above the threshold value, automatic OTDR scan is started. You can choose the Span Loss Increase Threshold (dB) value.

  • Excessive ORL from Span-When the ORL information is excessive, automatic OTDR scan is started.


OTDR icons

This reference provides information about OTDR icons.

The OTDR tab displays the optical trace for the selected degree and direction, helping you analyze signal quality, detect faults, and verify fiber link health.

Note
When performing an OTDR scan on Cisco optical nodes, it is expected system behavior for the OTDR trace to display a long tail of noise extending beyond the fiber end or the configured scan range; this does not indicate a malfunction. In Auto mode, the system detects the actual fiber end, though a noise tail may still appear beyond this point. In Multi-Region and Expert modes , the scan range is determined exclusively by the configured "capture start" and "capture end" points (in km), rather than the span length configuration; consequently, a noise tail may appear beyond the configured capture end point.

Check the Denoise check box available under the zoom icon, to remove the noise trace.

OTDR icon descriptions

The table provides an overview of the icons available on the OTDR tab, along with a description of each operation they perform.

Table 1. OTDR icon descriptions
Icon

Description

—

To zoom into a specific area, press Shift and drag to create a rectangle around the area you want to zoom into.

—

Scroll down to zoom out of the graph.

Resets the graph to its original zoom and position.

Download the graph as an image.

Download SOR file that contains the fiber trace details such as the distance, reflectance, loss, and fiber attenuation measurements.

Save the current OTDR scan results as a baseline.

Indicates the status of the last successful scan.

Unprovision OTDR, clear reflections, clear losses, and configure various OTDR parameters.

Trigger a fast Scan in Auto mode. This is visible when the scan is not running.

Stop the ongoing OTDR scan. Once an OTDR scan is triggered, the Play icon changes to a Stop icon.

Perform fast or hybrid OTDR scans across all sectors (Auto, Expert, and Multi-Region modes) in both TX and RX directions.

Indicates a failed scan and provides the reason for the last scan failure when you hover the mouse over it.

Open a single graph that combines the office, short, and long trace files from an NCS 1010 multi-region scan.

When multiple scan results are available, click the Previous Scan or Next Scan buttons to view the previous or next OTDR scans respectively.


Run a manual OTDR scan in expert, multi-region, or auto-sector mode

Manually run an OTDR scan in expert, multi-region, or auto-sector mode during fiber installation or troubleshooting to verify link quality and locate faults.

Table 2. Feature History

Feature Name

Release Information

Description

Expert mode OTDR scan

Cisco Optical Site Manager Release 26.3.1

You can manually run an OTDR scan in expert mode on NCS 1010 and NCS 1001 devices. Before running the scan in expert mode, configure the expert mode parameters to fine-tune the scan for more precise troubleshooting under OTDR Settings.

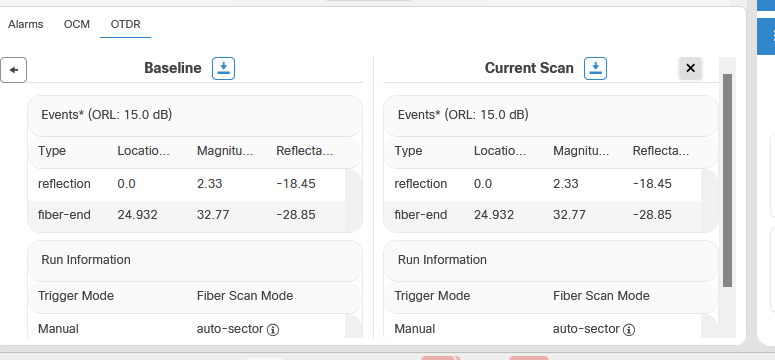
After the scan is complete, you can view the baseline, current scan, run information, and expert mode parameter details in the scan details view.

Multi-region OTDR scan

Cisco NCS 2000 Release 26.1.1

Cisco Optical Site Manager Release 26.3.1

Perform an OTDR scan in multi-region mode by selecting one of the following options, each optimized for a specific region of the fiber span:

  • All

  • Closer (1 km)

  • Short (80 km)

  • Long (> 80 km)

This mode is supported only on NCS 1010. It generates separate SOR files with the corresponding region name included in each filename, making it useful for comprehensive analysis across varying span distances.

Before you begin

Follow these steps to manually run an OTDR scan.

Procedure

  1. Open the OTDR tab for an optical degree.

    1. Click Node Functional View in the left panel.
    2. Right-click an optical degree in the map view and click Open.
    3. Expand the panel at the bottom of the page.
    4. Click the OTDR tab.
  2. Scroll to the bottom of the panel and click the gear icon.

  3. In the Scan Options dialog box, select the scan options.

    1. From the Direction drop down menu, select rx or tx to run the OTDR scan in the RX or TX directions, respectively.
    2. From the Scan Mode drop down menu, select hybrid to run the scan for 1.5 hours or fast to run the OTDR scan in 20 minutes.
    3. From the Fiber Scan Mode drop down menu, select a fiber scan mode.
      Table 3. OTDR fiber scan modes

      Use

      To

      multi-region

      start the OTDR scan in the multi-region mode.

      auto-sector

      Automatically select the optimal values for OTDR.

      expert

      start the OTDR scan in the expert mode.

      Note

      Before running a scan in this mode, configure the expert mode parameters under OTDR Settings dialog box. For more details about configuring the expert mode parameters, see Configure OTDR expert mode settings.

      Note

      Multi-region scan is not supported on NCS 1001.

    4. From the Region drop-down list, select one of these options:
      Note

      This field is only enabled if Fiber Scan Mode is selected as multi-region.

      Table 4. OTDR scan multi-region options

      Region options

      Platform applicable for

      All

      NCS 1010

      closer (1 km)

      NCS 2000

      office - (25 km)

      NCS 2000

      Short (80 km)

      NCS 2000

      long (> 80 km)

      NCS 2000

  4. Click Start Scan button to start OTDR scan.

    The OTDR-SCAN-IN-PROGRESS-RX alarm is raised and displayed on the Alarms tab of the Fault Monitoring menu.

The scan results are displayed in the graph.

What to do next

  1. (Optional) Click the merged multi-region view icon to view office, short, and long trace files in one graph. For more details about merged multi-region view, see Merged multi-region OTDR trace view.

    The icon is available for NCS 1010 multi-region scan results generated with the All region option.

  2. (Optional) Click Stop Scan icon to terminate the OTDR scan.

    An informational message appears indicating that the OTDR scan has been terminated.

  3. (Optional) In the right-side panel, click OTDR Data. This action displays a comprehensive list of OTDR events, including reflections and losses.

    To view detailed analysis data, click the Enhanced View radio-button.

  4. After the scan is completed, click the i icon to view the scan details and download the SOR files.

    Figure 1. OTDR detailed view