Configuration Guide for Cisco Optical Site Manager, IOS XR Release 26.x.x

PDF

Configuration Guide for Cisco Optical Site Manager, IOS XR Release 26.x.x

Optical channel monitoring

Want to summarize with AI?

Log in

This section explains optical channel monitoring in Cisco Optical Site Manager. Optical Channel Monitoring (OCM) is a technology used to monitor the performance and health of optical signals (wavelengths) running through fiber networks.


Optical Channel Monitoring (OCM) is a technology used to monitor the performance and health of optical signals (wavelengths) running through fiber networks. It enables operators to gain real-time visibility into the optical spectrum without disrupting traffic.

OCM improves network visibility, enables proactive maintenance, and provides signal assurance. These enhancements reduce downtime and operational complexity in large optical transport networks.

Additional information

Key features of OCM

The Optical Channel Monitoring capabilities in the NCS 1010 provide the following essential functions for managing and troubleshooting optical networks:

  • Real-Time Spectrum Monitoring: OCM scans the optical C-band and visualizes the power levels of individual optical channels. This feature helps detect signal degradation, identify channel presence or absence, and recognize spectral interference.

  • Integration with NCS 1010 ROADM: The OCM integrated with the ROADM helps validate wavelength routing, power levels, and OSNR (Optical Signal to Noise Ratio).

  • Graphical Spectrum View: Cisco Optical Site Manager provides a visual representation of the spectrum with channel peaks, helping easily spot anomalies.

OCM tab icons and elements

The table describes the action icons available in the OCM tab.

UI Element/Icon

Description

Direction

When graph view is enabled:
  • RX: Select to view the optical spectrum in the RX direction.

  • TX: Select to view the optical spectrum in the TX direction.

When table view is enabled:
  • C-band: Select to view the optical spectrum for the C band.

  • L-band:Select to view the optical spectrum for the L band.

Click this button to change to the table or graph view.

Expected channel missing or underpowered (useful for fault detection).

Reload the graph or table.


View optical channel monitoring data

Use this task to view optical channel monitoring data.

Optical Channel Monitoring (OCM) on Cisco NCS 1010 enables continuous monitoring of optical signal parameters for each individual wavelength on a fiber.

View power levels (in dBm) of individual wavelengths traveling through a fiber using OCM on Cisco NCS 1010.

Before you begin

Log into Cisco Optical Site Manager

Follow these steps to view optical channel monitoring data.

Procedure

  1. Click Node Functional View in the left panel.

  2. Right-click an optical degree in the map view and select Open.

  3. Expand the panel at the bottom of the page.

  4. Click the OCM tab.

  5. Select RX or TX to view the OCM data for the receive or transmit direction in the spectrum graph.

    For more details about the spectrum graph, see OCM spectrum graph.

  6. Click the Spectrum Occupancy Chart button to view the spectrum occupancy table.

    For more details about the spectrum occupancy table, see OCM utilization table.

You can view the transmission or reception power levels for the optical degree you selected in the OCM data and spectrum occupancy graph and table.


OCM spectrum graph

This reference provides information about oCM spectrum graph.

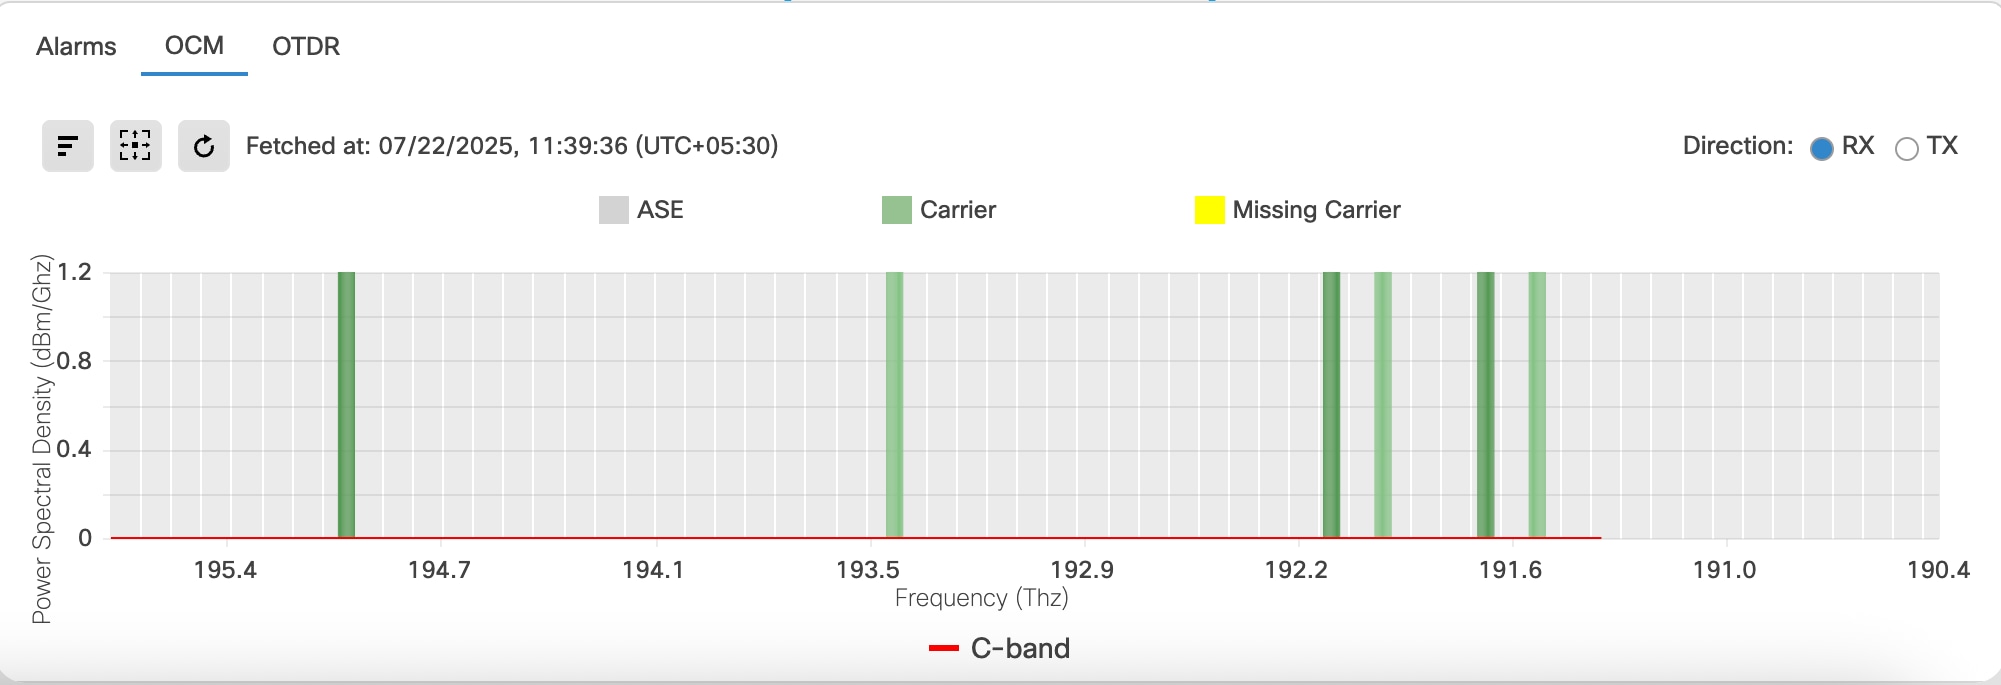
The OCM spectrum graph displays the power spectral density (dBm per GHz) across the optical C-band in the RX or TX directions. This highlights the presence and consistency of carriers.

  • X-Axis (Frequency in THz): Represents optical frequencies that cover the C-band.

  • Y-Axis (Power Spectral Density): Displays signal power in dBm per GHz, indicating the strength of received signals at each frequency.

Figure 1. OCM spectrum graph

OCM spectrum graph color elements

The color coding in the OCM spectrum graph identifies the type of signal at each frequency:

Color

Elements

Description

Green

Carrier

Valid optical channel present at that frequency.

Grey

ASE

Amplified spontaneous emission that represents optical noise level.

Yellow

Missing Carrier

Expected channel missing or underpowered (useful for fault detection).


OCM utilization table

This reference provides information about oCM utilization table.

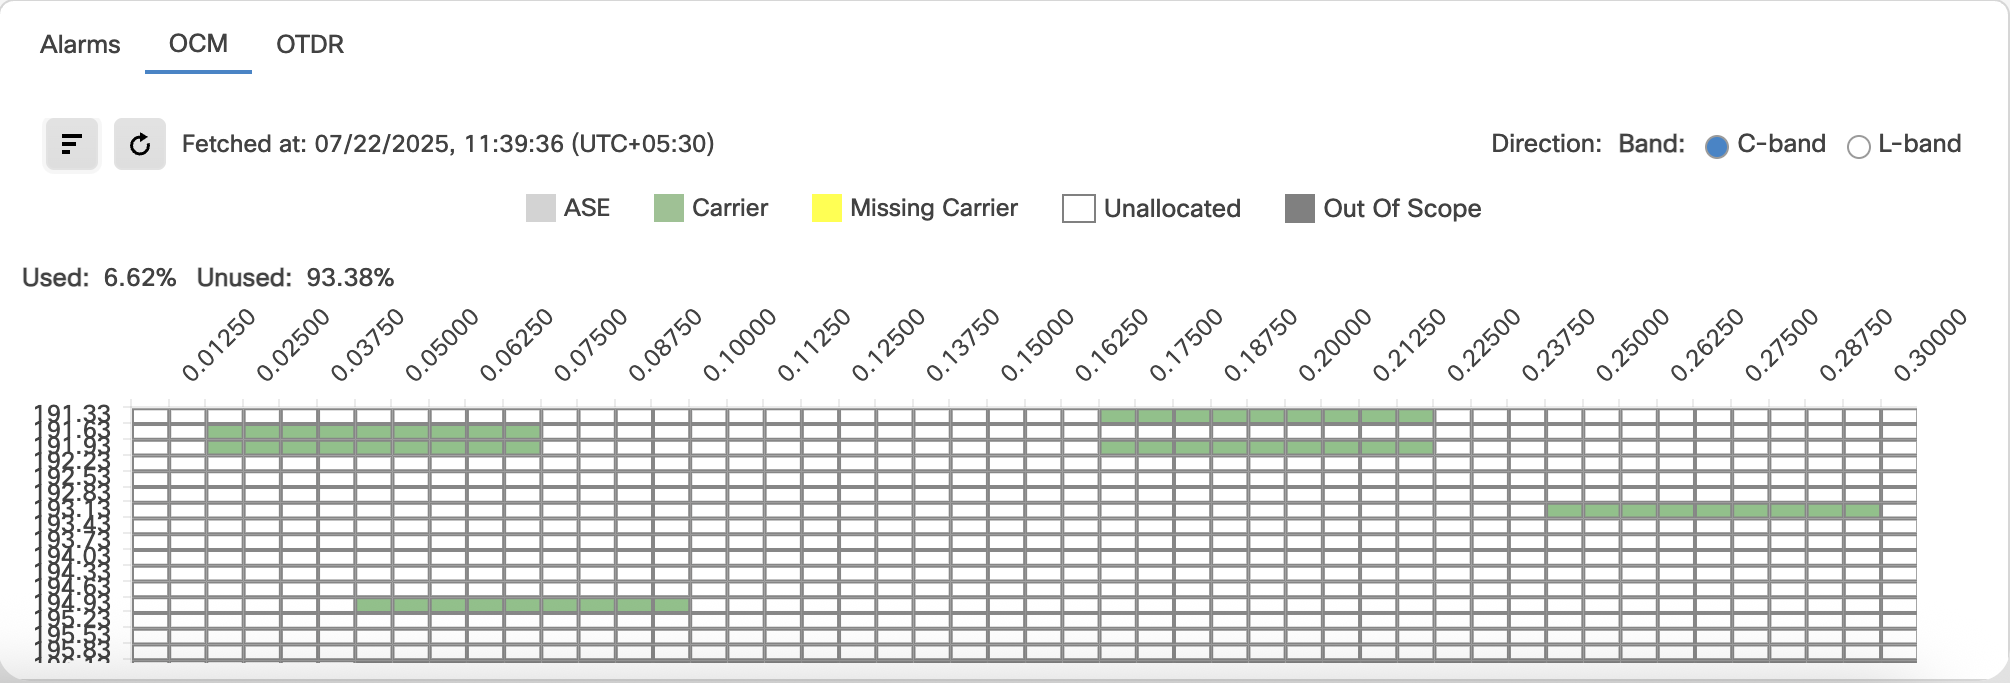
The OCM utilization table presents a frequency-slot grid showing how much of the optical spectrum is currently in use, with each cell representing a discrete frequency-time slot. This table helps network operators quickly assess spectrum occupancy and identify free or underutilized slots for provisioning.

Read and interpret the layout of the OCM table as described in these points:

  • Columns: The columns in the table represent discrete frequency slot positions, indexed using normalized values (e.g., 0.01250, 0.02500), and aligned with the C-band spectrum.

  • Rows: Each row shows a specific optical frequency in THz, arranged from higher to lower values.

Figure 2. OCM utilization table

OCM utilization table color elements

The color coding in the OCM table shows different spectral components:

Table 1. OCM utilization table color coding

Color

Element

Description

Green

Carrier

A green cell shows an active optical signal in that frequency slot and indicates live data traffic or a provisioned channel.

Light Gray

ASE

Light gray cells represent amplified spontaneous emission, which is optical noise.

Yellow

Missing Carrier

A yellow cell means the expected channel is not detected. This result can indicate signal loss, misalignment, or a transponder issue.

Dark Gray

Out of Scope

A dark gray cell shows a frequency region outside the monitoring scope of your current configuration.