Configuration Guide for Cisco Optical Site Manager, IOS XR Release 26.x.x

PDF

Configuration Guide for Cisco Optical Site Manager, IOS XR Release 26.x.x

Fault monitoring

Want to summarize with AI?

Log in

This section explains fault monitoring in Cisco Optical Site Manager. The Fault Monitoring panel displays a summary of all encountered alarms and conditions.


The Fault Monitoring panel displays a summary of all encountered alarms and conditions. It displays the number of Critical (CR), Major (MJ), Minor (MN), Warnings (W), and Non-applicable (NA) alarms. It displays the alarms, transient conditions, and historical alarms that are related to chassis, passive devices, pluggables, line cards, amplifier cards, and control cards. You can also create custom alarm profiles and apply them on the node using this pane.
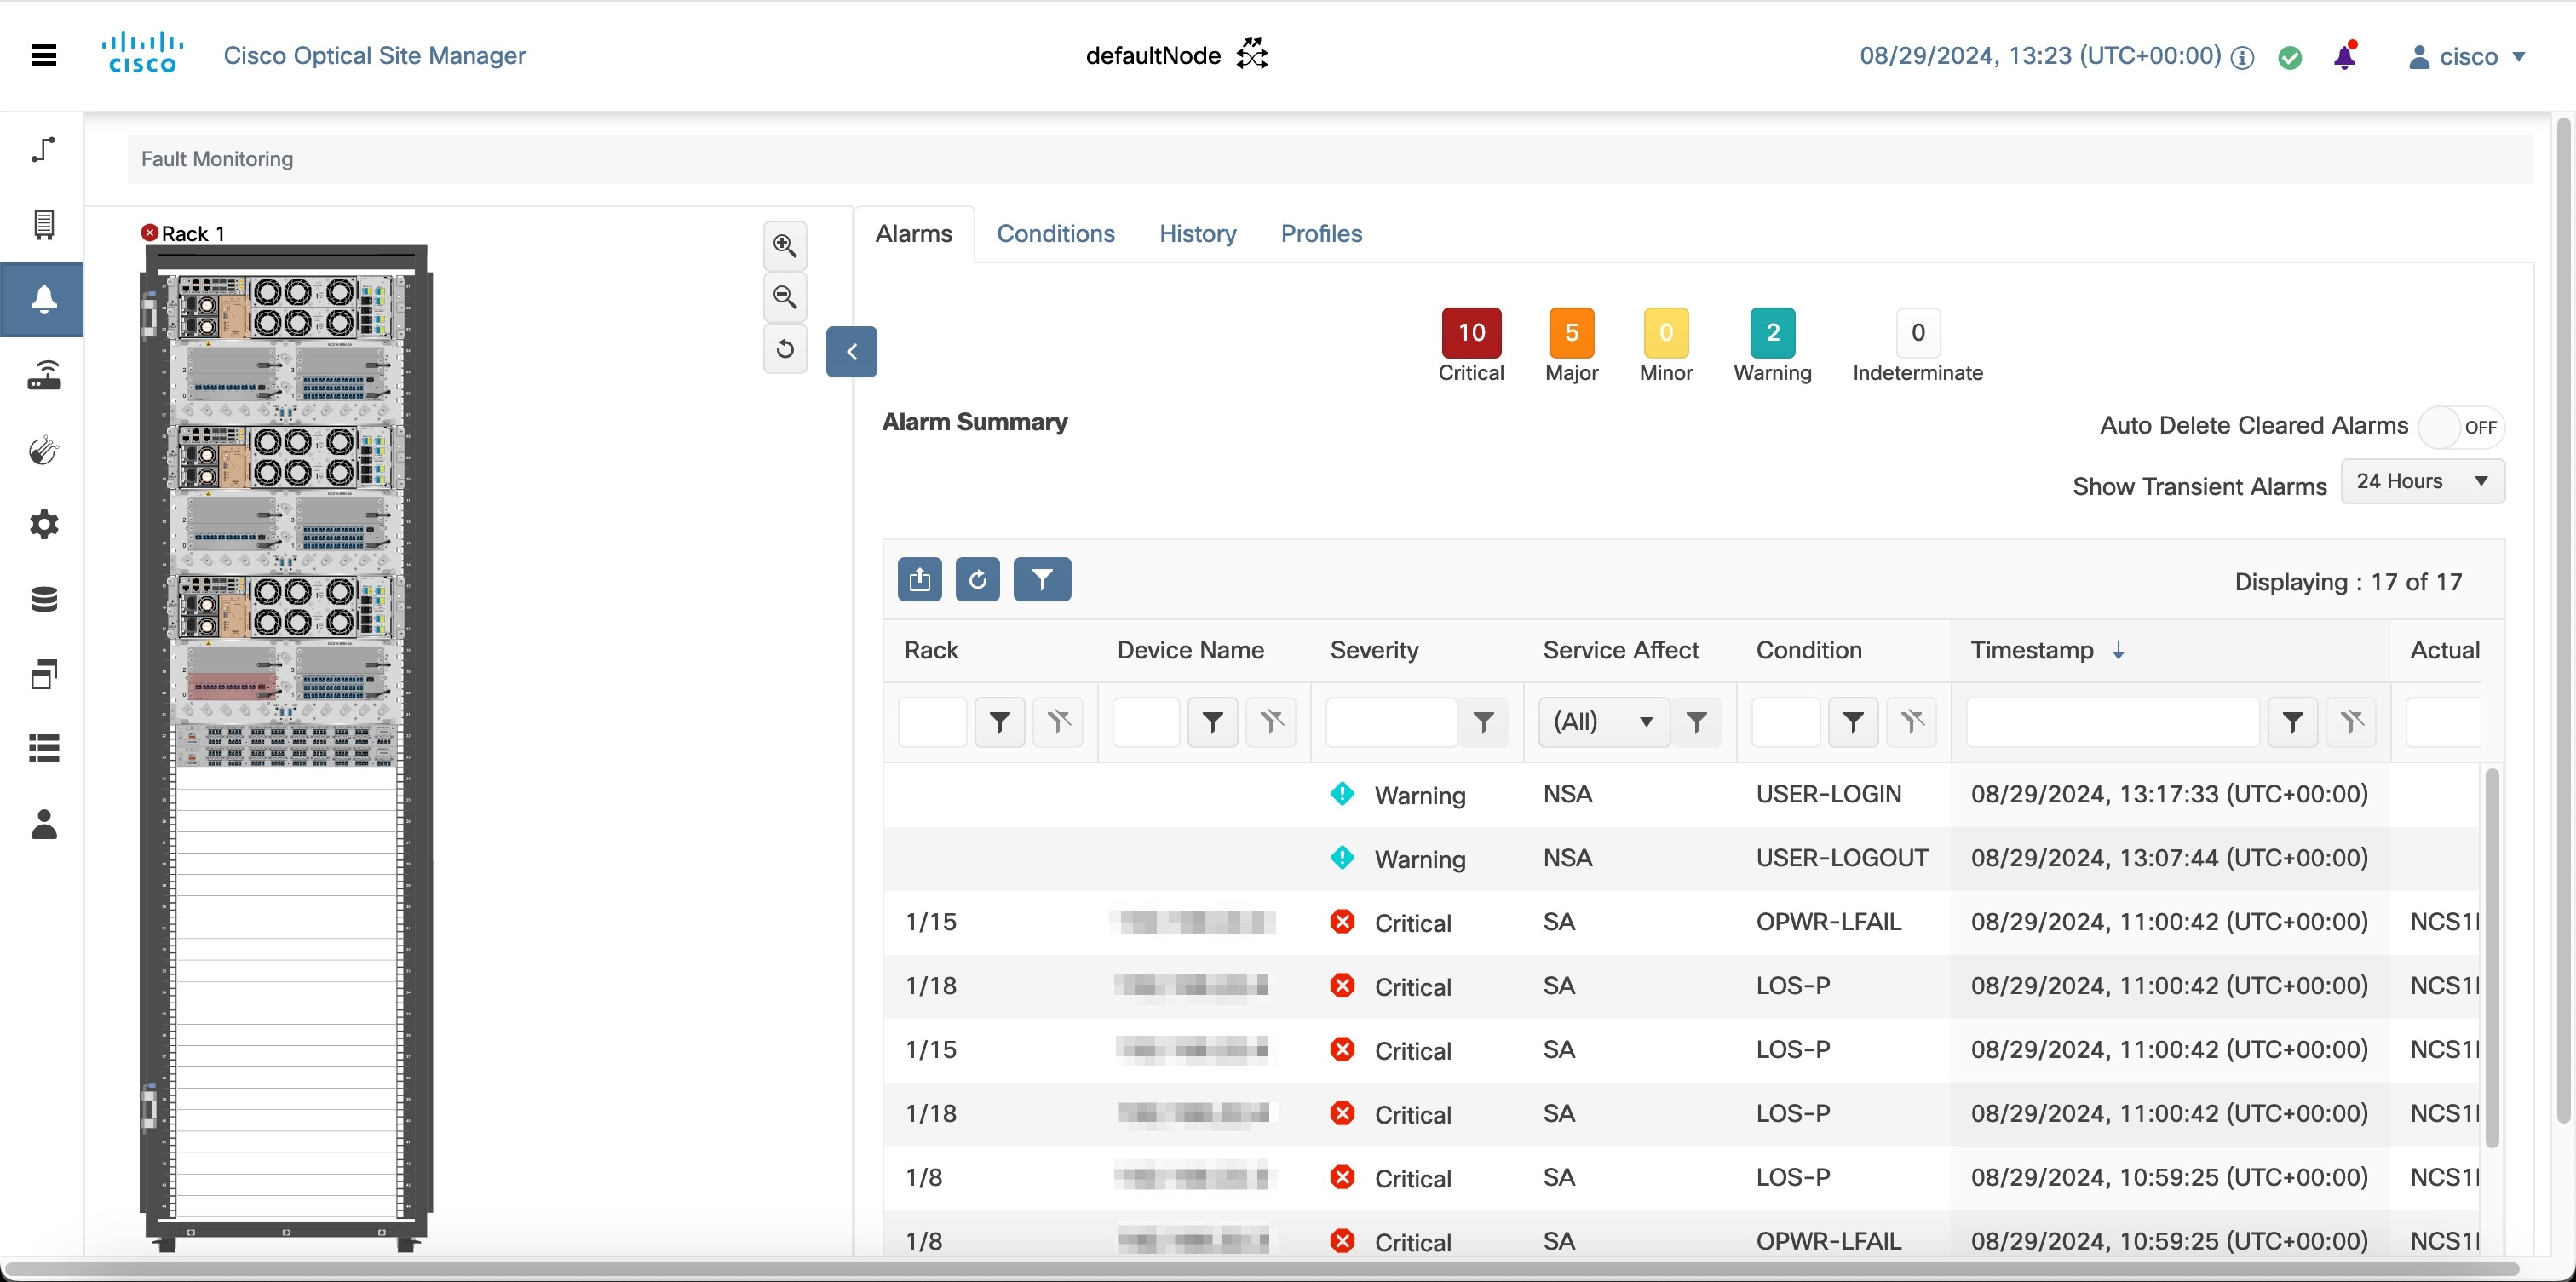
Figure 1. Fault Monitoring
Note

The Cisco Optical Site Manager UI begins capturing XR alarms only after the Cisco Optical Site Manager package is activated. As a result, any alarms generated on the device before this activation are not synchronized with the Cisco Optical Site Manager UI. This leads to a discrepancy where the IOS-XR CLI may show a more complete set of alarms compared to what is available in the Cisco Optical Site Manager UI.


View rack, chassis, or card alarms

Use this task to view rack, chassis, or card alarms.

You can view the alarms raised on a rack, chassis, or card from the Alarms tab.

Before you begin

Log into Cisco Optical Site Manager

Follow these steps to view rack, chassis, or card alarms.

Procedure

  1. Click Topology in the left panel.

    The Topology page appears.
  2. Perform one of the following steps to view alarms for a rack, chassis or card:

    • Click the rack name from the Rack view to view alarms for a rack.

    • Right-click the chassis screws from the Rack view and select Open to view alarms for a chassis.

    • Right-click the card from the Rack view and select Open to view alarms for a card.

    The Alarms tab displays alarms with various severities, each indicated by a different color:

    • Critical

    • Major

    • Minor

    • Warning

    • Intermediate

  3. (Optional) Select a sepcific time slot from the Show Transient Alarms drop-down list to view alarms for a specific time slot.

  4. (Optional) Click the Auto Delete Cleared Alarms toggle button to automatically delete the cleared alarms.

  5. (Optional) Click the Excel Export button to export and download the alarms to an Excel sheet.

You can view, filter, manage, and export alarms by severity for specific racks, chassis, or cards.


View all alarms and conditions

Use this task to display, filter, and export alarms and transient conditions in Cisco Optical Site Manager (COSM). This task helps you identify system issues and confirm component health across the managed site.

  • Inspect active alarms and transient conditions for system components.

  • Export alarms for reporting or archival purposes.

  • Enable or disable automatic deletion of cleared alarms as required.

Note

Cisco Optical Site Manager relies on the default IOS XR syslog format for alarm, event, and notification processing. To ensure proper network monitoring and management, RFC 5424 syslog formatting must not be enabled on devices managed by Cisco Optical Site Manager.

The alarms view aggregates notifications from racks, chassis, cards, and ports. Use it to monitor severity, age, and history of alarmed conditions across the site.

Note

The Cisco Optical Site Manager Web UI does not display OTS-OCH alarms raised on the NCS1K-MD-32E-CE device in an MOLS 2.0 setup of NCS 1014, even when no cross-connect configuration is present. Verify device-side alarms in such deployments.

Before you begin

Follow these steps to view all alarms and transient conditions:

Procedure

  1. Click Fault Monitoring in the left panel.

    Alternatively, click the bell icon in the top-right corner to open the alarms view.

  2. Click the Alarms tab to view all active alarms.

    Alarms are shown with severities such as Critical, Major, Minor, Warning, and Intermediate. Each severity is indicated by a distinct color.

  3. Click the Conditions tab to view transient conditions.

  4. Click the History tab to review historical alarm events and cleared alarms.

  5. (Optional) Toggle Auto Delete Cleared Alarms to automatically remove cleared alarms from the list.

    When enabled, cleared alarms are removed automatically according to the UI setting; when disabled, cleared alarms remain visible in the History view for manual review.

  6. (Optional) Click Excel Export to export the currently displayed alarms to an Excel file.

    Use the exported sheet for reporting or offline analysis.

The Alarms tab lists active alarms with details such as severity, timestamp, source component, and a brief description. The Conditions tab lists transient conditions and the History tab shows historical alarm events and cleared alarms.

Use exported alarm data for diagnostics, reporting, or to correlate events with device-side logs.


View correlated alarms

Use this task to view correlated alarms.

Table 1. Feature History

Feature Name

Release Information

Description

Correlated Alarms

Cisco IOS XR Release 25.1.1

You can now view correlated alarms for a device in the Alarms tab, streamlining system performance management by highlighting primary alarms and suppressing secondary ones.

Before you begin

Log into Cisco Optical Site Manager

Follow these steps to view correlated alarms.

Procedure

  1. Click Fault Monitoring in the left panel.

    Alternatively, you can also click the bell icon on the top-right corner.

  2. Click the Alarms tab.

    Alarms are displayed with several severities, such as Critical, Major, Minor, Warning, and Intermediate. The alarm severities are indicated by different colors.
  3. Click the Expand Correlated Alarms icon under the Severity column next to the device name to view the correlated alarms.

    The RCA table displays a list of the correlated alarms for the device.
  4. Click Back to Alarms Overview button to go back to alarms list.

The view correlated alarms task is complete.


View rack, chassis, or card transient conditions

Use this task to view rack, chassis, or card transient conditions.

View transient conditions on network components such as racks, chassis, and cards. You can download these conditions to an Excel report for further analysis.

Before you begin

Log into Cisco Optical Site Manager

Follow these steps to view rack, chassis, or card transient conditions.

Procedure

  1. Click Topology in the left panel.

    The Topology page appears.
  2. Perform one of the following steps to view the transient conditions:

    If you want to view the ...

    then

    transient conditions for a rack

    click the rack name.

    transient conditions for a chassis

    right-click the chassis screws and select Open.

    transient conditions for a card

    right-click the card and select Open.

  3. Click the Conditions tab.

  4. Select a time slot from the Show Transient Alarms In drop-down list to view transient conditions for a specific time slot.

  5. (Optional) Click the Excel Export button to export the transient conditions to an Excel sheet.

The view rack, chassis, or card transient conditions task is complete.


View alarms history

Use this task to view alarms history.

View the alarms history to track and analyze past network issues for effective troubleshooting and trend identification.

Before you begin

No prerequisites are documented in the source content.

Follow these steps to view alarms history.

Procedure

  1. Click COSM Topology in the left panel.

    The COSM Topology page appears.
  2. Perform one of the following steps to view the alarms history:

    If you want to ...

    then

    view alarms history for a rack

    click the rack name from the rack view.

    view alarms history for a chassis

    right-click the chassis screws from the rack view and select Open.

    view alarms history for a card

    right-click the card from the Rack view and select Open.

  3. Click the History tab.

    The alarms are displayed with various severities, each indicated by a different color:

    • Critical

    • Major

    • Minor

    • Warning

    • Intermediate

  4. (Optional) Click the Excel Export button to export the alarms hisyory to an Excel sheet.

The view alarms history task is complete.


Change alarm severity and suppress alarms

Use this task to manage alert notifications by adjusting the severity level of alarms and suppressing alarms as needed. Changing alarm severity helps prioritize critical alerts, while suppression prevents unnecessary or redundant notifications, enabling a more efficient monitoring workflow.

Table 2. Feature History

Feature Name

Release Information

Description

Enhanced Alarm Notification Management

Cisco IOS XR Release 26.1.1

You can now manage alert notifications from the Alarms tab by adjusting alarm severity levels and suppressing alarms as needed.

Changing alarm severity helps you prioritize critical alerts, while suppression prevents unnecessary or redundant notifications, resulting in a more efficient monitoring workflow.

Procedure

  1. Click Fault Monitoring in the left panel.

  2. In the Alarms tab, locate the alarm you want to update in the Condition column.

  3. Click the settings icon next to the alarm.

  4. Click the Change Severity drop-down list and select the desired severity level for the alarm.

  5. (Optional) Select the Suppress check box to suppress the alarm.

  6. In the Target section, do one of the following:

    • Select the devices from the Chassis Selection drop-down list on which you want to change the alarm severity.
    • Select the Every Chassis check box to apply the change to all chassis.

  7. Click Apply.

    Changes are applied and a new alarm profile is created in the Profiles tab under Alarm Profile.
  8. To revert the change, locate the alarm in the Condition column under the Alarms tab and click Restore Default.

The alarm’s severity is updated as selected, and suppressed alarms are no longer displayed or trigger notifications according to your configured settings.