Cisco Security Cloud Control: Secure Firewall Management

PDF

Cisco Security Cloud Control: Secure Firewall Management

Splunk Federated Search Integration with Cisco Security Analytics and Logging

Want to summarize with AI?

Log in

Describes the integration between Splunk Federated Search and Cisco Security Analytics and Logging for searching firewall events across multiple Splunk deployments.


Splunk Federated Search integration with Cisco Security Analytics and Logging is a cloud-based integration that

  • enables Splunk administrators to search Cisco Secure Firewall Threat Defense events stored in Cisco Security Analytics and Logging without direct ingestion into Splunk Cloud Platform

  • allows viewing analytics, running reports, and investigating incidents directly from the Splunk Cloud Platform interface, and

  • provides federated search capabilities across multiple Splunk deployments or environments from a single search interface.

Integration details

Terminology Note: In this document, "Cisco Security Analytics and Logging" refers specifically to Cisco Security Analytics and Logging (SaaS), which is a cloud-based platform that serves as a central repository for aggregated security event data.

Splunk Federated Search is a feature that is available in both Splunk Cloud Platform and Splunk Enterprise. You can use Splunk Federated Search to search and analyze data across multiple Splunk deployments or environments from a single search interface. For more information, see Splunk Federated Search.

Using the Splunk Federated Search feature, Cisco Security Analytics and Logging can be added as a dataset in the Splunk Cloud Platform. This integration enables Splunk administrators to search the Cisco Secure Firewall Threat Defense events stored in Cisco Security Analytics and Logging, without having to ingest them into the Splunk Cloud Platform directly. Splunk administrators can also view analytics, run reports, and investigate incidents directly from the Splunk Cloud Platform interface. For more information on the logs stored in Cisco Security Analytics and Logging, see Security Analytics and Logging (SaaS) in Security Cloud Control.

Benefits of Splunk Federated Search integration with Cisco Security Analytics and Logging:

  • Accelerated security investigations: Run federated queries on historical firewall logs without any storage overhead.

  • Wider data coverage: Enable the Splunk Cloud Platform users to leverage data stored in Cisco Security Analytics and Logging for security investigation, operational monitoring, and business intelligence.

  • End-to-end visibility: Correlate real-time alerts with historical data seamlessly.

  • Statistical analysis over time: Analyze large historical datasets for trends and threat patterns.

  • Compliance readiness: Maintain searchable, long-term logs to meet audit and regulatory needs.

  • Operational efficiency: Enable SecOps teams to access logs directly, eliminating the need for NetOps teams to provide access.

Region compatibility for tenant mapping

Each Cisco SAL tenant belongs to a Cisco Security Cloud Control region. Each Splunk Cloud Platform deployment runs in an AWS region. Splunk software supports a tenant mapping only when the deployment's AWS region corresponds to the tenant's Cisco Security Cloud Control region.

Table 1.

Cisco Security Cloud Control region

Corresponding Splunk Cloud Platform deployment AWS regions

https://us.manage.security.cisco.com/

us-east-1 (N. Virginia), us-west-2 (Oregon)

https://eu.manage.security.cisco.com/

eu-central-1 (Frankfurt), eu-north-1 (Stockholm), eu-south-1 (Milan), eu-west-1 (Ireland), eu-west-2 (London), eu-west-3 (Paris)

https://apj.manage.security.cisco.com/

ap-northeast-1 (Tokyo), ap-northeast-2 (Seoul), ap-southeast-1 (Singapore), ap-southeast-3 (Jakarta)

https://in.manage.security.cisco.com/

ap-south-1 (Mumbai)

https://aus.manage.security.cisco.com/

ap-southeast-2 (Sydney)


How Splunk Federated Search Integrates with Cisco Security Analytics and Logging

Splunk Federated Search integration with Cisco Security Analytics and Logging is a cloud-native security architecture that

  • enables federated search queries from Splunk Cloud Platform to access security event data in Cisco Security Analytics and Logging without local data ingestion

  • leverages token-based authentication to authorize data access between the platforms, and

  • centralizes security event visibility through Security Cloud Control for unified security management across hybrid and multicloud environments.

Integration components and data flow

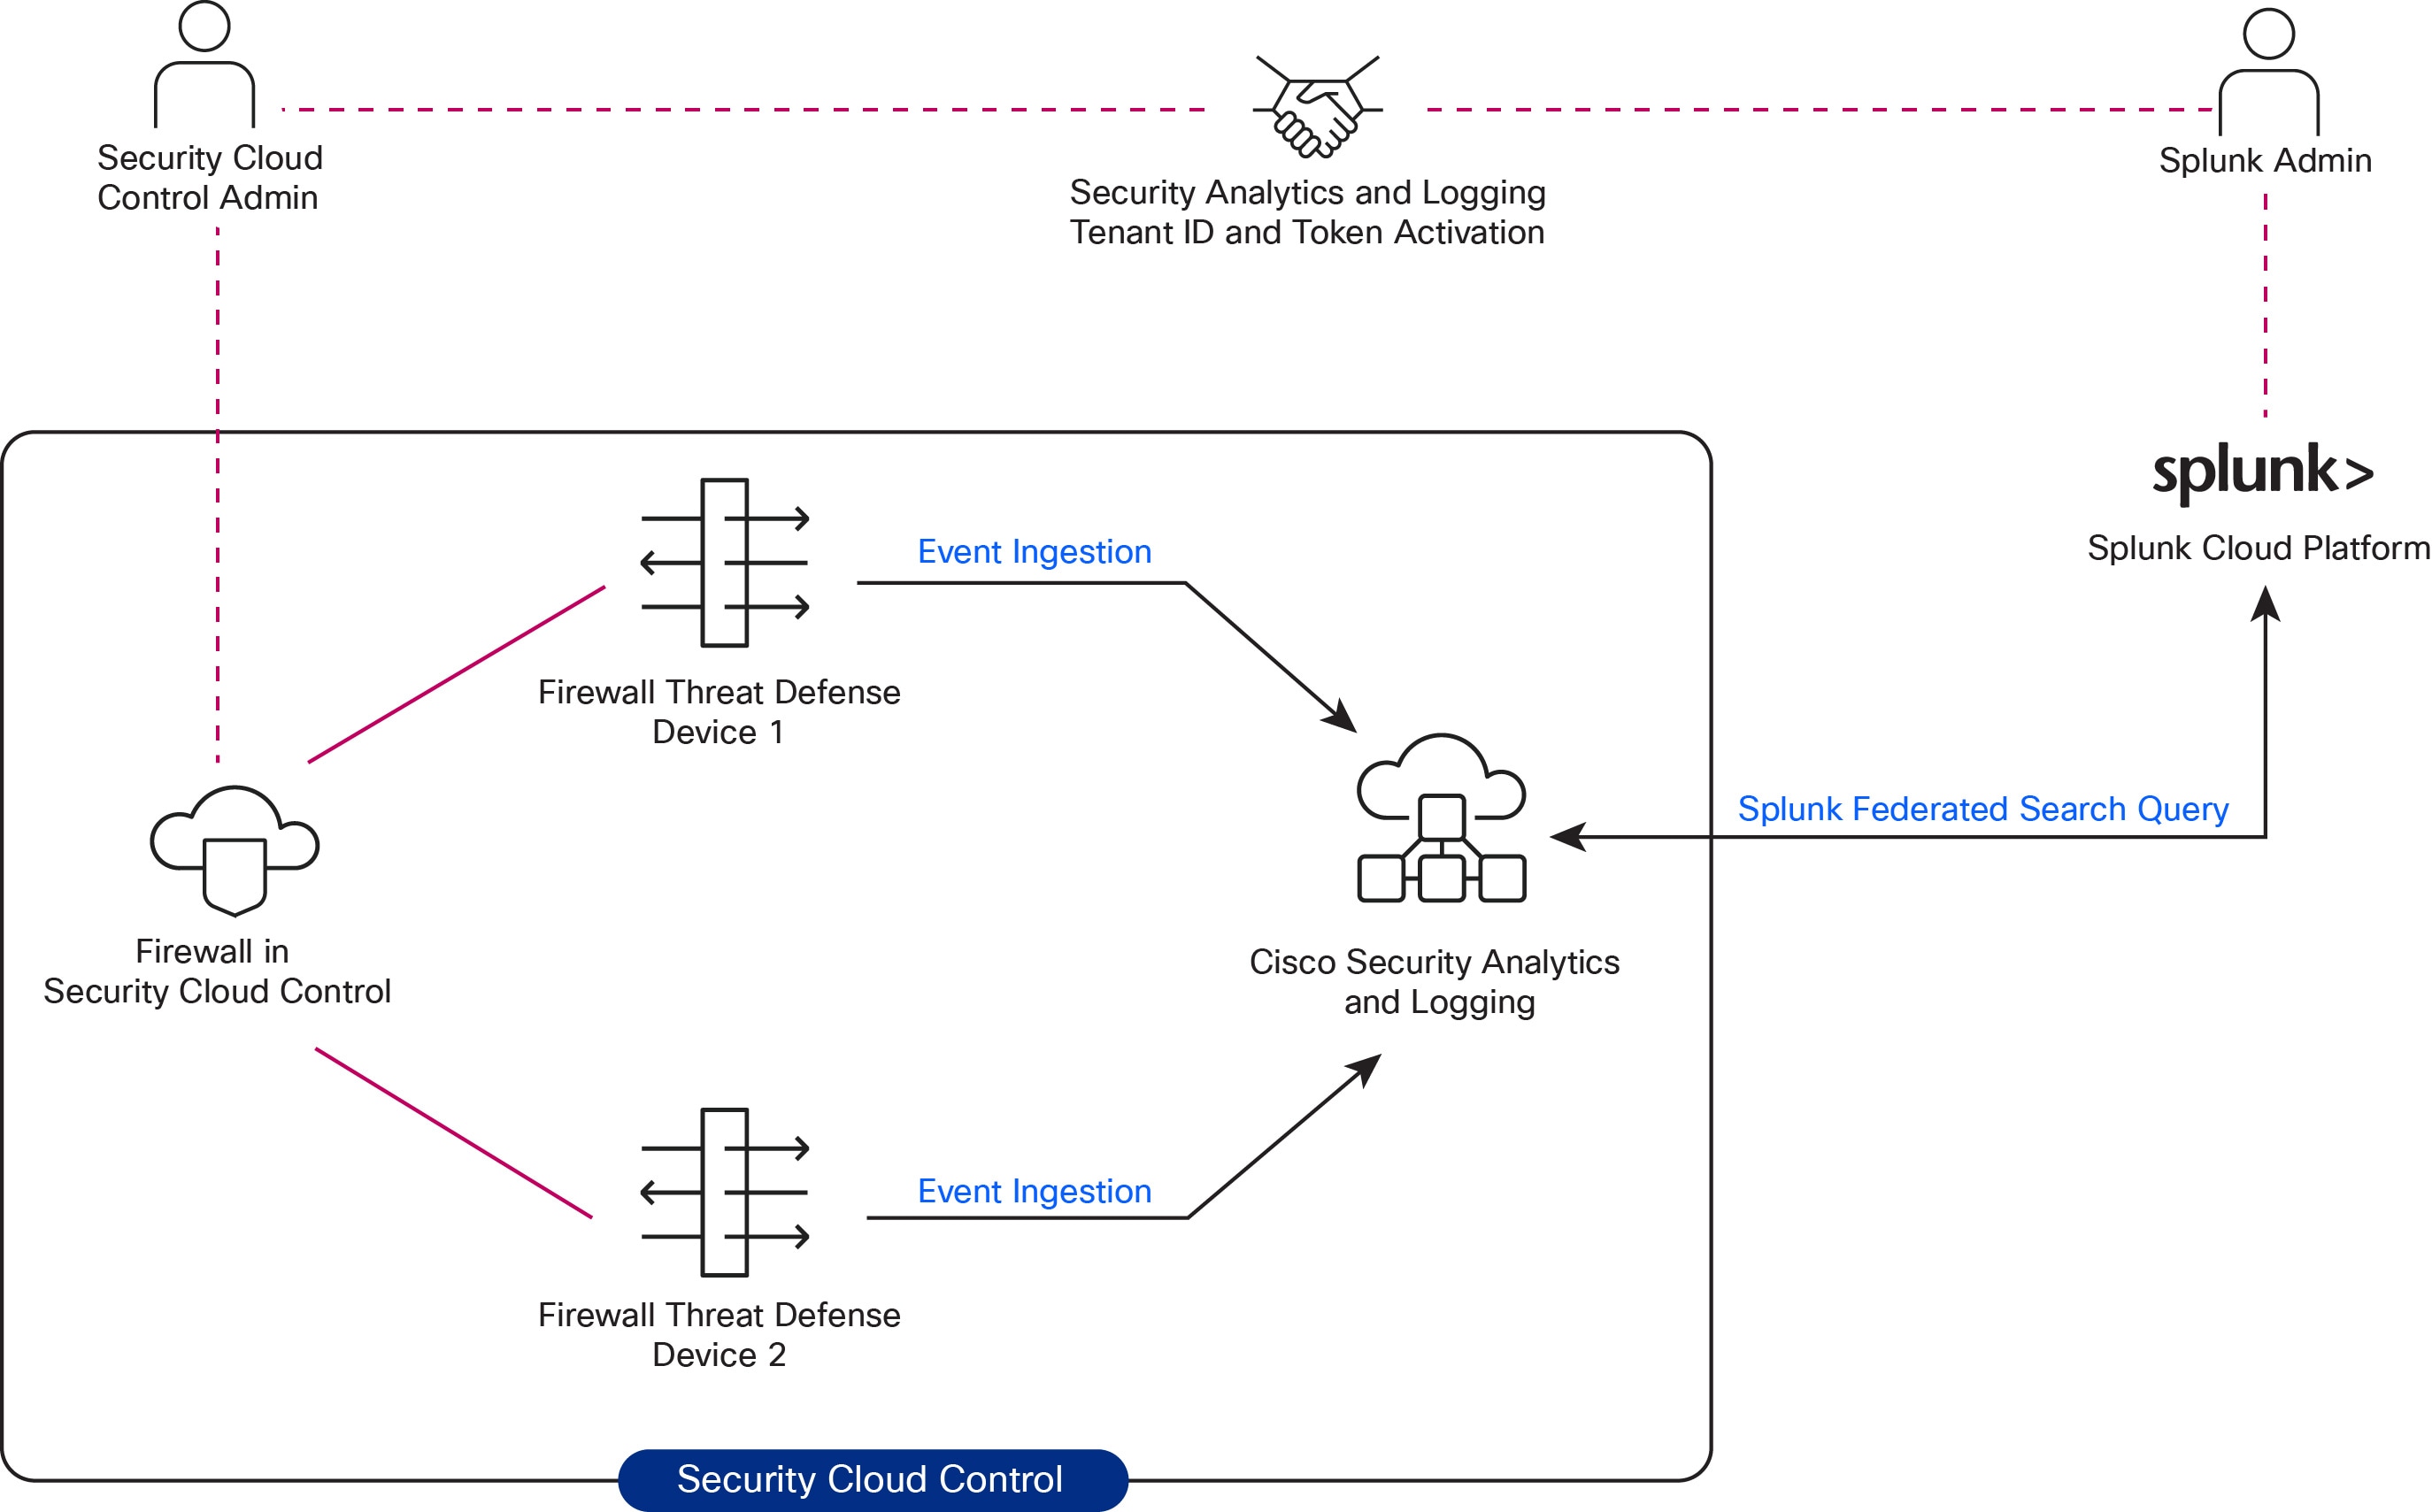
This topology shows the flow of information and interactions between the following components:

This topology illustrates the flow of information and interactions between integration components for centralized security management across hybrid and multicloud environments.
  • Security Cloud Control: A unified, cloud-native security management interface designed to centralize and simplify the management of Cisco security solutions across hybrid and multicloud environments. It leverages Cisco Security Analytics and Logging to provide visibility into security events and trends.

  • Cisco Security Analytics and Logging: This cloud-based platform serves as a central repository for aggregated security event data from various sources, including the Cisco Secure Firewall Threat Defense devices. It ingests event logs from these devices and allows Splunk Federated Search to query this event data.

  • Security Cloud Control admin: This administrator manages the Security Cloud Control platform, overseeing the configuration and operational status of security devices like firewalls. They are responsible for setting up the necessary integrations, including the activation of the access token for Cisco Security Analytics and Logging.

  • Cisco Security Analytics and Logging token activation: A access token-based mechanism is employed to authenticate and authorize Splunk and Cisco Security Analytics and Logging service interactions. It ensures that event data in Cisco Security Analytics and Logging can be queried by Splunk Federated Search.

  • Splunk admin: This administrator is responsible for managing the Splunk environment and leveraging its capabilities for security analysis. The admin configures and initiates federated searches to query and retrieve security event data from external platforms, such as Cisco Security Analytics and Logging, without needing to ingest all data locally.

  • Splunk Federated Search query: This refers to the query initiated from Splunk Cloud platform to access and analyze data residing in Cisco Security Analytics and Logging. All Firewall Threat Defense security events can be queried from the Splunk Cloud Platform.

  • Splunk Cloud Platform: This represents the Splunk Security Information and Event Management (SIEM) platform, which utilizes its federated search capability to integrate with Cisco Security Analytics and Logging. This integration allows the security teams to query event data from Cisco Security Analytics and Logging without needing to ingest data locally.


How Splunk Federated Search integration works with Cisco Security Analytics and Logging

This integration allows organizations to leverage both Splunk Cloud Platform capabilities and Cisco Security Analytics and Logging data through federated search functionality.

Summary

The key components involved in the Splunk Federated Search integration process are:

  • Firewall Threat Defense devices: Generate security events and send them to Cisco Security Analytics and Logging

  • Security Cloud Control: Manages the integration configuration and provides access tokens for Splunk

  • Splunk Cloud Platform: Configures dataset and role-based access controls

  • Splunk administrators: Configure the Splunk side of the integration and manage user access

Workflow

The completed integration enables users to perform federated searches of Cisco Security Analytics and Logging data directly from the Splunk Cloud Platform interface, providing unified access to security event data across both platforms.

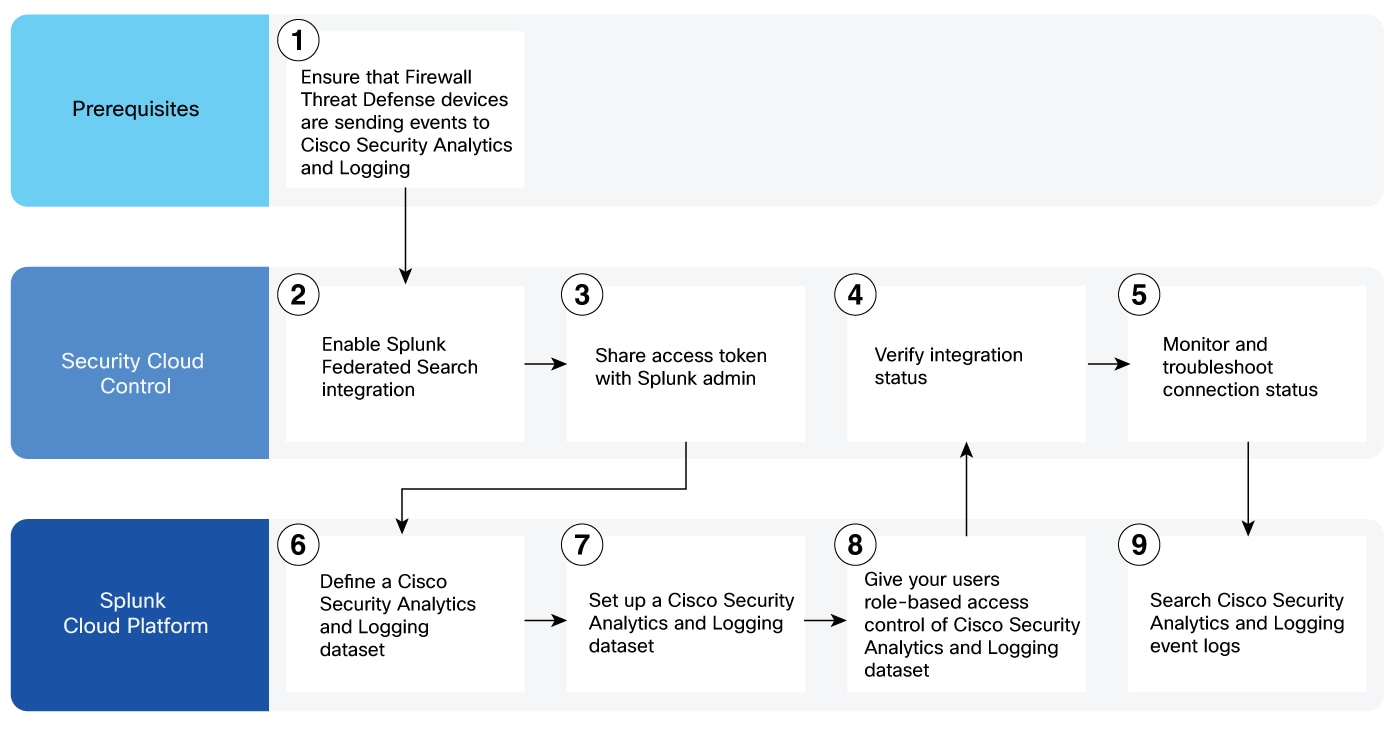
Workflow of Splunk Federated Search Integration with Cisco Security Analytics and Logging

These stages describe how the Splunk Federated Search integration with Cisco Security Analytics and Logging works:

  1. Prerequisites phase: Firewall Threat Defense devices send security events to Cisco Security Analytics and Logging.

  2. Integration enablement phase: Security Cloud Control administrator enables the integration and shares access credentials.

  3. Splunk configuration phase: Splunk Cloud Platform administrator configures the federated search components.

    • Define a Cisco Security Analytics and Logging dataset. For more information, see Splunk Federated Search for Cisco Analytics and Logging (SAL) - Splunk Side.

    • Set up a Cisco Security Analytics and Logging dataset. For more information, see Splunk Federated Search for Cisco Analytics and Logging (SAL) - Splunk Side.

    • Give your users role-based access control of Cisco Security Analytics and Logging datasets. For more information, see Splunk Federated Search for Cisco Analytics and Logging (SAL) - Splunk Side.

  4. Verification and monitoring phase: Security Cloud Control administrator verifies integration status and monitors ongoing operations.

  5. Operational phase: Users search Cisco Security Analytics and Logging event logs through Splunk Cloud Platform.


Requirements for Splunk Federated Search Integration with Cisco Security Analytics and Logging

Prerequisites

Ensure you meet these requirements before initiating the Splunk Federated Search integration with Cisco Security Analytics and Logging.

  • You must have Super Admin user role in Security Cloud Control platform to initiate the Splunk Federated Search integration with Cisco Security Analytics and Logging by generating the access token. Users without Super Admin privileges can only view the Splunk Federated Search integration flow.

  • Ensure that the Firewall Threat Defense devices deployed on the Security Cloud Control platform are sending intrusion, file and malware, and connection events to Cisco Security Analytics and Logging.

Limitation

By default, only up to 30 days of log data from Cisco Security Analytics and Logging is available for federated search.


Enable Splunk Federated Search Integration with Cisco Security Analytics and Logging

Generate a secure access token that authenticates and authorizes interactions between the Splunk Cloud Platform and the Cisco Security Analytics and Logging service for data access.

Use this procedure to generate the access token that can be copied and shared with the Splunk administrator to enable access to Cisco Security Analytics and Logging data. The secure access token is automatically generated and is used to authenticate and authorize interactions between the Splunk Cloud Platform and the Cisco Security Analytics and Logging service. These tokens are generated per tenant and can be renewed manually.

Procedure

  1. From the Security Cloud Control Home page, click Firewall.

  2. From the left pane, choose Administration > Integrations > Splunk > Splunk Federated Search.

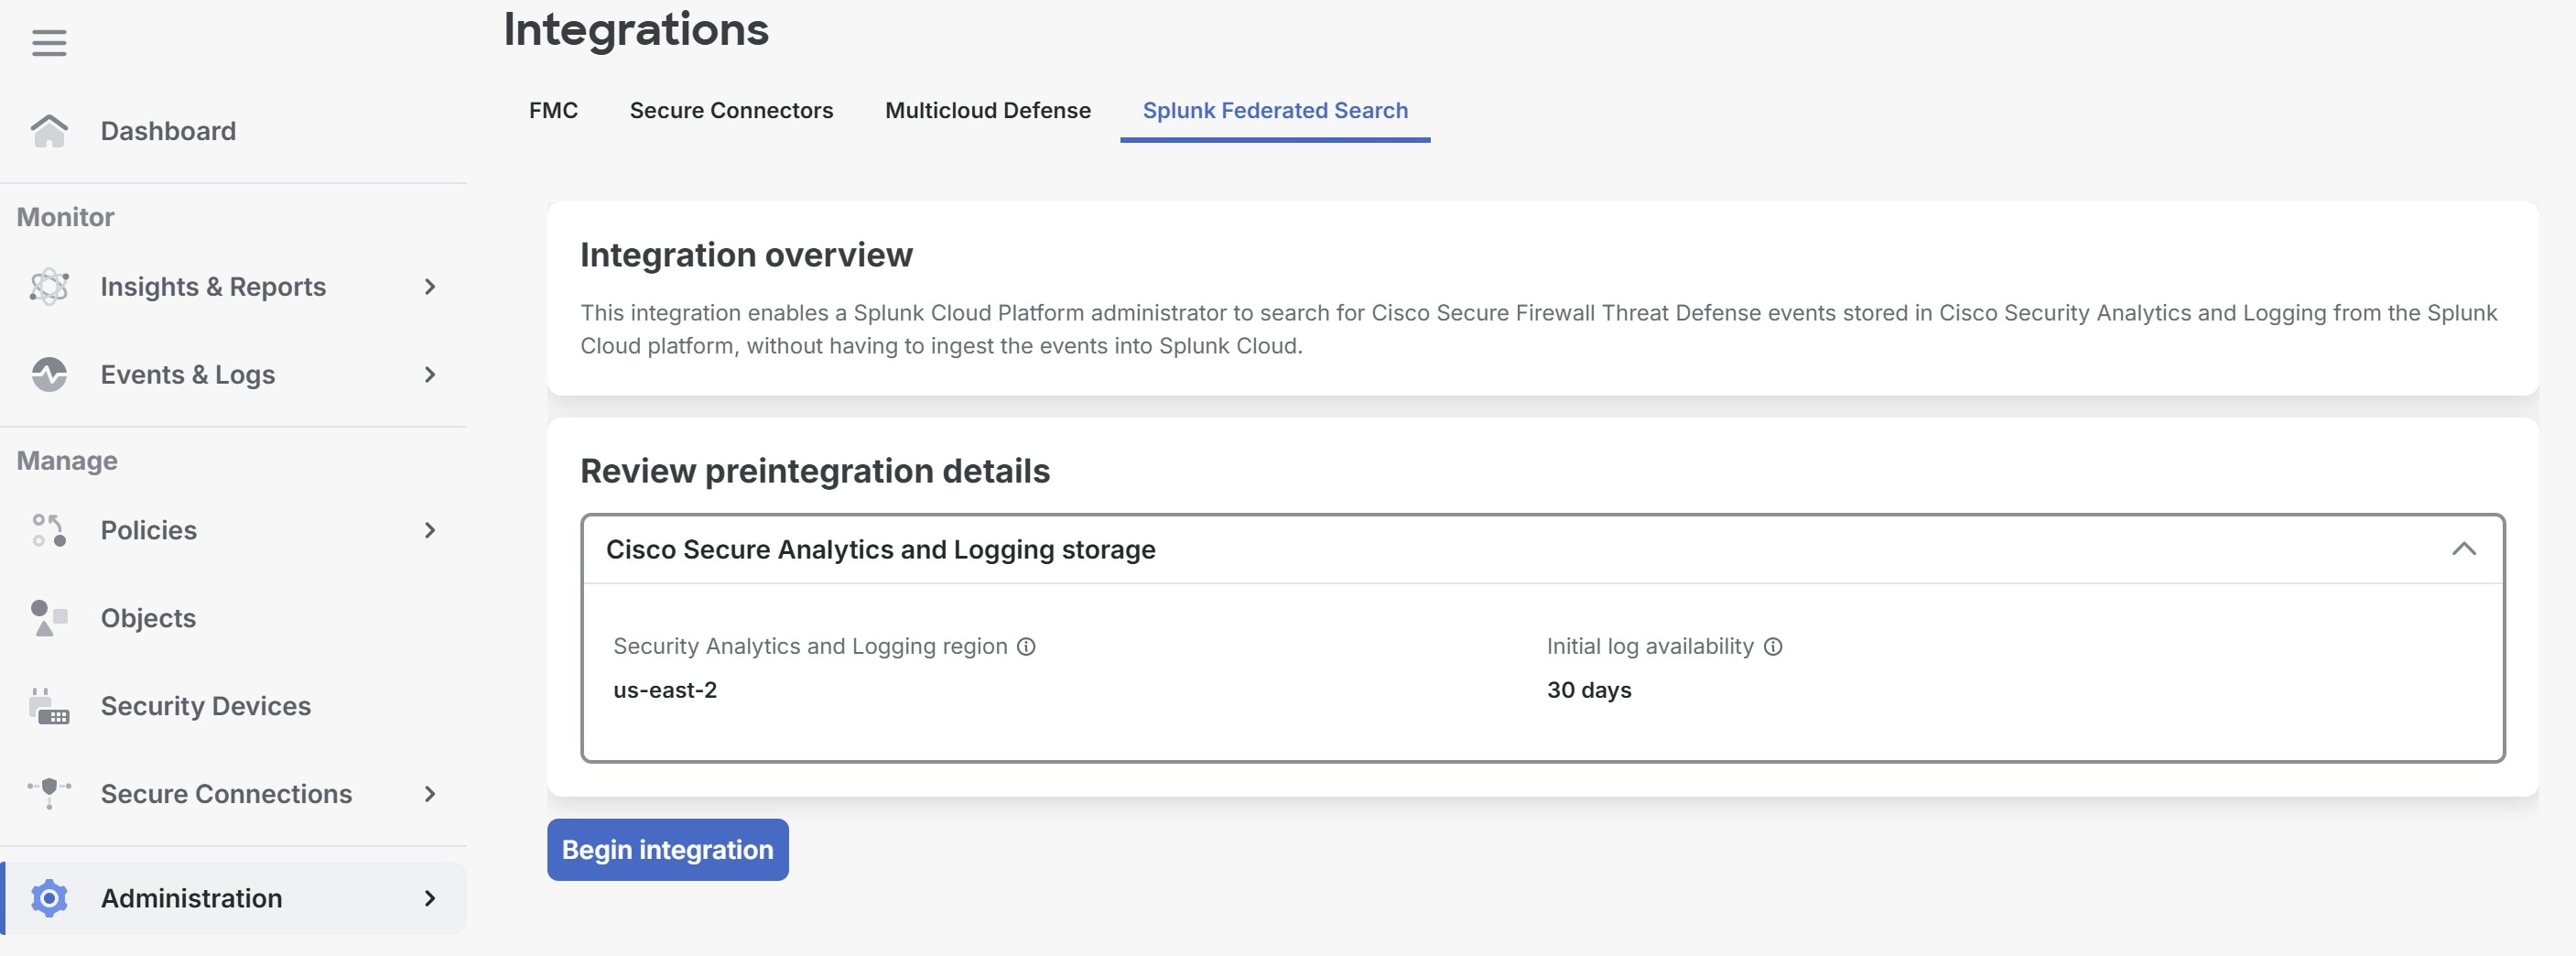
  3. Under the Splunk Federated Search tab, review the preintegration details and click Begin integration.

    Image of Splunk Federated Search tab

    The initial log availability is up to 30 days, that is, up to 30 days of firewall event data is available for Splunk Federated Search.

    Note

    This step may take a few minutes to complete. The time taken depends on the volume of event data stored in Cisco Security Analytics and Logging.

    You can click Cancel integration to cancel the integration at this stage. No changes will be made to your Cisco Security Analytics and Logging environment and access will not be granted to Splunk Cloud Platform if you cancel the integration.

  4. After you see the Configuration successful message, click Generate token.

    If you see the Configuration failed message, click Retry setup.

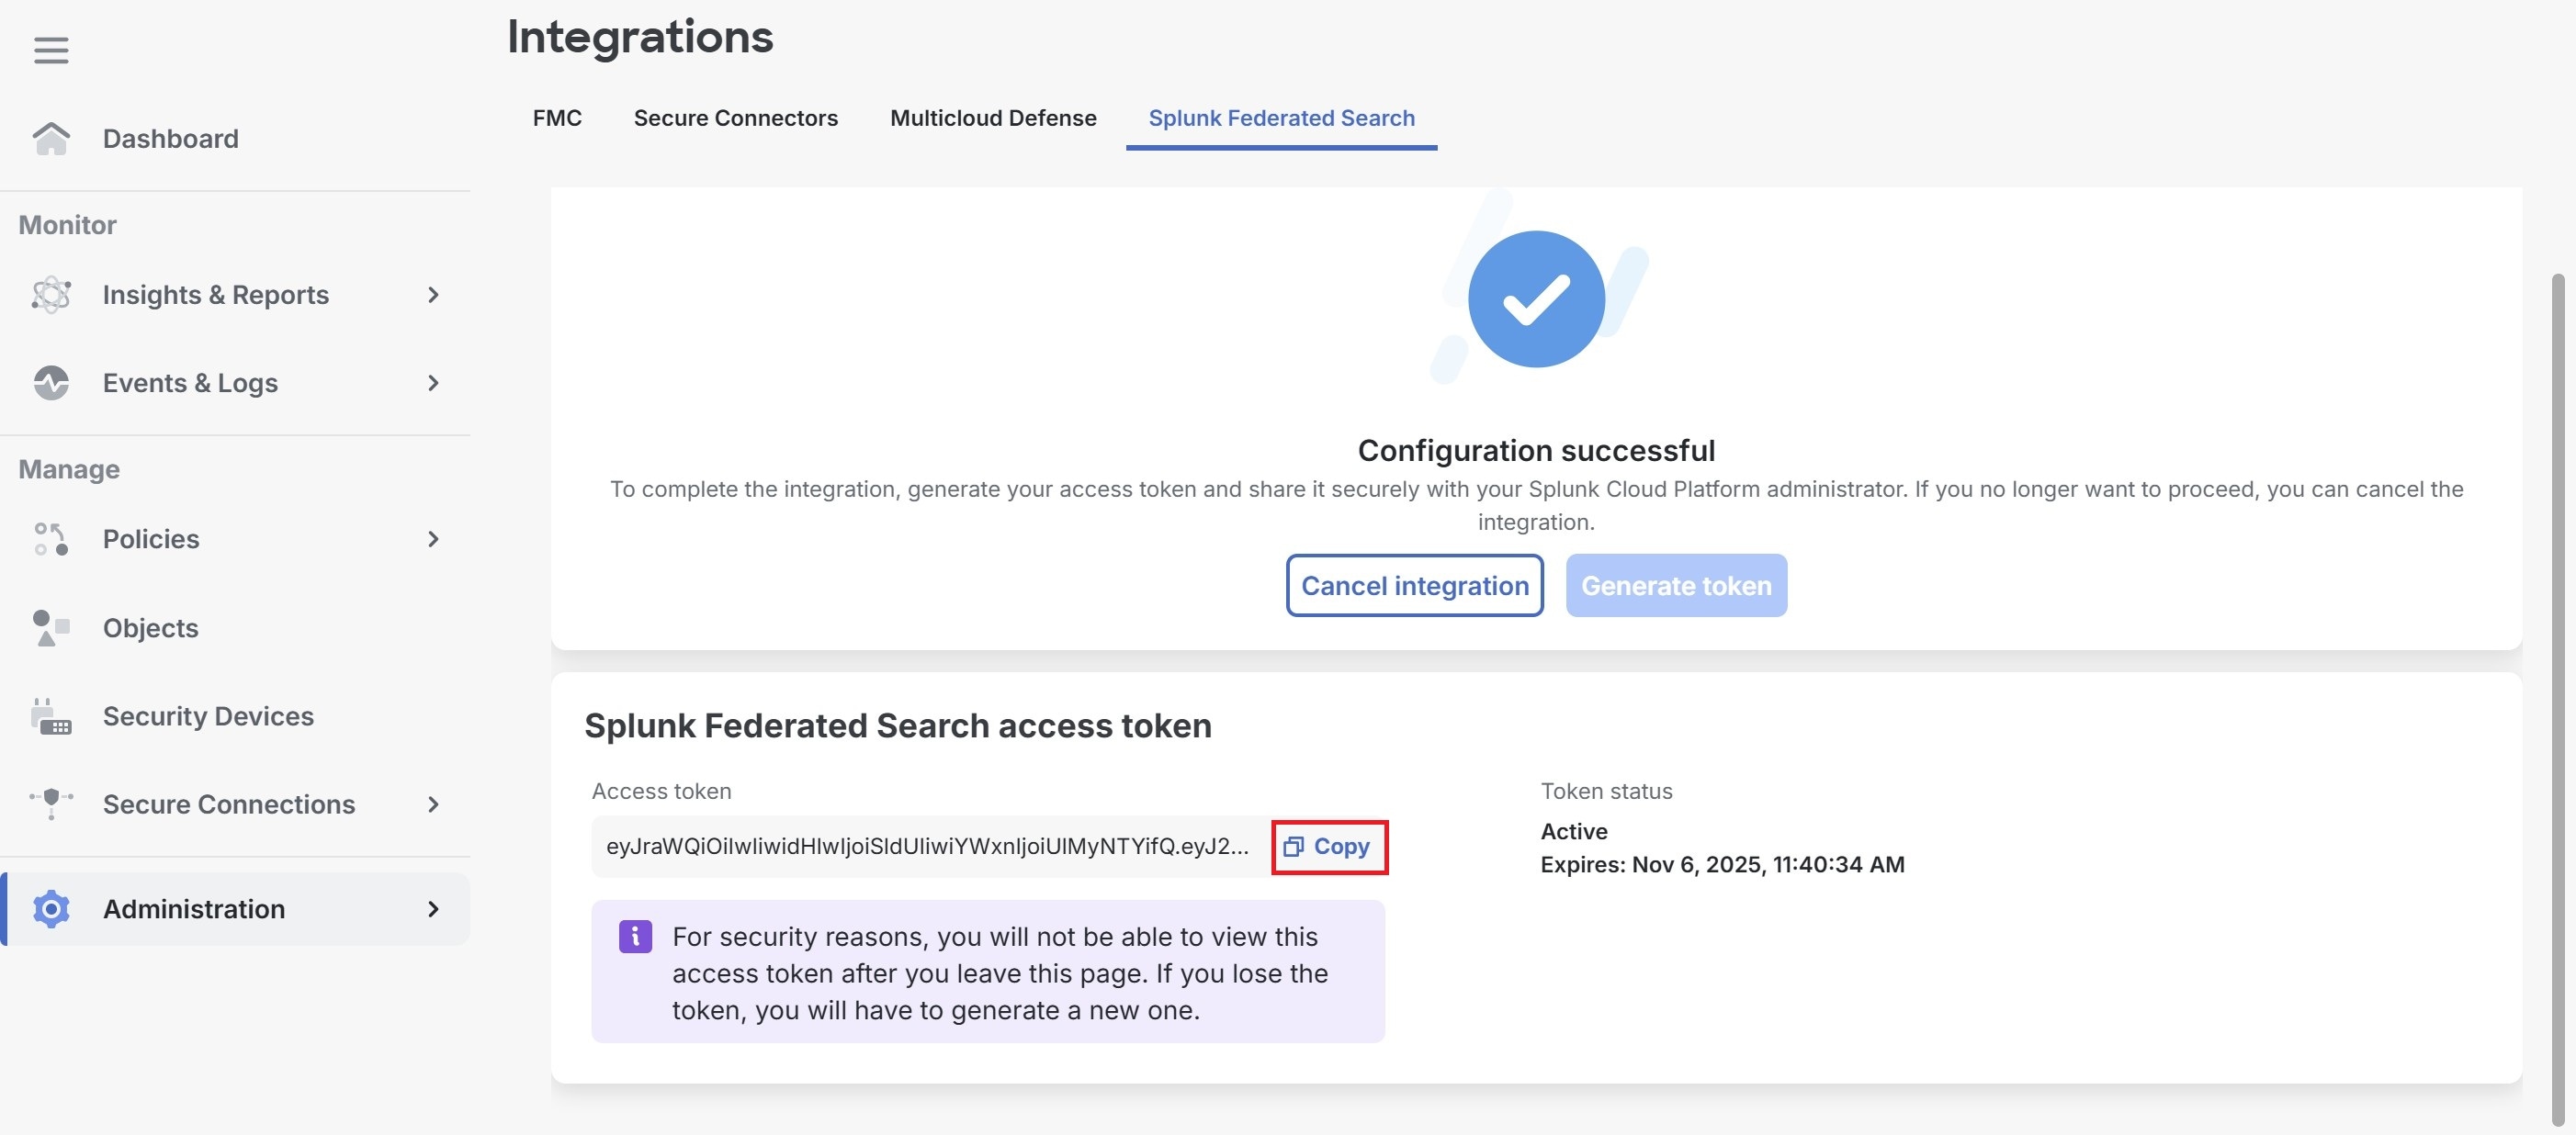
  5. From the Splunk Federated Search access token section, copy the access token and share it with the Splunk administrator.

    Splunk Federated Search access token screen

    This access token is valid for 7 days (168 hours) from the time it is generated. The Splunk administrator must create the dataset before the access token expires.

    Note

    If you leave this page without copying the displayed access token, the access token is lost and you must regenerate a new access token by clicking Regenerate token.

You have successfully generated an access token that enables Splunk administrator access to Cisco Security Analytics and Logging data through the Splunk Cloud Platform integration.

What to do next

Follow the steps in Splunk Federated Search for Cisco Analytics and Logging (SAL) - Splunk Side to:

  1. Define a Cisco Security Analytics and Logging dataset.

  2. Set up a Cisco Security Analytics and Logging dataset.

  3. Give your users role-based access control of Cisco Security Analytics and Logging datasets.


Verify Connection Status of Splunk Federated Search with Cisco Security Analytics and Logging

This task helps you check whether the integration between Splunk Federated Search and Cisco Security Analytics and Logging is functioning properly and monitor any connection issues.

Use this procedure to verify the connection status of Splunk Federated Search with Cisco Security Analytics and Logging.

Procedure

  1. From the Security Cloud Control Home page, click Firewall.

  2. In the top-right corner, click the Notifications (Notifications bell icon) icon to view the status of your connection.
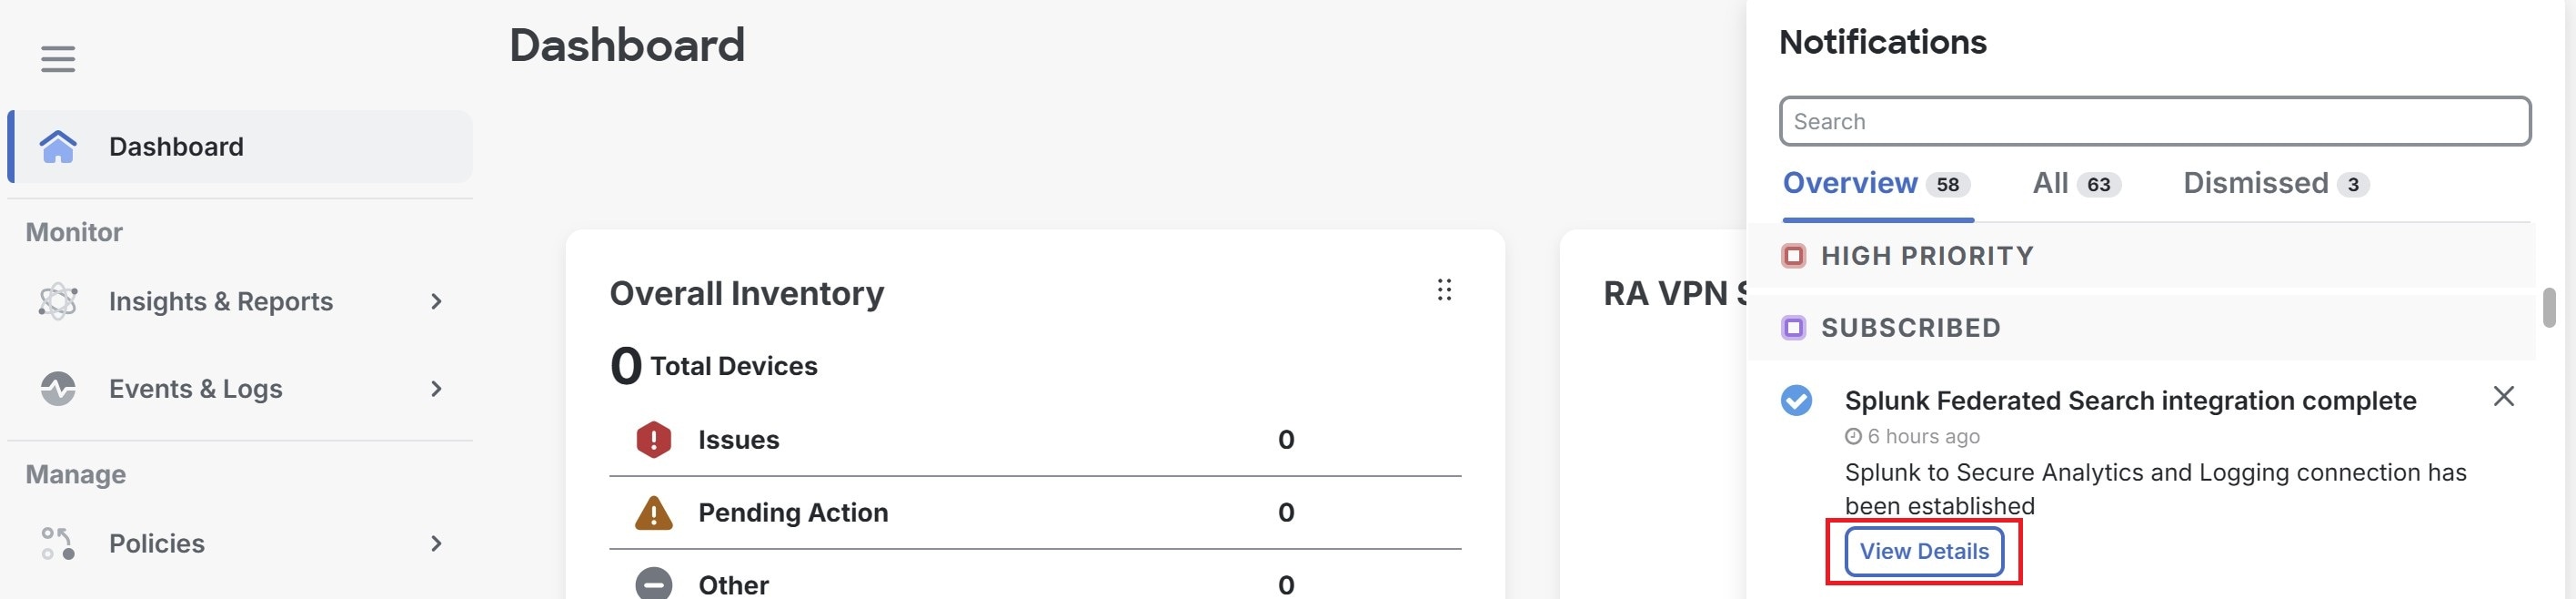
  3. Click View details to monitor the connection status on the Splunk Federated Search tab under Integrations.

    Screenshot of the notifications drawer

You can view the current connection status and monitor any integration issues between Splunk Federated Search and Cisco Security Analytics and Logging.


Monitor and Troubleshoot Connection Status of Splunk Federated Search with Cisco Security Analytics and Logging

This task enables you to monitor the integration status and troubleshoot connectivity issues between Splunk Federated Search and Cisco Security Analytics and Logging.

After the integration is complete, use this procedure to monitor and troubleshoot the connection status of Splunk Federated Search with Cisco Security Analytics and Logging.

Procedure

  1. From the Security Cloud Control Home page, click Firewall.

  2. Choose Administration > Integrations > Splunk > Splunk Federated Search.

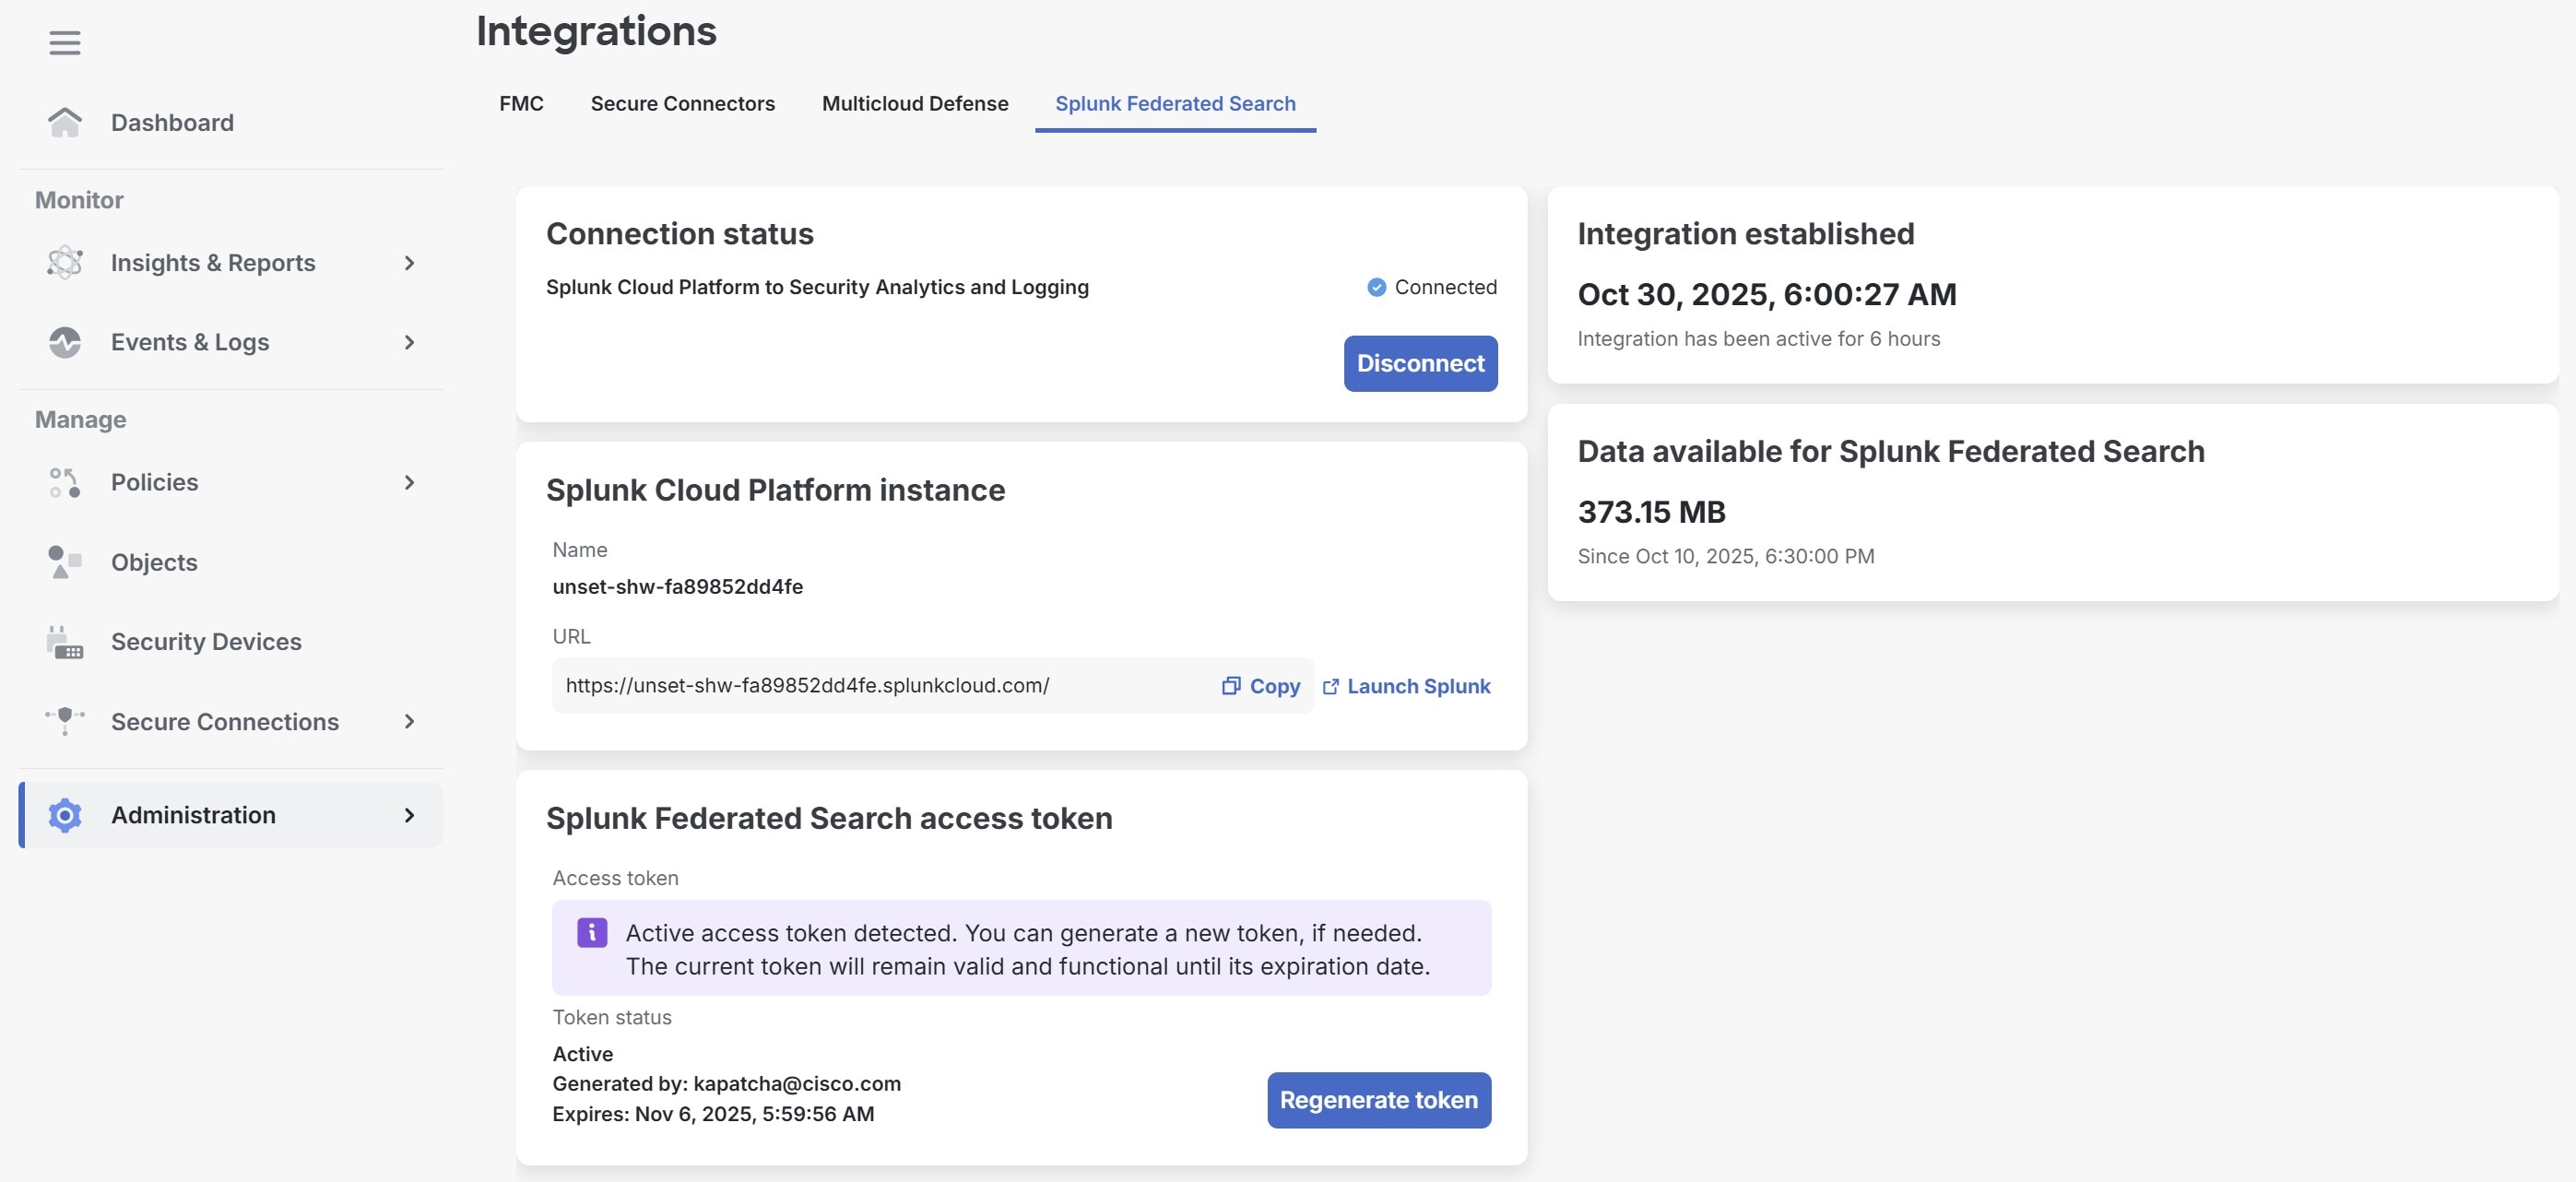
    The table shows the sections displayed under the Splunk Federated Search tab after the integration is complete.

    Screenshot of the Splunk Federated Search integrations page

    Section

    Description

    Connection Status

    Splunk to Security Analytics and Logging: Indicates the current state of connectivity between Splunk Cloud Platform and Cisco Security Analytics and Logging.

    Integration established

    The date and time at which the integration was completed, displayed in local time.

    Splunk Cloud Platform instance

    Name: Name of the Splunk Cloud instance.

    URL: URL of the Splunk Cloud instance for federated search for Cisco Security Analytics and Logging.

    Data available for Splunk Federated Search

    Amount of data, typically measured in gigabytes (GB) or terabytes (TB), which can be queried with Splunk Federated Search.

    Splunk Federated Search access token

    • Access token: If the access token is active, no access token is displayed here. Click Regenerate token if you still want to generate a new token.

      If you generate a new token, the current token will remain valid and functional until its expiration date.

    • Token status: Status of the access token. It can be either Active or Expired.

    • Generated by: Email address of the user who generated the access token.

    • Expires: Date and time when the access token expires.

    Troubleshooting

    • What should I do if the connection status shows disconnected?

      If the connection status shows Disconnected, go back to the Integrations page to restart integration.

    • What should I do if the Splunk instance URL does not launch?

      If the Splunk instance URL does not launch, contact your Splunk administrator or Splunk Support.

    • The data available for Splunk Federated Search is zero. What should I do?

      If the data volume shows zero, it means no data is currently available for federated search. In such cases, you should verify whether the firewall events are flowing into the Events and Logs page in the Security Cloud Control platform. For existing customers, federated search up to 30 days of historical events. The actual period depends on the retention and onboarding configuration.

You can view the connection status, integration details, and troubleshoot any issues with the Splunk Federated Search integration.

What to do next:

Search Cisco Security Analytics and Logging event logs. For more information, see Search your Cisco Firewall datasets.


Disconnect the integration of Splunk Federated Search with Cisco Security Analytics and Logging when you no longer need federated search capabilities.

You can disconnect the integration of Splunk Federated Search with Cisco Security Analytics and Logging in Security Cloud Control at any time. After you disconnect, Splunk Cloud Platform will no longer have access to the Cisco Security Analytics and Logging data, and Splunk Cloud Platform users will not be able to perform a federated search.

Procedure

  1. From the Security Cloud Control Home page, click Firewall.

  2. Choose Administration > Integrations > Splunk Federated Search.

  3. In the Splunk Federated Search tab, click Disconnect under Connection status.

    Note

    If Cisco Security Analytics and Logging is disconnected from Splunk Federated Search, no data will be deleted or lost; only the access is revoked. You can reconnect at any time.

The Splunk Federated Search integration is successfully disconnected. Splunk Cloud Platform no longer has access to Cisco Security Analytics and Logging data, and federated search is disabled.