Cisco Crosswork Network Controller 7.2 Administration Guide

PDF

Cisco Crosswork Network Controller 7.2 Administration Guide

Dashboard customization tasks

Want to summarize with AI?

Log in

Provides links to tasks for creating, customizing, filtering, and deleting dashboards and dashlets in Crosswork Network Controller. Use it to select the right dashboard workflow before you start.


Refer to this topic to choose the dashboard customization task that matches the action you need to perform.

Dashboard task list

Dashboards in Crosswork Network Controller provide a centralized, customizable view of key metrics through interactive dashlets.

Use these topics to create, customize, and manage dashboards:


Create a dashboard

You can create multiple dashboards. Each dashboard is represented as a separate tab. Crosswork Network Controller includes a default dashboard tab named General, which you cannot rename, delete, or filter.

Follow these steps to create a custom dashboard and add relevant dashlets:

Before you begin

Ensure that you have configured the policies that you want to monitor. For information on the policies, refer to the Monitor device and inventory health chapter in Cisco Crosswork Network Controller 7.2 Device Lifecycle Management.

Procedure

1.

From the Crosswork Network Controller main menu, choose Dashboard.

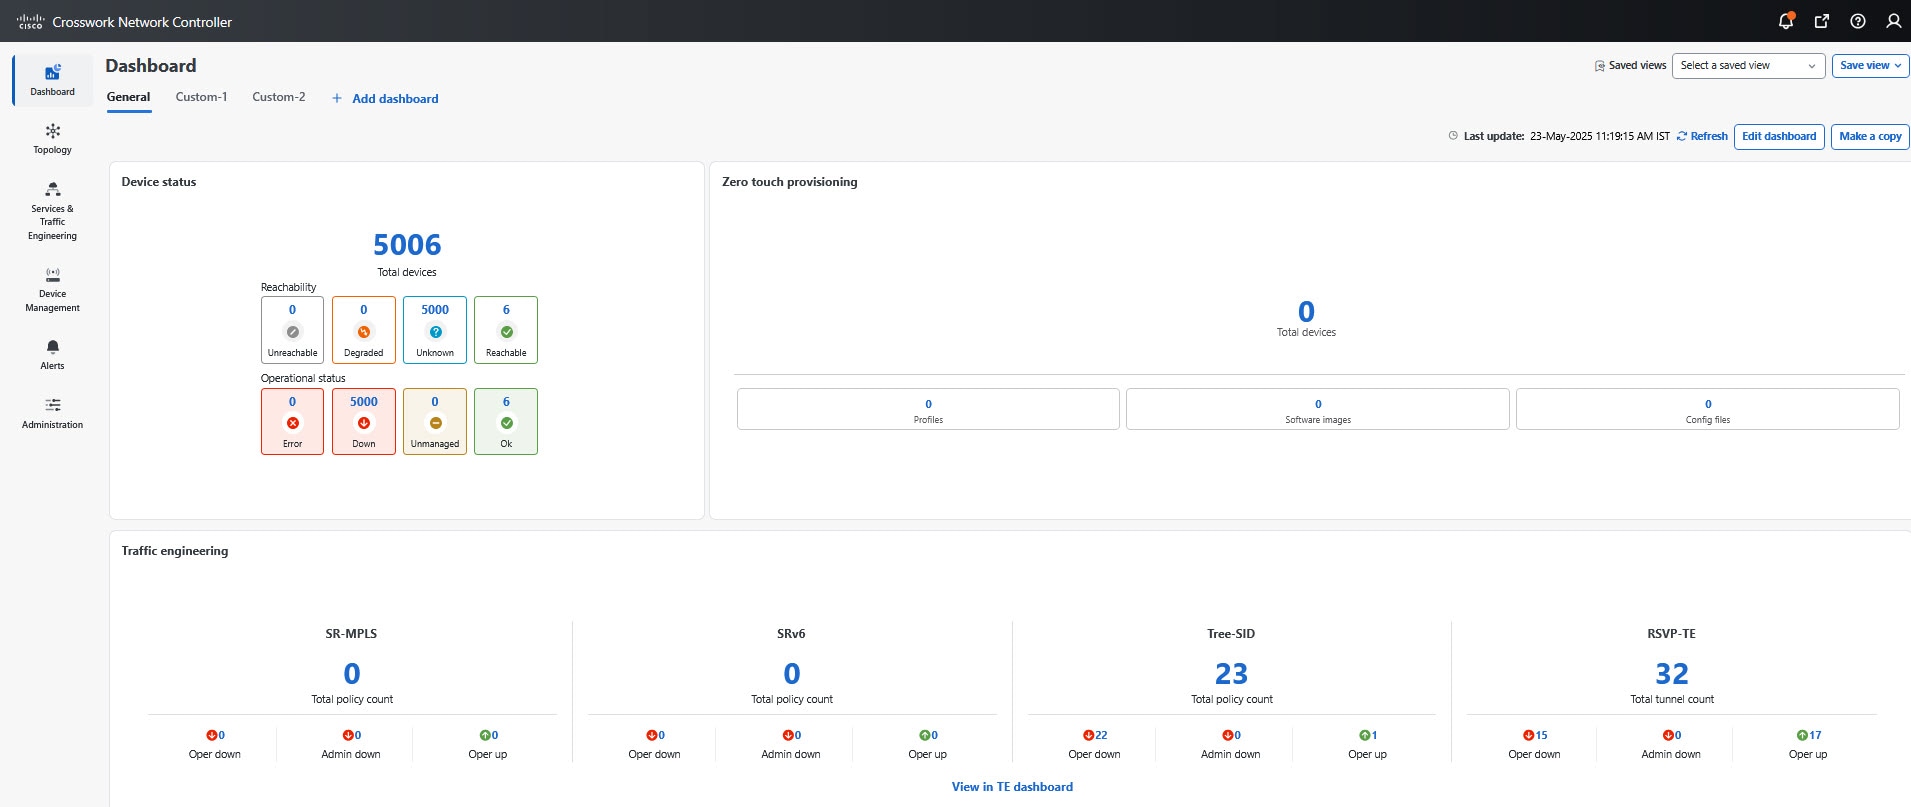
The Dashboard page opens with the default General tab.

Figure 1. Dashboard - General tab
2.

Click + Add Dashboard to create a new dashboard tab.

3.

Click the edit icon next to the default title, and enter a meaningful name for the dashboard.

4.

Add dashlets.

  1. Click +Add dashlet.

  2. In the Add Dashlets drawer, select the policy and the corresponding metrics you want to monitor.

    Note

    If you choose to add the Top 5 metrics in the Interface health dashlets, you must create an Interface health monitoring policy by using either device groups or port groups. You can create one or multiple of these groups. If you configure the Interface health policy using individual devices, rather than device or port groups, the data will not appear in the Dashboards. However, the data will still be accessible on the Device Management > Top Metrics UI page.

  3. Click +Add.

    The selected dashlets are added to the dashboard.

  4. Enter a unique, meaningful title for each dashlet.

  5. Click the ellipsis icon on a dashlet to configure the chart type, copy the dashlet, or delete the dashlet.

    • Configure the chart type as Bar, Donut, or Pie.

    • Copy or delete the dashlet.

5.

Click Save.

The selected dashlets appear on the dashboard.

What to do next

To view relevant data on the dashlets, apply the appropriate device or port group filters. Then, select the time range for which you want to view the data, such as 6 hours, 1 day, or 1 month.


Edit a dashboard

You can modify a custom dashboard by renaming it, adding or removing dashlets, changing chart types, and editing the dashlet metrics.

Follow these steps to modify a dashboard and the relevant dashlets:

Before you begin

  • Identify the custom dashboard that you want to modify. You cannot rename, edit, or delete the default General dashboard.

  • Review the existing dashlets to determine which elements, such as titles, metrics, or chart types, you want to update.

Procedure

1.

From the Crosswork Network Controller main menu, choose Dashboard.

The Dashboard page opens with the configured dashboards as individual tabs.

2.

Select the dashboard tab that you want to edit.

3.

Click Edit dashboard.

4.

Modify the required parameters.

  • Dashboard title: Click the edit icon next to the dashboard title and enter a meaningful name.

  • Dashlet title: Click the title field within a dashlet and enter a descriptive name.

  • Chart type: Click the ellipsis icon on a dashlet, select Change chart type, and choose Bar, Donut, or Pie.

  • Copy dashlet: Click the ellipsis icon and select Copy. A copy of the dashlet is added after the last dashlet on the dashboard. Update its title or settings as required to distinguish it from the original dashlet.

  • Delete dashlet: Click the ellipsis icon and select Delete. The dashlet is removed when you save the dashboard changes.

  • Modify metrics: For a dashlet that supports configurable metric ranges, click Edit metrics to modify or reset the range.

    Note

    This option is available only for certain dashlets, such as Link metrics.

5.

Click Save.

The dashboard displays the updated title, dashlets, chart types, and metric settings.

Manage the dashboard views

A saved view captures the supported dashboard settings so that you can return to the same monitoring context without reapplying them. You can share saved views with others or revisit them for common monitoring setups.

Follow these steps to manage dashboard views:

Before you begin

If you want to rename or manage the existing views, verify that a view has been previously saved.

Procedure

1.

From the Crosswork Network Controller main menu, choose Dashboard.

The Dashboard page opens with the configured dashboards displayed as individual tabs.

2.

Select the dashboard tab for which you want to manage views.

3.

In the dashboard toolbar, click the views drop-down and perform any of these actions:

  1. Select Save view as, enter a unique name, and save the current supported dashboard settings as a new view.

  2. Select Rename view, choose the saved view, and enter a new name.

  3. Select Manage views to review and delete saved views. You can sort the views by Recently added, Most viewed, or Recently visited.

    • Sort views by Recently added, Most viewed, or Recently visited.

    • Delete any view that is no longer needed.


Filter data in a dashboard

You can filter dashboard data by device group or port group. Dashboard filters apply only to dashlets that support the selected filter and scope. When you select a group, compatible dashlets refresh using that selection. A dashlet that does not support the selected filter or has no eligible monitored data does not display data.

Note
  • You can filter data only in the custom dashboard. You cannot filter data in the General dashboard.

  • You can apply either a device-group filter or a port-group filter. Applying one replaces the other. For example, if you filter data using a device group, the dashboard displays results for that group. Later, if you filter by port group, it overrides the previous filter and displays data based only on the selected port group.

Follow these steps to filter data in a dashboard:

Procedure

1.

From the Crosswork Network Controller main menu, choose Dashboard.

The Dashboard page opens with the configured dashboards as individual tabs.

2.

Select the dashboard tab where you want to apply filters.

3.

In the dashboard view, use one of the relevant filter options:

  • Device group: Click the Device group drop-down and select the desired group.

  • Port group: Click the Port group drop-down and select the relevant port group.

Note

A Top Groups dashlet compares multiple eligible groups. If you filter the dashboard to a specific device group or subgroup, the dashlet is not applicable and does not display ranking data. This behavior does not indicate that monitoring data is unavailable for devices in the selected group. Other compatible dashlets can continue to display data for the selected group.

4.

To sort data by time range, click the range drop-down and select a duration. For example, 6 hours, 1 day, 1 week, or 1 month.

Compatible dashlets refresh to display data for the selected group and time range. If a dashlet does not display data, refer to Troubleshoot missing dashboard data.


Investigate dashboard data

Use dashboard data to identify when a performance condition occurred and which devices or interfaces contributed to it.

Histogram and Summary dashlets provide aggregated monitoring data. The Trend view shows how the data changed over time, and Top Metrics provides information about the monitored devices or interfaces.

Before you begin

Ensure that the applicable monitoring policies are configured and that the dashboard contains the dashlets that you want to investigate.

Procedure

1.

From the Crosswork Network Controller main menu, choose Dashboard.

The Dashboard page opens with the configured dashboards displayed as individual tabs.

2.

Select the dashboard tab that contains the data that you want to investigate.

3.

Apply an appropriate device group or port group filter, if required.

Dashboard filters apply only to dashlets that support the selected filter and scope.

Note
A Top Groups dashlet compares multiple eligible groups. If you filter the dashboard to a specific device group or subgroup, the dashlet is not applicable and does not display ranking data.
4.

From the range drop-down list, select the time range that you want to investigate.

5.

In a Histogram or Summary dashlet, click Trend.

  • For a Histogram dashlet, the Trend view shows how the number of elements in each health-severity category changed over time.

  • For a Summary dashlet, the Trend view shows how the minimum, maximum, and average metric values changed over time.

6.

Click Top metrics in the dashlet.

The Top Metrics page opens and displays the monitored devices or interfaces for the selected metric.

7.

Use the available metric, group, and Top N controls to refine the displayed results.

8.

Select a device or interface to view its metric history.

You can review when the performance condition occurred and identify the devices or interfaces that might require further investigation.


Remove a dashlet

You can remove dashlets from a dashboard and add them again at any time.

Follow these steps to delete a dashlet from the custom dashboard:

Before you begin

Review the contents to confirm that no critical dashlets are in use.

Procedure

1.

From the Crosswork Network Controller main menu, choose Dashboard.

The Dashboard page opens with the configured dashboards as individual tabs.

2.

Select the dashboard tab from which you want to delete the dashlet.

3.

Click Edit dashboard.

4.

In the dashlet that you want to delete, click the ellipsis icon and select Delete.

The dashlet is removed from the dashboard.

5.

When the confirmation message appears for the last dashlet, review the details carefully, then click Delete to permanently remove the dashlet.


Delete a dashboard

Follow these steps to delete a custom dashboard and the relevant dashlets:

Before you begin

  • Document any important configurations or metrics before deleting.

  • Review the dashboard contents to confirm that no critical dashlets or data views are in use.

  • You cannot delete or modify the General dashboard. It contains system-generated dashlets related to the configured policies.

Procedure

1.

From the Crosswork Network Controller main menu, choose Dashboard.

The Dashboard page opens with the configured dashboards as individual tabs.

2.

Select the dashboard tab that you want to delete.

3.

Click Edit dashboard.

4.

Click Delete dashboard.

When the confirmation message appears, review the details carefully. Click Delete to permanently remove the dashboard.


Troubleshoot missing dashboard data

Use this procedure when a dashlet displays no data or does not show recently collected data.

The data displayed in a dashlet depends on the applicable monitoring policy, the selected dashboard filter, the dashlet type, and the availability of data for the selected time range.

Before you begin

Identify the dashboard, dashlet, metric, filter, and time range for which data is missing.

Procedure

1.

Verify that the monitoring policy for the metric is enabled.

2.

Verify that the monitoring policy includes the device groups or port groups that you want to monitor.

Note
To display Top 5 Interface Health metrics in a dashboard, configure the applicable Interface Health monitoring policy using device groups or port groups. A policy configured only with individual devices does not provide data to these dashlets.
3.

Verify that the selected device group or port group contains devices or interfaces covered by the monitoring policy.

4.

Verify that the dashlet supports the selected filter and scope.

Note
A Top Groups dashlet compares multiple eligible groups. If you filter the dashboard to a specific device group or subgroup, the dashlet is not applicable and does not display ranking data. Remove the specific group filter to compare multiple eligible groups.
5.

Select a time range that contains collected monitoring data.

6.

If the group was recently created, wait for dashboard data to become available.

Dashboard data for a device group or port group becomes available after the group is created. Historical dashboard data from before the group was created is not available.

7.

Allow additional time for recently collected data to appear in Histogram and Summary dashlets.

These dashlets use aggregated performance data and might not include metrics collected during the current aggregation interval.

8.

Open Device Management > Top Metrics and verify that data is available for the metric.

If data is available on the Top Metrics page, review the dashboard filter and dashlet applicability. If data is not available, review the monitoring policy and the monitored device or interface.

The checks identify whether the missing data is caused by monitoring-policy coverage, filter or dashlet applicability, the selected time range, or data availability.