Monitor Device and Inventory Health

This section contains the following topics:

Monitoring policies

A monitoring policy is a configuration framework that

  • defines which network and device attributes are continuously observed,

  • defines the rate at which parameters are polled and the method for polling these parameters,

  • sets thresholds and alarm criteria to identify and report health issues without altering device configurations.

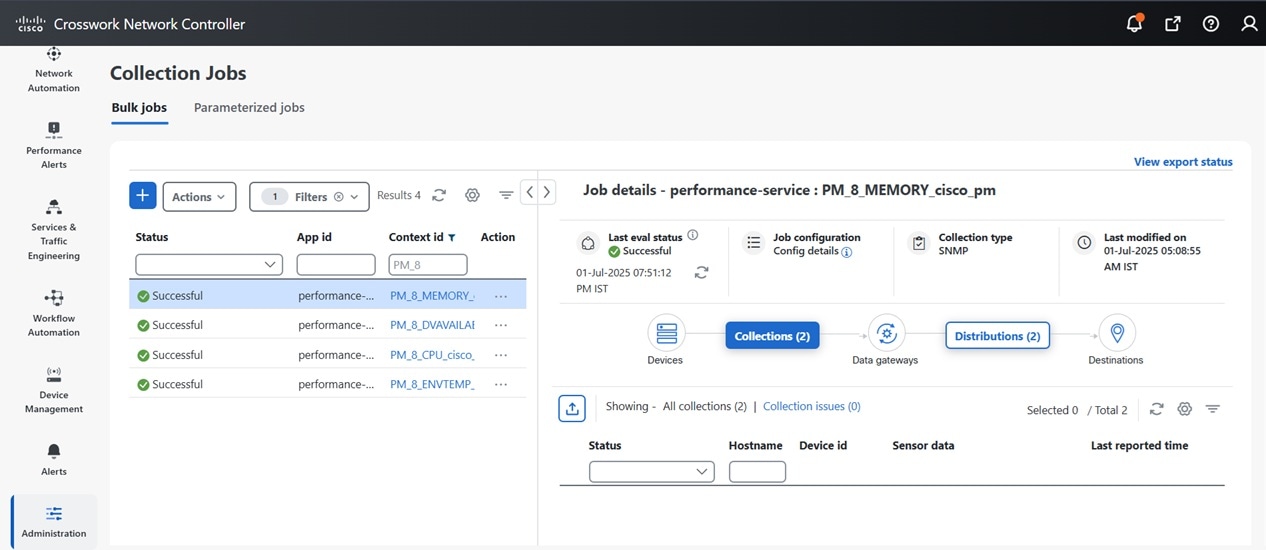
You can view and manage policies under Device management > Performance policies in Crosswork Network Contoller. Use this page to activate, deactivate, edit, or delete default and user-created monitoring policies.

Key tasks for managing monitoring policies

  • Selecting a policy type: Select the appropriate policy type based on specific monitoring requirements and identify the devices to be monitored.

  • Configuring polling frequencies: Specify the interval that the parameters are polled.

    Set the Threshold Crossing Alarm (TCA): Define TCAs that trigger when monitored values exceed assigned limits.

  • Configuring Top N metrics: Classify critical health parameters, set data retention periods, and configure metric visualizations within the Top N dashboard.

  • Customizing the dashboard: Modify the metrics dashboard to track and display important health and performance metrics.

Parameters monitored by each policy

There are specific parameters monitored by each policy type. Each policy targets specific aspects of device health and functionality, providing focused monitoring solutions.

The table lists the different parameters a policy monitors for a particular policy type.

Policy type

Parameters the policy monitors
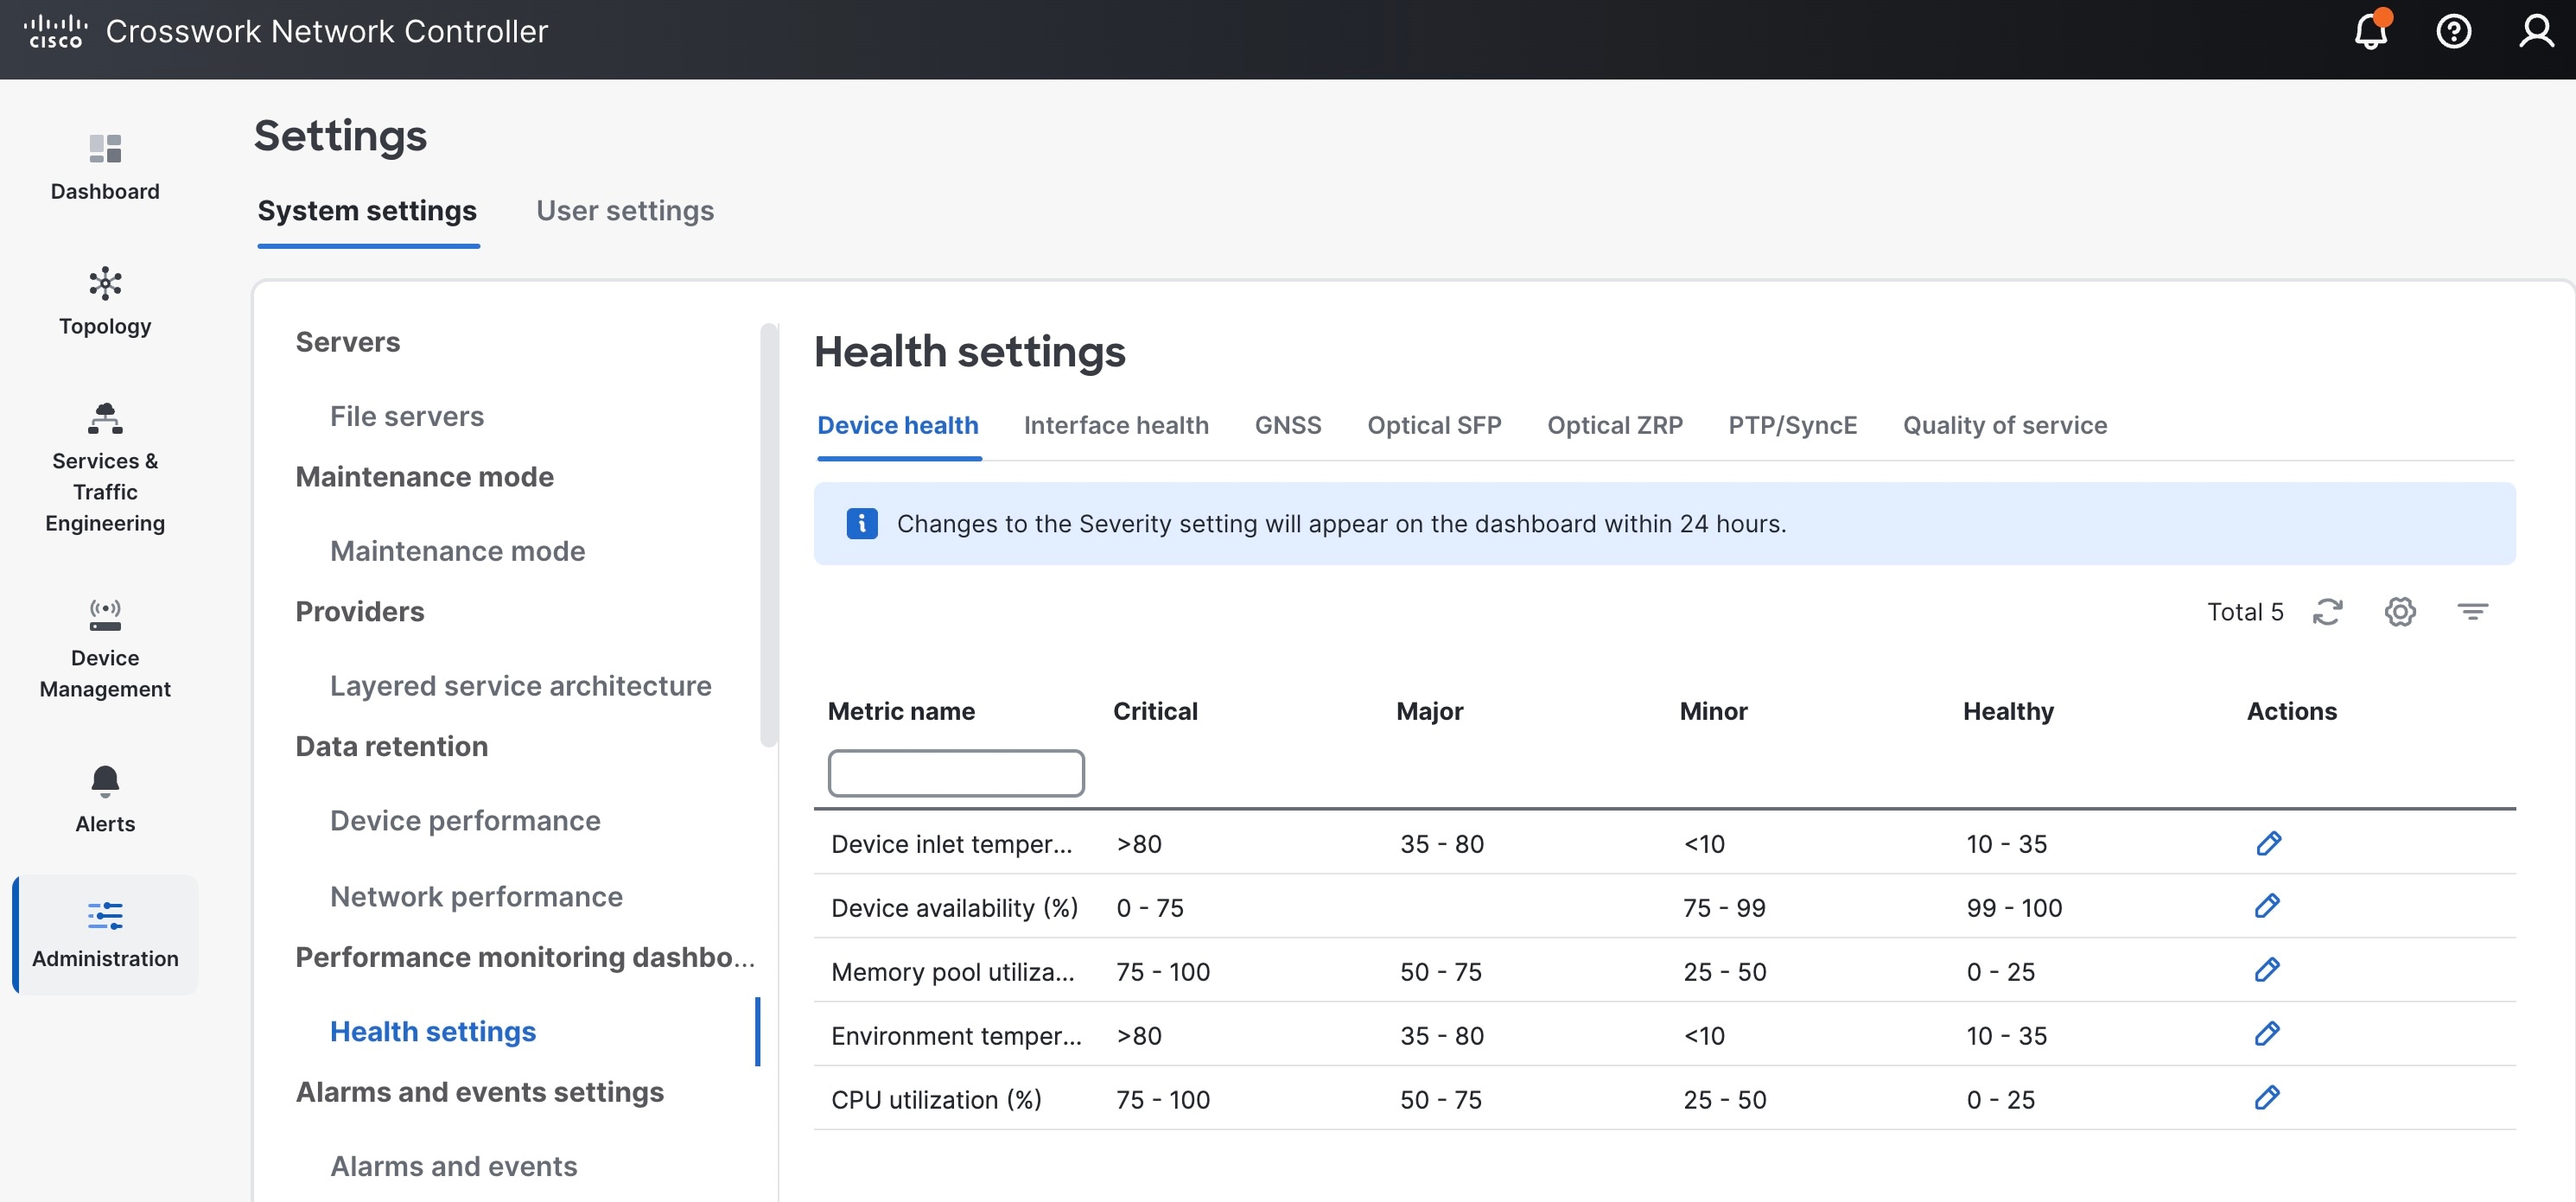
Device health

Monitors Cisco devices and third-party devices. For Cisco devices, the policy checks managed devices for CPU utilization, memory pool utilization, environment temperature, and device availability. For third party devices, the policy checks devices for device availability only. This policy also specifies thresholds for utilization and temperature which, if surpassed, trigger alarms that are displayed in the UI.

Parameters:

Memory pool utilization, CPU utilization, environmental temperature, device availability

Note


The device health monitoring policy excludes Cisco NCS 2000 and Cisco ONS devices. Optical monitoring policies should be used for these device types.

GNSS

Monitors the performance and reliability of (Global Navigation Satellite System )GNSS receivers within a network. It polls status and signal quality of satellites.

Parameters:

Antenna open alarm, antenna short alarm, module lock, module presence, satellite lock count, module slot info, module slot state, module visibility status

Interface health

Monitors attributes to assess interface operational status and performance in a network.

Parameters:

Statistics and CRC

LSP traffic

Tacks traffic routed through an MPLS (Multiprotocol Label Switching) network and ensures that data packets are being efficiently routed.

Parameters:

Outgoing traffic rate and outgoing packets rate

Optical SFP

Polls health and performance information for optical SFP (Small Form-Factor Pluggable) interfaces. It is available for all Cisco pluggable devices supporting DOM (Cisco Digital Optical Monitoring).

Parameters:

Received optical power, temperature, transmitted bias current, current, transmitted optical power, voltage

Optical ZRP

Polls health and performance information for ZR optical transceivers within a network.

Parameters:

  • Optics lane- Maximum, minimum, and average transmit and receive power levels.

  • OTU controllers- Error corrected bits, Post-Fec-Ber, Pre-Fec-Ber, Q-factor, Q -margin, uncorrectable words

PTP/ SyncE

Monitors the Precision Time Protocol (PTP) and Synchronous Ethernet (SyncE) within a network. The PTP/ SyncE policy monitors clock synchronization of primary clocks on devices and the quality of clock signals.

Parameters:

  • PTP- Clock class, clock state and clock UTC offset

  • Input quality level

Quality of service

Monitors quality of service (QoS) on Cisco and third-party devices by collecting and analyzing traffic statistics per class-map.

Parameters:

Transmitted packets, transmitted bytes, dropped packets, dropped bytes, drop percent, drop packets percent, drop packets rate, queue discard bytes rate, queue discard packets rate, conformed packets rate, conformed bytes rate, exceeded packets rate, exceeded bytes rate, violated packets rate, and violated bytes rate.

For QoS policies, TCAs can additionally be set for individual Class of Service (CoS) values. QoS-specific alarms and TCAs are not shown on Topology maps.

SRv6 traffic accounting

Collects and monitors data from Cisco IOS XR devices with gNMI protocol supported.

Parameters:

Interface name, IPV6 prefix, IPv6 prefix length, transmitted traffic rate, and sample's interval in milliseconds.

For a list of pre-defined Key Performance Indicators (KPIs) available for monitoring network and device performance, see Pre-defined KPIs for performance metrics.

Default policy management considerations

The following points summarize key facts about default policy management in Crosswork Network Controller.
  • Enabled by default: LSP traffic and Interface health policies are enabled by default in Crosswork Network Controller from version 7.1 onwards.

  • Viewing default policies: View and review default policies on the Performance policies page.

  • Upgrade considerations: During the upgrade from Crosswork Network Controller version 7.0 to version 7.1 or 7.2, if no LSP traffic or interface health policies were configured, these policies are created by default.

  • Customizing default policies: Default policies can be customized. Customization may impact Crosswork Optimization Engine (COE) operations if COE is installed.

  • Deactivation or deletion impact: Deactivating or deleting default policies may impact COE functionalities. It may also affect visualizations and data displays within the topology user interface. Carefully evaluate the impact before making changes.

gNMI based polling

SNMP is the default protocol used for data polling in Crosswork Network Controller. You can aslo enable gNMI based polling for interface health and LSP traffic policies. To enable gNMI polling, the device must have the pm-openconfig tag assigned, and gNMI capability must be configured. Once you enable gNMI, the tagging and configuration changes take effect in the next polling cycle.

If a device is tagged with pm-openconfig but lacks gNMI capability, polling will switch to SNMP to ensure data collection.

Configure gNMI based polling for interface health and LSP traffic policies

Enable and configure gNMI-based data collection for monitoring interface health and LSP traffic policies in Crosswork Network Controller.

Use this task to switch from default SNMP to gNMI polling for specific devices and monitoring policies. This allows for telemetry collection when your devices support gNMI. The polling protocol selection depends on both tagging the device and configuring its gNMI capability.

Follow these steps to enable gNMI-based polling for interface health and LSP traffic policies:

Before you begin

Verify that your devices support and can be configured for gNMI.

Procedure

Step 1

Create the pm-openconfig tag from the Tag Management page in the Crosswork Network Controller user interface.

Step 2

Assign the pm-openconfig tag to each device you want to monitor using gNMI. You can assign or remove this tag at any time, and the tag can belong to any category.

Step 3

Configure gNMI capability on the required devices.

Refer to the Cisco Crosswork Network Controller 7.2 Administration Guide for details on configuring gNMI and assigning tags.

Note


Before customizing any default policies, review the section Default policy management considerations.


Create monitoring policies

Create and activate policies to monitor device performance and receive alerts based on defined thresholds.

Use monitoring policies to automate device performance tracking across device groups or interfaces, helping identify issues and trigger alarms.

Before you begin

Identify device groups, port groups, or individual devices to target with the policy.

Procedure


Step 1

Choose Device Management > Performance Policies.

Step 2

Click Create new policy.

Step 3

Configure policy parameters:

  1. Select policy type: Choose a policy type from the Select policy type drop-down list.

  2. Enter policy details: Provide the policy name and other relevant details.

  3. Select devices: Choose devices or device groups to apply the policy. For specific policies like interface health, QoS, optical SFP, or optical ZRP, you can also select port groups for monitoring.

Step 4

Fine-tune the monitoring:

  1. Set polling frequency: Choose how often devices should be polled from the available options. Some policy types allow different polling intervals for various parameters while others require a single frequency.

  2. Configure alarm thresholds: If supported by the policy, configure alarm threshold and enter the threshold values for events that should trigger an alert. Add multiple thresholds as needed.

Step 5

Activate and manage:

  1. Activate monitoring: Click Activate to apply the policy. The policy appears under Performance Policies > View details.

  2. Manage policies: Click View details, then select Actions to deactivate, edit, or delete a policy.

    You can edit policies during maintenance mode. Changes may only take effect after maintenance ends and the updated configuration is deployed.


Automated device performance checks begin according to the policy parameters, and alerts are generated if defined thresholds are crossed.

View collection jobs for a performance policy

Monitor and access the status and details of collection jobs associated with specific performance policies in your network environment.

Collection jobs are generated by active performance policies. Viewing these jobs helps verify data collection progress

Procedure


Step 1

Choose Device Management > Performance Policies.

Step 2

Switch to the list view.

Step 3

Identify the ID of the performance policy you want to monitor.

For example, if the policy ID is 6, all related collection jobs will have the prefix PM_6.

Step 4

Choose Administration > Collection Jobs.

All collection jobs with the app id performance-service are related to performance monitoring.

Step 5

Use the Context ID filter to locate jobs related to the specified performance policy. For example PM_6, PM_2.

This filter applies to both bulk and parameterized jobs.

Step 6

Select the Context ID link for the chosen performance policy to access detailed job information.

Figure 1. Collection jobs for monitoring policies

The job details page displays information about the selected collection job, allowing you to verify its status, parameters, and results.

Performance metrics for network analysis

A performance metric is a network analysis measurement that

  • quantifies the behavior and efficiency of network components,quantifies the behavior and efficiency of network components,

  • provides actionable data to monitor, evaluate, and troubleshoot network health, and

  • enables trend analysis, capacity planning, and identification of anomalies in network performance.

Crosswork Network Controller collects performance metrics from user-defined monitoring policies and processes these data points over one-hour periods, producing histograms and summary reports that represent network activity for specified intervals.

Within the UI, you can access these metrics across all History tabs, providing insights into network performance. In the histogram graphs, the time shown represents the start of the one-hour period. For instance, a report marked 8:00 displays metrics for the interval between 8:00 and 9:00.

Performance metrics may be categorized at different investigation levels:

  • Network aggregation: Analyzes data across the entire network to identify overall patterns and trends.

  • Trend analysis: Examines historical data to detect changes and trends over time.

  • Top element identification: Identifies the highest-performing or most critical elements within the network.

  • Individual element trend viewing: Focuses on specific elements to track their performance trends and changes.

Customizing Top N metrics within your dashboard allows you to prioritize key metrics. Refer to the following sections to define Top N metrics for your network:

Customize metric health settings

Define metric health categories and customize severity thresholds to tailor health reports to your network’s needs.

Metric health thresholds determine how network health is assessed by identifying metrics as healthy, minor, major, or critical. You can customize thresholds for each metric, by policy, before setting up metric visualization. Default categories are provided, but it is recommended to review and set thresholds to match your operational requirements.

Before you begin

  • Identify the policies for which you need to adjust metric health thresholds.

  • Review the default thresholds and categories in use.

Procedure


Step 1

Choose Administration > Settings > Performance monitoring dashboard > Health settings.

Figure 2. Health settings

Step 2

Select a policy tab to view associated metrics.

Step 3

For each metric you want to customize:

  1. Click the Edit icon under the Actions column.

  2. Set threshold values for each severity level: healthy, minor, major, and critical.

  3. Save your changes.

    You can select the reset option for all metrics under the policy tab to reset thresholds.


New threshold settings apply to all future metric health reports and dashboards. Past reports retain the previous threshold values for their respective periods.

Set data retention periods for monitored metrics

Configure retention settings to manage how long monitored metrics data is stored.

Setting appropriate data retention periods for device performance metrics helps balance storage constraints with monitoring needs, allowing you to retain relevant data.

Procedure


Step 1

Choose Administration > Settings > Data retention > Device performance.

Step 2

Use the policy type dropdown menu to filter a policy type.

Step 3

For a selected policy, choose the performance metrics you wish to edit and click the Edit icon.

Default retention values are displayed for each metric type. Specify retention periods for each category: raw data, hourly data, daily data, and weekly data.


Your selected metrics now retain performance data according to the specified periods.

Customize and view top metrics

Monitor critical network device performance and status by setting up and viewing the Top Metrics dashboard.

Use this task when you need granular visibility into device health, traffic, or status by customizing which metrics and filters are displayed in your dashboard.

Procedure


Step 1

From the main menu, go to Device Management > Top Metrics.

Step 2

Select metrics and filters:

  1. In the Select Metrics dropdown, choose a category such as Device health, GNSS, Interface health, Optical SFP, Optical ZRP, PTP/SyncE or Quality of Service (QoS).

    Available categories depend on your configured monitoring policies.

  2. Set filters for importance, and device groups and port groups as needed.

  3. Filter by device groups or port groups or by choosing metrics ranging from the top 10 to top 500.

  4. Under the Actions tab, click the three dots for a device and select View trends .


The Top Metrics dashboard displays only the metrics, devices, and timeframes you selected.

External data streams

An external data stream is a data export mechanism that

  • transmits real-time device performance metrics from Crosswork Network Controller to external destinations,

  • supports flexible filtering by policy name, type, or schema, and

  • uses standardized protobuf messages to ensure consistent data integration.

Usage scenrios

Supported protocols are Kafka topics and gRPC endpoints.

  • Typical external destinations include analytics platforms, monitoring dashboards, and third-party applications.

  • You can configure subscriptions with filters to select specific performance metrics or policy data for export.

  • Multiple destinations are supported for simultaneous data streaming.

Prerequisites for external streaming

To configure external streaming, these prerequisites must be completed.

  1. Monitoring policies: At least one monitoring policy must be created and active for the relevant devices

  2. Device discovery: Target devices must be discovered and managed within Crosswork Network Controller.

  3. External destination configuration: Kafka or gRPC destination must be set up and reachable. Refer Add or edit a data destination for details.

  4. API access: User must have API access privileges to create, modify, or delete subscriptions.

  5. Subscription data: When creating a subscription, the subscriptionData field is mandatory and must not be left empty.

Required fields and endpoint for subscription API

API endpoint

POST https://{{cw-server}}:30603/crosswork/notification/v2/subscription

Required fields

  • destinationName: Name assigned to the external endpoint.

  • destinationType: Type of destination. Allowed values are Kafka or gRPC.

  • subscriptionData: Filter definition, such as policy_type, policy_instance. This field cannot be blank.

  • subscriptionDataType: Must be set to Device_Performance_Monitoring.

  • topicName: The Kafka topic or gRPC stream to which data will be sent.

json:Y
{
  "destinationName": "external-secure-grpc",
  "destinationType": "gRPC",
  "filter": null,
  "subscriptionData": "policy_type=INTERFACE",
  "subscriptionDataType": "Device_Performance_Monitoring",
  "topicName": "pmdata-test-grpc"
}
  

Note


  • You can combine multiple filters in the subscriptionData field to refine the streaming data.

  • The subscription will only stream data for policies and schemas that match the filter criteria you specify.


Subscription data options

The subscriptionData field specifies which performance data will be streamed to subscribers in monitoring and analytics systems. You can define filtering criteria to selectively stream the data needed for specific use cases.

Available options

These options are supported in the subscriptionData field:

  • policy_type: Streams data by predefined policy type or schema name.

  • policy_instance: Streams data for a specific policy instance or user-defined policy name.

You may combine multiple options in a comma-separated list.

Use case Filter option Example value
By policy type policy_type policy_type=INTERFACE

Streams interface-related policy data

By policy instance policy_instance policy_instance=SRPOLICY_1

Streams data for policy instance “SRPOLICY_1”

By schema policy_type (with schema name) policy_type=DVAVAILABILITY

Streams device availability schema-related data

Combination (type + health) policy_instance,policy_type policy_instance=int_health,policy_type=CPU

Streams health instance and CPU policy-type data

Types and values for monitoring policies

Supported policy types and schemas

Policy type Schema Description
Device health CPU Provides device CPU usage and performance information.

ENVTEMP

Environmental temperature monitoring data.

MEMORY

Memory monitoring data
DVAVAILABILITY Device availability monitoring data
Interface health CEPMINTERFACE Interface monitoring
CEPMCRC Interface CRC
GNSS CEPMGNSS Global Navigation Satellite System monitoring
Optical ZRP OTUCONTROLLERSINFO OTU controller information for optical transport networks.
OPTICSLANE Contains optical lane statistics and performance data.
Optical SFP OPTICALSFP Monitoring of SFP optical modules
PTP/ SyncE CEPMPTP Precision Time Protocol monitoring
CEPMSYNCE

Represents Synchronous Ethernet (SyncE) metrics

Quality of service CEPMQOS Quality of Service monitoring
SR policy SRPOLICY LSP monitoring
SRv6 traffic accounting SRV6LOCATOR Segment routing v6 locator monitoring
CUSTOM - User-defined

To stream monitoring data for a custom feature:

  • Set policy_type to CUSTOM.

  • Specify the schema using policy_type=<schema_name>

Example: To collect OpticalSFP metrics, set policy_type=OPTICALSFP.

Subscription payload and protobuf examples for monitoring data streams

The examples show the structure of subscription payloads for Kafka destinations under different policy scenarios. Use these examples to guide the creation of payloads for device performance monitoring.

Sample payloads

  • Example 1: By Policy type

    {
      "destinationName": "external-kafka",
      "destinationType": "Kafka",
      "subscriptionData": "policy_type=CPU",
      "subscriptionDataType": "Device_Performance_Monitoring",
      "topicName": "pmdata-cpu"
    }
    
  • Example 2: By multiple filters

    {
      "destinationName": "external-kafka",
      "destinationType": "Kafka",
      "subscriptionData": "policy_instance=int_health,policy_type=INTERFACE",
      "subscriptionDataType": "Device_Performance_Monitoring",
      "topicName": "pmdata-int-health"
    }
    
  • Example 3: Custom policy
    {
      "destinationName": "external-kafka",
      "destinationType": "Kafka",
      "subscriptionData": "policy_type=CUSTOM",
      "subscriptionDataType": "Device_Performance_Monitoring",
      "topicName": "pmdata-custom"
    }
    

Protobuf messages

Performance monitoring data is streamed as Protobuf objects. This sample shows a Protobuf definition for the generic performance message structure.

syntax = "proto3";

package com.cisco.ems.performance.proto;

import "Custom.proto";
import "CEPMCRC.proto";
import "CEPMINTERFACE.proto";
import "DVAVAILABILITY.proto";
import "CPU.proto";
import "ENVTEMP.proto";
import "MEMORY.proto";
import "OpticalSFP.proto";
import "OPTICSLANE.proto";
import "OTUCONTROLLERSINFO.proto";
import "CEPMPOWER.proto";
import "SRPOLICY.proto";
import "CEPMQOS.proto";
import "CEPMPTP.proto";
import "CEPMSYNCE.proto";
import "CEPMGNSS.proto";
import "SRV6LOCATOR.proto";


message PerformanceMonitoringMessage{

  string deviceuuid = 1;
  string devicename = 18;

  oneof pm_data {
  
    //Out of the box policies
    CEPMCRCRecords cepmcrc = 2;
    CEPMINTERFACERecords cepminterface = 3;
    DVAVAILABILITYRecords dvavailability = 4;
    CPURecords cpu = 5;
    ENVTEMPRecords envtemp = 6;
    MEMORYRecords memory = 7;
    OpticalSFPRecords opticalsfp = 8;
    OPTICSLANERecords opticslane = 9;
    OTUCONTROLLERSINFORecords otucontrollersinfo = 10;
    CEPMPOWERRecords cepmpower = 11;
    SRPOLICYRecords srpolicy = 12;
    CEPMQOSRecords cepmqos = 13;
    CEPMPTPRecords cepmptp = 15;
    CEPMSYNCERecords cepmsynce = 16;
    CEPMGNSSRecords cepmgnss = 17;
    SRV6LOCATORRecords srv6locator = 19;

    //Custom policy 
    CustomRecords custom = 14;
  }
}

Protobuf definitions for other data types

Proto definitions for data types can be included as needed.

Protobuf message definitions for Performance CPU


syntax = "proto3";

package com.cisco.ems.performance.proto;


message CPURecords{

  repeated Record records = 1;
  message Record {
  
  	uint64 eventtime = 1;

	/* 
	CPU index
	*/
	optional int32 cpuIndex = 2;

	/* 
	CPU name
	*/
	optional string cpuName = 3;

	/* 
	CPU utilization.
	unit: PERCENTAGE
	min: 0
	max: 100
	*/
	optional int32 cpuUtilization = 4;
  };
}

Protobuf message definitions for Performance CEPMCRC


syntax = "proto3";

package com.cisco.ems.performance.proto;


message CEPMCRCRecords{

  repeated Record records = 1;
  message Record {
  
  	uint64 eventtime = 1;

	/* 
	Interface name
	*/
	optional string interfaceName = 2;

	/* 
	the sample's interval in milli seconds.
	*/
	optional int32 crcDuration = 3;

	/* 
	CRC errors.
	unit: PERCENTAGE
	min: 0
	max: 100
	*/
	optional float crcPercentage = 4;

	/* 
	CRC errors rate.
	unit: PACKETS_PER_SECOND
	min: 0
	*/
	optional float crc = 5;
  };
}

Protobuf message definitions for Performance SRV6LOCATOR

syntax = "proto3";

package com.cisco.ems.performance.proto;


message SRV6LOCATORRecords{

  repeated Record records = 1;
  message Record {
  
  	uint64 eventtime = 1;

	/* 
	Locator ipv6-prefix
	*/
	optional string ipv6Prefix = 2;

	/* 
	Locator ipv6-prefix length
	*/
	optional int32 ipv6PrefixLength = 3;

	/* 
	the sample's interval in milliseconds
	*/
	optional int32 sampleDuration = 4;

	repeated AccountingInfo accounting = 5;       

	message AccountingInfo {             
		string interfaceName = 1; 
		float outBitRate = 2; 
	} 

  };
}

Protobuf message definitions for Performance SRPOLICY

syntax = "proto3";

package com.cisco.ems.performance.proto;


message SRPOLICYRecords{

  repeated Record records = 1;
  optional string vendor = 2;	
  
  message Record {
  
  	uint64 eventtime = 1;

	/* 
	Name
	*/
	optional string name = 2;

	/* 
	Color
	*/
	optional int32 color = 3;

	/* 
	Endpoint
	*/
	optional string endpoint = 4;

	/* 
	State
	*/
	optional int32 state = 5;

	/* 
	Path name
	*/
	optional string pathName = 6;

	/* 
	the sample's interval in milli seconds.
	*/
	optional int32 duration = 7;

	/* 
	Transmitted packets rate.
	unit: PACKETS_PER_SECOND
	min: 0
	*/
	optional float outPktsRate = 9;

	/* 
	Transmitted traffic rate.
	unit: BITS_PER_SECOND
	min: 0
	*/
	optional float outBitRate = 10;

	/* 
	Transmitted octet raw value.
	*/
	optional int64 outOctetsRaw = 11;

	/* 
	Transmitted packet raw value. 
	*/
	optional int64 outPacketsRaw = 12;
  };
}

Protobuf message definitions for Performance OTUCONTROLLERSINFO

syntax = "proto3";

package com.cisco.ems.performance.proto;


message OTUCONTROLLERSINFORecords{

  repeated Record records = 1;
  message Record {
  
  	uint64 eventtime = 1;

	/* 
	Controller name
	*/
	optional string controllerName = 2;

	/* 
	Bit error rate before forward error correction.
	unit: BITS_PER_SECOND
	min: 0
	*/
	optional float preFecBer = 3;

	/* 
	Bit error rate after forward error correction.
	unit: BITS_PER_SECOND
	min: 0
	*/
	optional float postFecBer = 4;

	/* 
	Q-margin calculated in dBQ.
	unit: DBQ
	min: 0
	*/
	optional float qmargin = 5;

	/* 
	Q-factor calculated in dB
	unit: DB
	min: 0
	*/
	optional float qfactor = 6;

	/* 
	Average bit errors corrected.
	unit: BITS_PER_SECOND
	min: 0
	*/
	optional int64 ec = 7;

	/* 
	Uncorrected word count.
	unit: NUMBER
	min: 0
	*/
	optional int64 uc = 8;

	/* 
	the sample's interval in milli seconds.
	*/
	optional int32 duration = 9;
  };
}

Protobuf message definitions for Performance OPTICSLANE

syntax = "proto3";

package com.cisco.ems.performance.proto;


message OPTICSLANERecords{

  repeated Record records = 1;
  message Record {
  
  	uint64 eventtime = 1;

	/* 
	Interface name
	*/
	optional string ifName = 2;

	/* 
	Lane index
	*/
	optional int32 laneIndex = 3;

	/* 
	Average receive power in dBm.
	unit: DBM
	min: -40
	*/
	optional float receivePower = 4;

	/* 
	Minimum receive power in dBm.
	unit: DBM
	min: -40
	*/
	optional float minReceivePower = 5;

	/* 
	Maximum receive power in dBm.
	unit: DBM
	min: -40
	*/
	optional float maxReceivePower = 6;

	/* 
	Average transmit power in dBm.
	unit: DBM
	min: -40
	*/
	optional float transmitPower = 7;

	/* 
	Minimum transmit power in dBm.
	unit: DBM
	min: -40
	*/
	optional float minTransmitPower = 8;

	/* 
	Maximum transmit power in dBm.
	unit: DBM
	min: -40
	*/
	optional float maxTransmitPower = 9;
  };
}

Protobuf message definitions for Performance OpticalSFP

syntax = "proto3";

package com.cisco.ems.performance.proto;


message OpticalSFPRecords{

  repeated Record records = 1;
  message Record {
  
  	uint64 eventtime = 1;

	/* 
	The interface's ifIndex.
	*/
	optional int32 interfaceIndex = 2;

	/* 
	Interface name
	*/
	optional string interfaceName = 3;

	/* 
	Lane id
	*/
	optional int32 laneId = 4;

	/* 
	Temperature in celsius.
	unit: CELSIUS
	*/
	optional float temperature = 5;

	/* 
	Voltage in volts
	unit: VOLT
	min: 0
	*/
	optional float voltage = 6;

	/* 
	Transmitted bias current.
	unit: MILLIAMP
	min: 0
	*/
	optional float txBias = 7;

	/* 
	Transmitted optical power in dBm.
	unit: DBM
	min: -40
	*/
	optional float txPower = 8;

	/* 
	Received optical power in dBm.
	unit: DBM
	min: -40
	*/
	optional float rxPower = 9;
  };
}

Protobuf message definitions for Performance MEMORY

syntax = "proto3";

package com.cisco.ems.performance.proto;


message MEMORYRecords{

  repeated Record records = 1;
  message Record {
  
  	uint64 eventtime = 1;

	/* 
	Memory pool name
	*/
	optional string memoryPoolName = 2;

	/* 
	Represents the different types of memory pools that may be present in a managed device.
	Memory pools can be roughly categorized into two groups, predefined pools and dynamic pools.
	The following pool types are currently predefined:
	1: processor memory
	2: i/o memory
	3: pci memory
	4: fast memory
	5: multibus memory Dynamic pools will have a pool type value greater than any of the predefined types listed above.
	Note that only the processor pool is required to be supported by all device.
	Support for other pool types is dependent on the device being managed.
	*/
	optional int32 memoryPoolType = 3;

	/* 
	Memory pool utilization.
	unit: PERCENTAGE
	min: 0
	max: 100
	*/
	optional int32 memoryUtilization = 4;

	/* 
	Indicates the number of bytes from the memory pool that are currently in use by applications on the managed device.
	*/
	optional int64 memoryPoolUsed = 5;

	/* 
	Indicates the number of bytes from the memory pool that are currently unused on the managed device. 
	*/
	optional int64 memoryPoolFree = 6;
  };
}

Protobuf message definitions for Performance ENVTEMP

syntax = "proto3";

package com.cisco.ems.performance.proto;


message ENVTEMPRecords{

  repeated Record records = 1;
  message Record {
  
  	uint64 eventtime = 1;

	/* 
	Sensor name.
	*/
	optional string sensorName = 2;

	/* 
	indicates if a sensor is Inlet, based on entPhysicalName or entPhysicalDescr.
	0 indicates that it is a regular sensor , 1 indicates that it is an inlet sensor.
	*/
	optional int32 isInlet = 3;

	/* 
	Current temperature in celsius. Multiplied by 100.
	unit: CELSIUS
	*/
	optional int32 envTemperature = 4;
  };
}

Protobuf message definitions for Performance DVAVAILABILITY

syntax = "proto3";

package com.cisco.ems.performance.proto;


message DVAVAILABILITYRecords{

  repeated Record records = 1;
  message Record {
  
  	uint64 eventtime = 1;

	/* 
	Device availability.
	unit: PERCENTAGE
	min: 0
	max: 100
	*/
	optional float deviceAvailability = 2;

	/* 
	Last reboot time in epoch time.
	*/
	optional int64 lastRebootTime = 3;

	/* 
	the sample's interval in milli seconds.
	unit: NUMBER
	*/
	optional int64 deviceAvailabilityDuration = 4;
  };
}

Protobuf message definitions for Performance CEPMSYNCE

syntax = "proto3";

package com.cisco.ems.performance.proto;


message CEPMSYNCERecords{

  repeated Record records = 1;
  message Record {
  
  	uint64 eventtime = 1;

	/* 
	Index
	*/
	optional int32 syncEIndex = 2;

	/* 
	Indicates the current clock quality level of the input clock source.  This is the
	effective quality which is derived from three values:
	    1) most recent clock quality level received,
	    2) forced clock quality level (entered via configuration)
	    3) overridden clock quality level as a result of line protocol down, signal failure, or alarms.
	unit: NUMBER
	min: 1
	max: 36
	*/
	optional int32 syncEqualityLevelInput = 3;

	/* 
	Indicated the priority of an input clock source configured for the T0 clock selection.
	A smaller value represents a higher priority.
	unit: NUMBER
	*/
	optional int32 syncEPriority = 4;
  };
}

Protobuf message definitions for Performance CEPMQOS

syntax = "proto3";

package com.cisco.ems.performance.proto;


message CEPMQOSRecords{

  repeated Record records = 1;
  message Record {
  
  	uint64 eventtime = 1;

	/* 
	Interface name
	*/
	optional string interfaceName = 2;

	/* 
	Holds the name of the policy map.
	*/
	optional string policyMapName = 3;

	/* 
	hold the name of the class map. The pattern is the following:  PolicyMapName:ClassMapName. for example 'Scale:dscp14
	*/
	optional string classifierName = 4;

	/* 
	Direction of the policy map. Input - 1 , Output -2.
	*/
	optional int32 direction = 5;

	/* 
	a match line in a class map that matches a packet's Class of Service (CoS) value.
	The IEEE 802.1Q/ISL CoS value can be a value from 0 to 7. And you can specify from 1 to 4 values on a single line.
	*/
	optional string matchCos = 6;

	/* 
	Pre-policy packets rate
	unit: PACKETS_PER_SECOND
	min: 0
	*/
	optional float prePolicyPktsRate = 7;

	/* 
	Pre-policy traffic rate
	unit: BITS_PER_SECOND
	min: 0
	*/
	optional float prePolicyBitsRate = 8;

	/* 
	Post-policy traffic rate
	unit: BITS_PER_SECOND
	min: 0
	*/
	optional float postPolicyBitsRate = 9;

	/* 
	Dropped packets rate
	unit: PACKETS_PER_SECOND
	min: 0
	*/
	optional float dropPktsRate = 10;

	/* 
	Dropped packets percent
	unit: PERCENTAGE
	min: 0
	max: 100
	*/
	optional float dropPktsPercent = 11;

	/* 
	Dropped traffic rate
	unit: BITS_PER_SECOND
	min: 0
	*/
	optional float dropBitsRate = 12;

	/* 
	Dropped traffic percent
	unit: PERCENTAGE
	min: 0
	max: 100
	*/
	optional float dropBitsPercent = 13;

	/* 
	Queue dropped packets rate
	unit: PACKETS_PER_SECOND
	min: 0
	*/
	optional float queueDiscardPktsRate = 14;

	/* 
	Queue dropped traffic rate
	unit: BITS_PER_SECOND
	min: 0
	*/
	optional float queueDiscardBitsRate = 15;

	/* 
	Conformed packets rate
	unit: PACKETS_PER_SECOND
	min: 0
	*/
	optional float conformPktsRate = 16;

	/* 
	Conformed traffic rate
	unit: BITS_PER_SECOND
	min: 0
	*/
	optional float conformBitsRate = 17;

	/* 
	Exceeded packets rate
	unit: PACKETS_PER_SECOND
	min: 0
	*/
	optional float exceedPktsRate = 18;

	/* 
	Exceeded traffic rate
	unit: BITS_PER_SECOND
	min: 0
	*/
	optional float exceedBitsRate = 19;

	/* 
	Violated packets rate
	unit: PACKETS_PER_SECOND
	min: 0
	*/
	optional float violatePktsRate = 20;

	/* 
	Violated traffic rate
	unit: BITS_PER_SECOND
	min: 0
	*/
	optional float violateBitsRate = 21;

	/* 
	the sample's interval in milli seconds.
	*/
	optional int32 sampleDuration = 22;
  };
}

Protobuf message definitions for Performance CEPMPTP

syntax = "proto3";

package com.cisco.ems.performance.proto;


message CEPMPTPRecords{

  repeated Record records = 1;
  message Record {
  
  	uint64 eventtime = 1;

	/* 
	Specifies the domain number used to create logical group of PTP devices
	*/
	optional int32 ptpClockDomainIndex = 2;

	/* 
	Clock type: ordinaryClock(1), boundaryClock(2),transparentClock(3),boundaryNode(4)
	*/
	optional int32 ptpClockTypeIndex = 3;

	/* 
	Specifies the instance of the clock for this clock type in the given domain
	*/
	optional int32 ptpClockInstanceIndex = 4;

	/* 
	Specifies the PTP Portnumber for this port.
	*/
	optional int32 ptpClockPortNumberIndex = 5;

	/* 
	Specifies the PTP clock port name configured on the router
	*/
	optional string ptpClockPortName = 6;

	/* 
	Describes the current role (client/server) of the port
	*/
	optional int32 ptpClockPortRole = 7;

	/* 
	Specifies the parent dataset grandmaster clock quality class.
	unit: NUMBER
	min: 0
	max: 255
	*/
	optional int32 ptpClockClass = 8;

	/* 
	Specifies the Clock state returned by PTP engine which was described earlier.
	 Freerun state: Applies to a client device that is not locked to  a server. This is the initial state a client starts out with
	          when it is not getting any PTP packets from the server or because of some other input error (erroneous packets, etc).
	 Holdover state: In this state the client device is locked to a server but communication with the server is lost or the
	          timestamps in the ptp packets are incorrect. But since the client was locked to the server, it can run with the same
	          accuracy for sometime. The client can continue to operate in this state for some time.
	          If communication with the server is not restored for a while, the device is moved to the FREERUN state.
	 Acquiring state: The client device is receiving packets from a server and is trying to acquire a lock.
	 Freq_locked state: client device is locked to the server with respect to frequency, but not phase aligned
	 Phase_aligned state: Locked to the server with respect to frequency and phase.
	unit: NUMBER
	min: 1
	max: 5
	*/
	optional int32 ptpClockState = 9;

	/* 
	Specifies -
	For a server port - the number of PTP client sessions (peers) associated with this PTP port.
	For a client port - the number of servers available to this client port (might or might not be peered).
	*/
	optional int32 ptpClockAssociatedPorts = 10;

	/* 
	Specifies the timeproperties dataset value of current UTC offset.
	In PTP systems whose epoch is the PTP epoch, the value of timePropertiesDS.currentUtcOffset is the offset
	between TAI and UTC;otherwise the value has no meaning. The value shall be in units of seconds.
	The initialization value shall be selected as follows:
	a) If the timePropertiesDS.ptpTimescale is TRUE,  the value is the value obtained from a
	    primary reference if the value is known at the time of initialization, else.
	b) The value shall be the current number of leap seconds when the node is designed.
	unit: NUMBER
	min: 0
	max: 65535
	*/
	optional int32 ptpClockUTCOffset = 11;
  };
}

Protobuf message definitions for Performance CEPMPOWER

syntax = "proto3";

package com.cisco.ems.performance.proto;

enum EntityType {
  DEVICE = 0;
  PSU = 1;
}
enum PowerState {
  UNKNOWN = 0;
  OK = 1;
  FAILED = 2;
  NOT_PRESENT = 3;
}

message CEPMPOWERRecords{

  repeated Record records = 1;
  message Record {
  
  	uint64 eventtime = 1;

	/* 
	Indicate if this record represent PSU (1) or device(0).
	*/
	optional EntityType entityType = 2;

	/* 
	If this record is for PSU then this field displays the PSU's name/location.
	Otherwise the field is empty.
	*/
	optional string name = 3;

	/* 
	If this record is for PSU then this field displays the PSU's state.
	Otherwise the field is set to PowerState.UNKNOWN
	*/
	optional PowerState state = 4;

	/* 
	Power input in watts
	unit: WATTS
	*/
	optional float inputPower = 5;

	/* 
	Power supply capacity in watts
	unit: WATTS
	*/
	optional float capacity = 6;

	/* 
	Power supply output in watts
	unit: WATTS
	*/
	optional float outputPower = 7;

	/* 
	Power supply load in percentage - power/capacity
	unit: PERCENTAGE
	min: 0
	max: 100
	*/
	optional float load = 8;

	/* 
	Power supply efficiency in percentage - output/input
	unit: PERCENTAGE
	*/
	optional float efficiency = 9;

	/* 
	Temperature in Celsius.
	Currently not in used.
	unit: CELSIUS
	*/
	optional float temperature = 10;
  };
}

Protobuf message definitions for Performance CEPMINTERFACE

syntax = "proto3";

package com.cisco.ems.performance.proto;


message CEPMINTERFACERecords{

  repeated Record records = 1;
  message Record {
  
  	uint64 eventtime = 1;

	/* 
	Interface name
	*/
	optional string interfaceName = 2;

	/* 
	The interface's ifIndex.
	*/
	optional int32 ifIndex = 3;

	/* 
	Interface speed
	unit: BITS_PER_SECOND
	*/
	optional int64 ifSpeed = 4;

	/* 
	the sample's interval in milli seconds.
	*/
	optional int32 interfaceDuration = 5;

	/* 
	Value is 1 if admin is down else 0. This value should be multiplied by 100 for display
	unit: PERCENTAGE
	*/
	optional int32 ifAdminDown = 6;

	/* 
	Value is 1 if admin up but oper is down else 0. This value should be multiplied by 100 for display
	unit: PERCENTAGE
	min: 0
	max: 100
	*/
	optional int32 ifAdminUpOperDown = 7;

	/* 
	Value is 1 if oper is up else 0. This value should be multiplied by 100 for display.
	unit: PERCENTAGE
	min: 0
	max: 100
	*/
	optional int32 ifAdminUpOperUp = 8;

	/* 
	Received traffic rate.
	unit: BITS_PER_SECOND
	min: 0
	*/
	optional float ifInBitsRate = 9;

	/* 
	Received traffic utilization.
	unit: PERCENTAGE
	min: 0
	max: 100
	*/
	optional float ifInUtilization = 10;

	/* 
	Received packets rate.
	unit: PACKETS_PER_SECOND
	min: 0
	*/
	optional float ifInPktsRate = 11;

	/* 
	Received packet drops rate.
	unit: PACKETS_PER_SECOND
	min: 0
	*/
	optional float ifInDiscardsRate = 12;

	/* 
	Received packet drops.
	unit: PERCENTAGE
	min: 0
	max: 100
	*/
	optional float ifInDiscardsPercent = 13;

	/* 
	Received packet errors rate.
	unit: PACKETS_PER_SECOND
	min: 0
	*/
	optional float ifInErrorsRate = 14;

	/* 
	Received packet errors.
	unit: PERCENTAGE
	min: 0
	max: 100
	*/
	optional float ifInErrorsPercent = 15;

	/* 
	Transmitted traffic rate.
	unit: BITS_PER_SECOND
	min: 0
	*/
	optional float ifOutBitsRate = 16;

	/* 
	Transmitted traffic utilization.
	unit: PERCENTAGE
	min: 0
	max: 100
	*/
	optional float ifOutUtilization = 17;

	/* 
	Transmitted packets rate.
	unit: PACKETS_PER_SECOND
	min: 0
	*/
	optional float ifOutPktsRate = 18;

	/* 
	Transimitted packet errors rate.
	unit: PACKETS_PER_SECOND
	min: 0
	*/
	optional float ifOutErrorsRate = 19;

	/* 
	Transimitted packet errors.
	unit: PERCENTAGE
	min: 0
	max: 100
	*/
	optional float ifOutErrorsPercent = 20;

	/* 
	Transimitted packet drops rate.
	unit: PACKETS_PER_SECOND
	min: 0
	*/
	optional float ifOutDiscardsRate = 21;

	/* 
	Transimitted packet drops.
	unit: PERCENTAGE
	min: 0
	max: 100
	*/
	optional float ifOutDiscardsPercent = 22;

	/* 
	Interface IfType (IANAifType)
	*/
	optional int32 ifType = 23;
  };
}

Protobuf message definitions for Performance CEPMGNSS

syntax = "proto3";

package com.cisco.ems.performance.proto;


message CEPMGNSSRecords{

  repeated Record records = 1;
  message Record {
  
  	uint64 eventtime = 1;

	/* 
	Module lock status
	*/
	optional int32 gnssModuleLockStatus = 2;

	/* 
	Module presence status
	*/
	optional int32 gnssModulePresenceStatus = 3;

	/* 
	Module slot info
	*/
	optional int32 gnssModuleSlotInfo = 4;

	/* 
	Module slot state
	*/
	optional int32 gnssModuleSlotState = 5;

	/* 
	Module visibility status
	unit: NUMBER
	*/
	optional int32 gnssSatelliteVisibilityStatus = 6;

	/* 
	Satellite locks count
	unit: NUMBER
	min: 0
	*/
	optional int32 gnssModuleSatelliteCount = 7;

	/* 
	Antenna short alarm status
	*/
	optional int32 gnssAntennaShortAlarmStatus = 8;

	/* 
	Antenna open alarm status
	*/
	optional int32 gnssAntennaOpenAlarmStatus = 9;

	/* 
	Module SNR
	unit: DB
	*/
	optional string gnssModuleSvIdSNR = 10;
  };
}

Protobuf message definitions for Custom proto

syntax = "proto3";
//import "google/protobuf/any.proto";

package com.cisco.ems.performance.proto;

message CustomRecords {

  optional string schemaName = 1;

  repeated Record records = 2;

  message Record {
    repeated Property property = 1;
    message Property {
      string key = 1;
      oneof value{
        string strValue = 2;
        int32 intValue = 3;
        float floatValue = 4;
        uint64 longValue = 5;
        double doubleValue = 6;
        bool boolValue = 7;
      }
    }
  }
}