Onboarded devices
An onboarded device is a network entity that
-
appears in the consolidated device list after onboarding,
-
displays detailed information through status, alarms, inventory, and history tabs, and
-
enables actions such as editing, deleting, and syncing inventory.
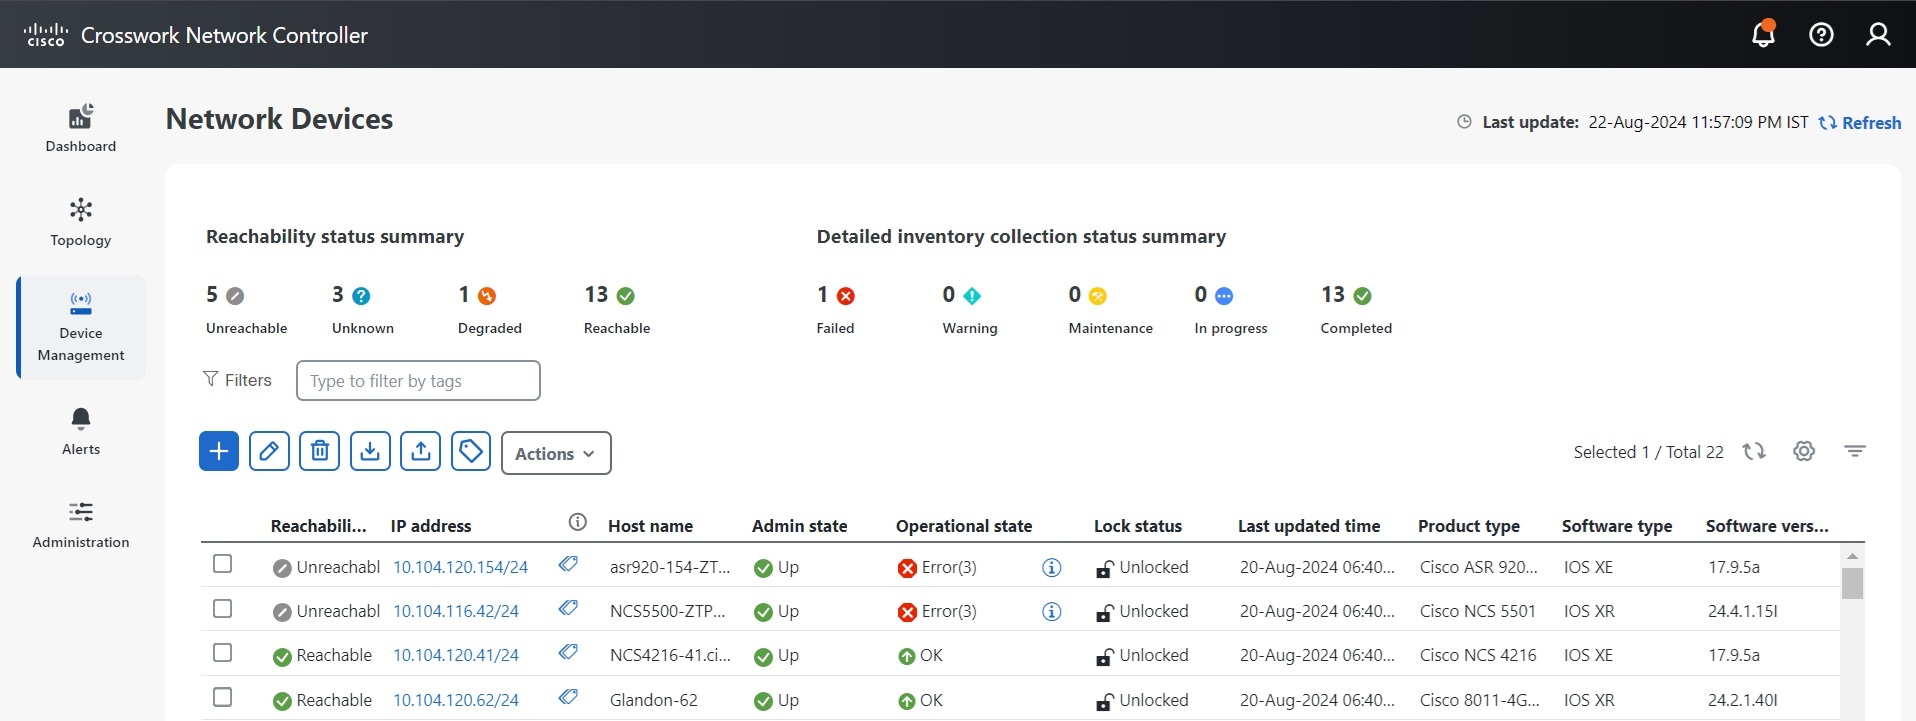
The Network Devices window consolidates all onboarded devices, displaying their current status and providing access to tabs for device detail, alarms, inventory, and history.
For controlling or restricting device access for users, see Manage Device Access Groupsin the Cisco Crosswork Network Controller 7.2 Administration Guide .
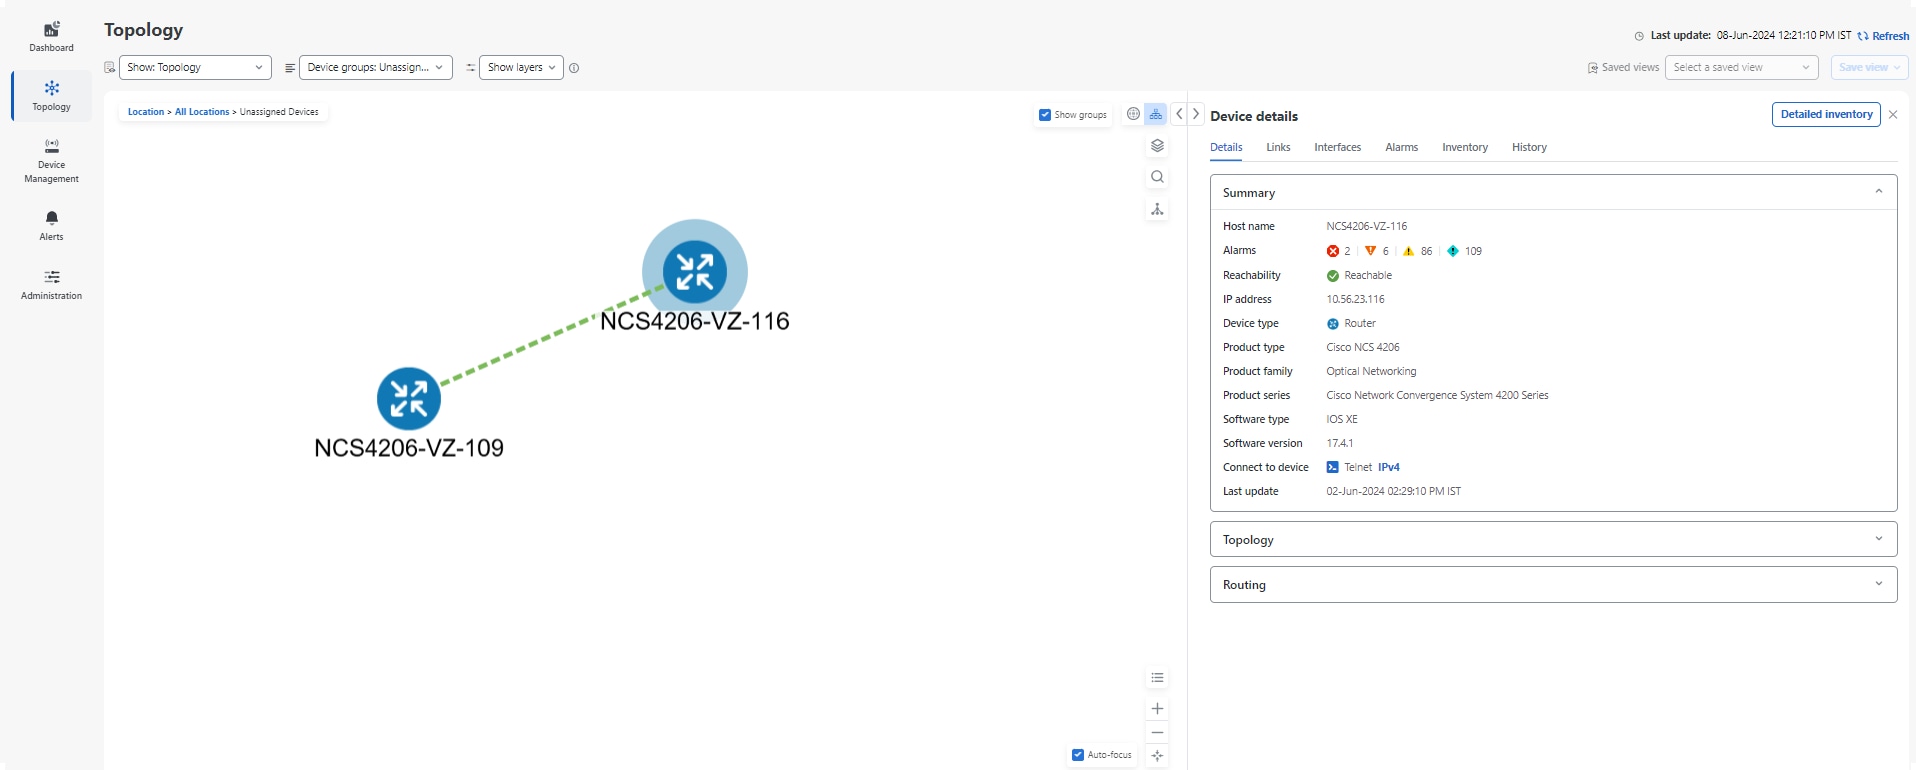
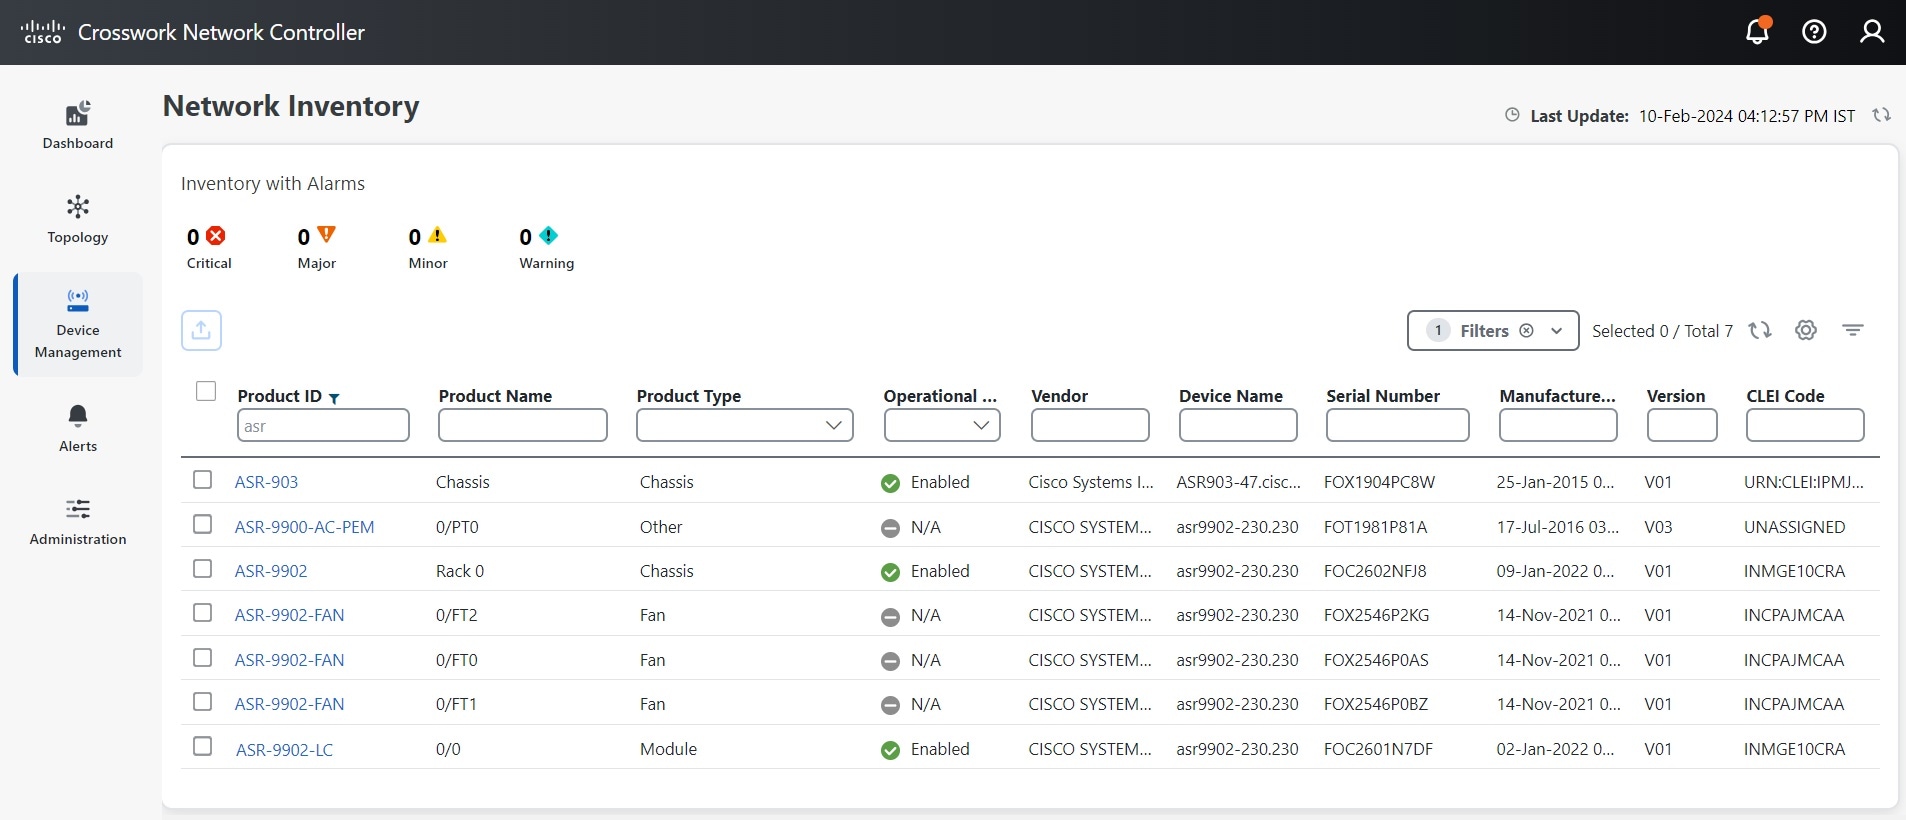
Device details in the Network Devices window
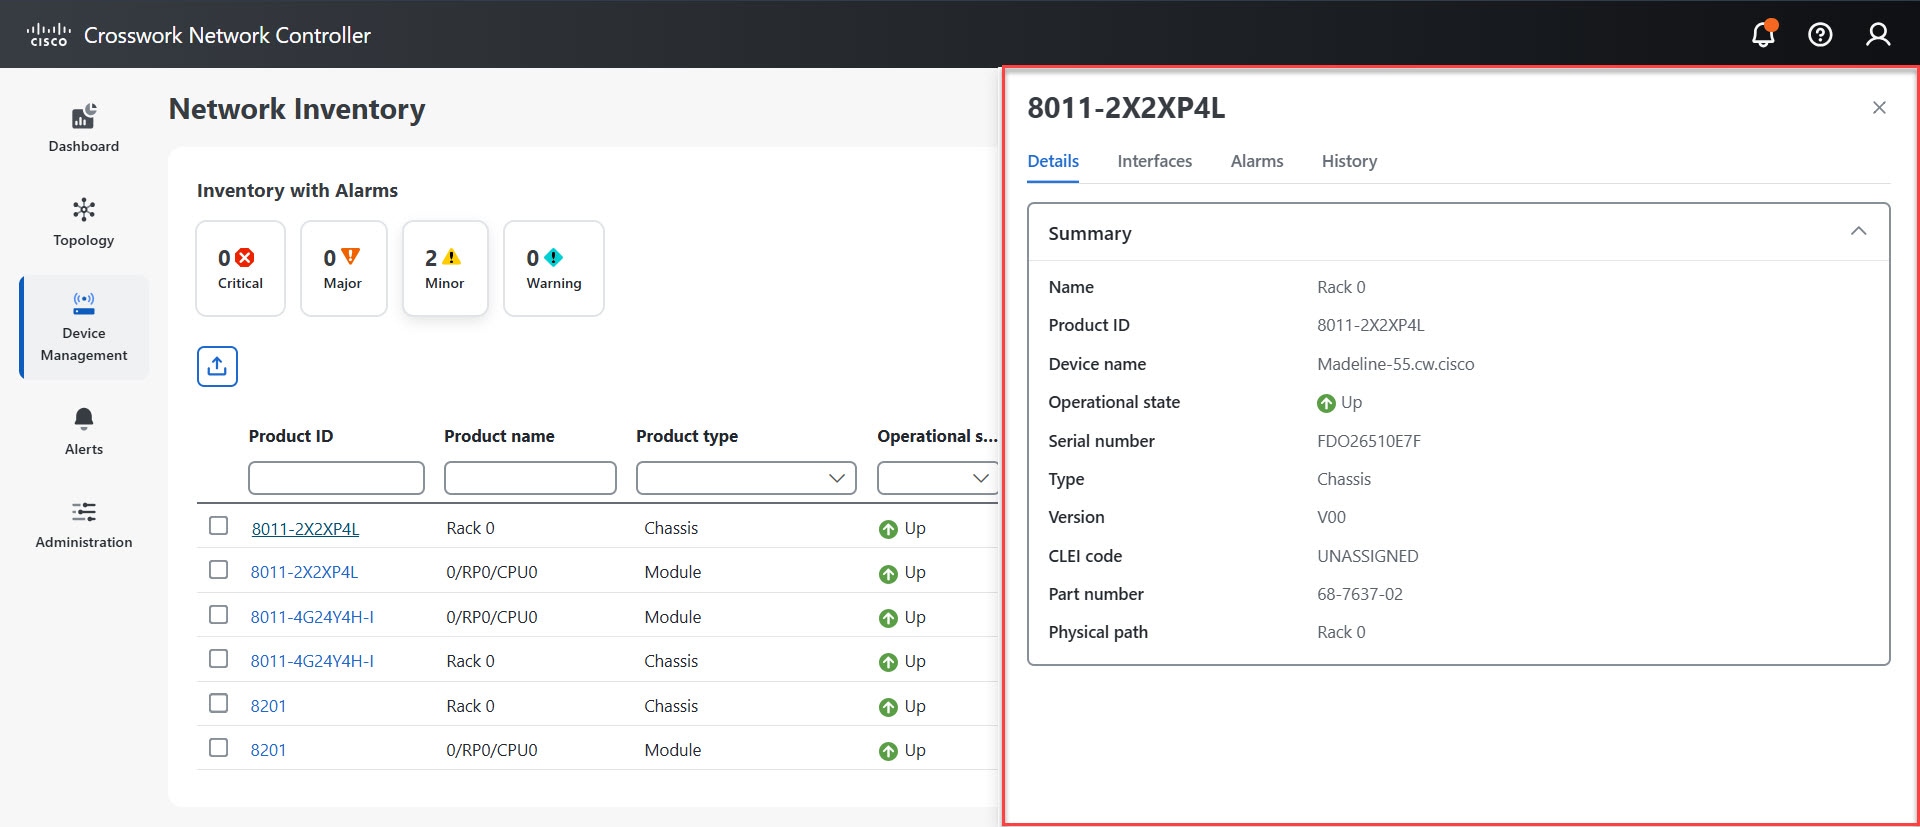
The Network Devices window in the interface displays all onboarded devices and their current operational status. You can view the Network Devices window by selecting Device Management > Network Devices from the main menu.
Clicking on the IP address link of a device displays information about each device in the pop-up window. Each onboarded device record contains the following details:
-
A Details tab with device specifications, onboarding time, connectivity details, routing information and detailed inventory collection. On this tab, devices with a supported SysOID are marked as Certified . If the SysOID is missing from the certified list, the support type is Uncertified . Incomplete discovery or no CDG connection sets it to Unknown .
Refer to the Cisco Crosswork Network Controller Essentials Supported Devices for a list of supported OIDs for devices.
-
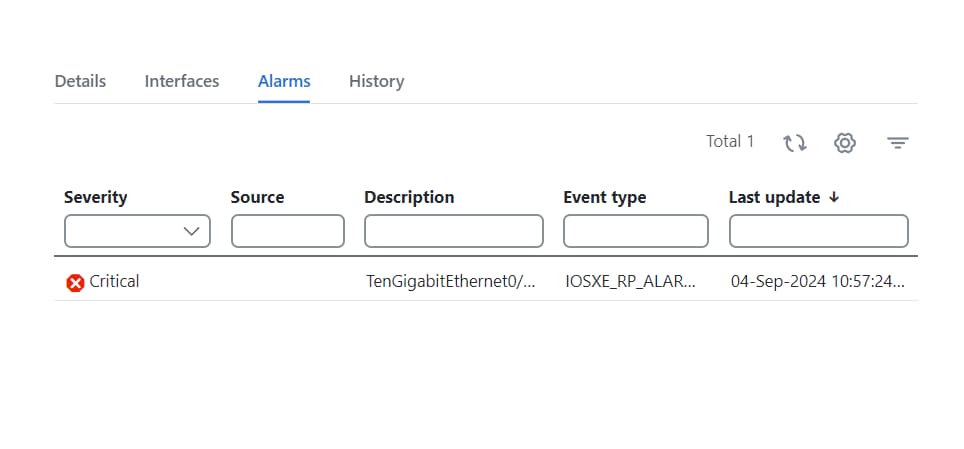
An Alarms tab with detailed information on alarms, including their severity, the source (Syslog, Trap, or gNMI), the category, and the current condition of each alarm. The tab allows you to customize the displayed columns.
-
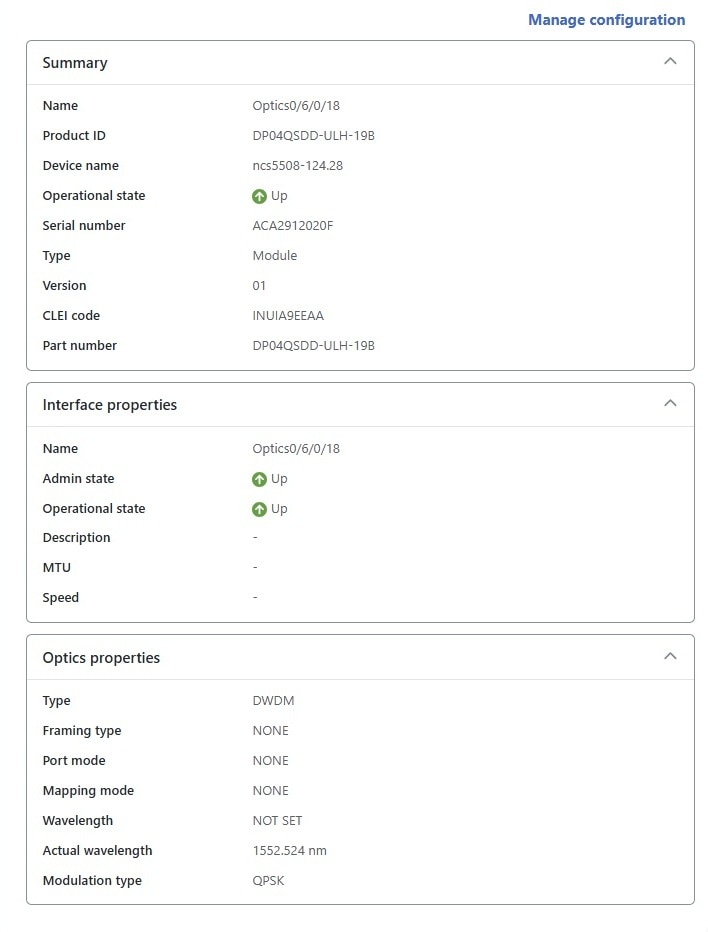
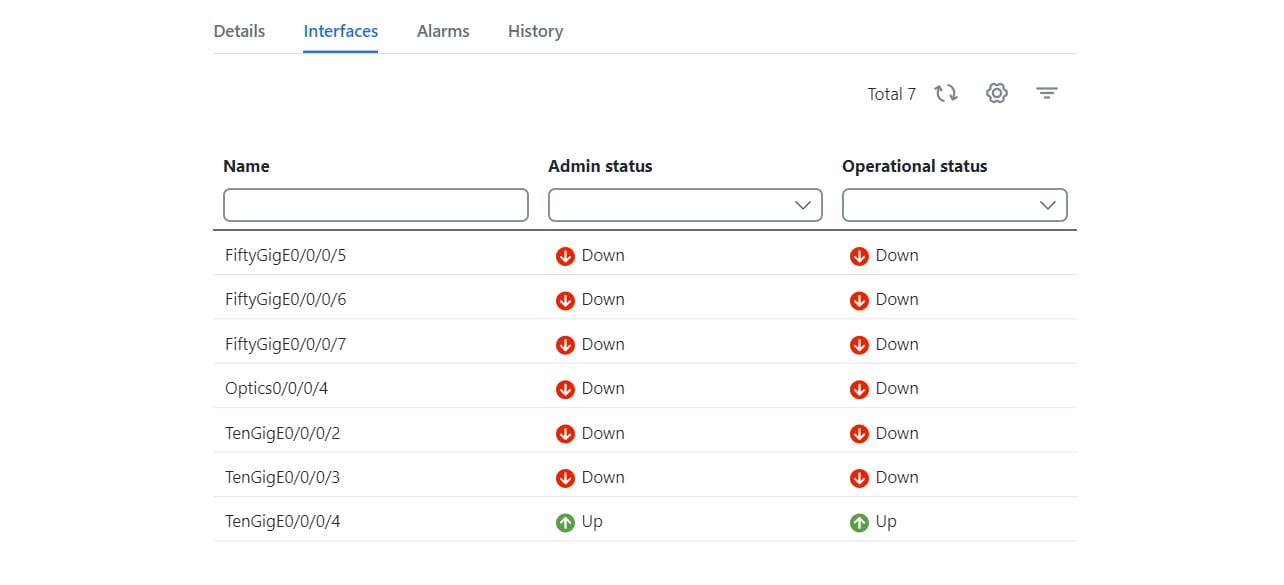
An Inventory tab displaying the product name, product ID, admin status, operational status, and serial number. You can customize the columns according to your preferences.

Note
A component of a device lacking a serial number is not displayed in the Inventory tabs within the Crosswork UI. Additionally, the tree structure in the Detailed Inventory window also excludes components without serial numbers.
-
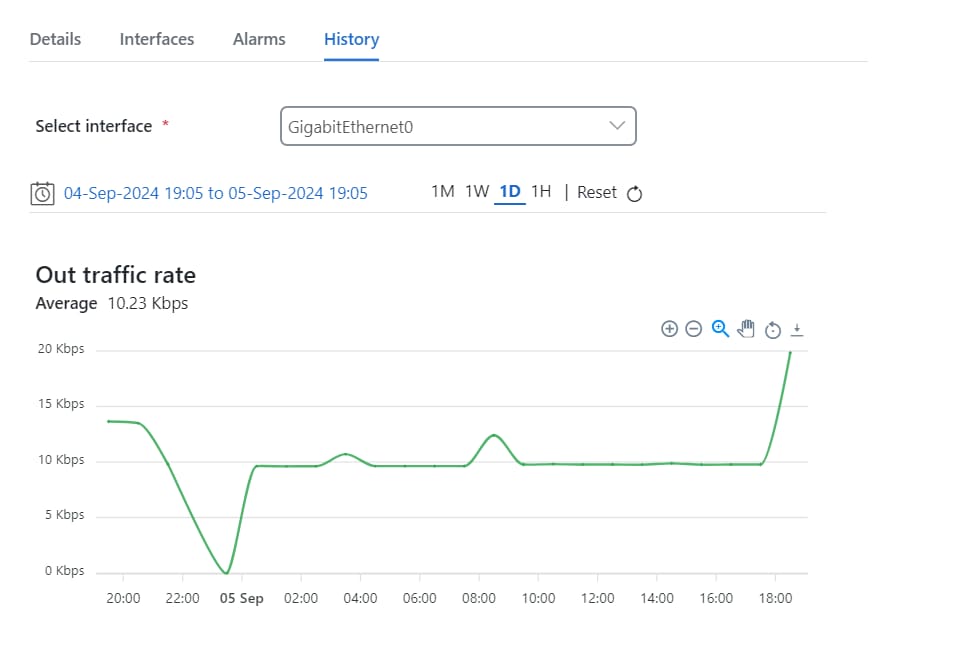
A History tab with detailed information about device performance, including various performance metrics.
Note
Average values for all performance metrics are displayed under the History tabs in the Crosswork Network Controller UI. However, the relevance of the average values may vary across different metrics. Assess the context of each metric before using the average values in your analysis.
Device states
Crosswork Network Controller computes the reachability state of the devices it manages, as well as the operational and NSO states of reachable managed devices. It indicates these states using the icons in the following table. By monitoring the reachability and operational states of devices, you can get real-time information about their connectivity status, enabling you to quickly identify and resolve any connectivity issues.
At the top of the Network Devices window, you can view a summary of the reachability status of your devices. Additionally, the list of devices displays the reachability state, admin state, and operational state for each device.
| This Icon... | Indicates... | ||
|---|---|---|---|
|
Reachability State icons indicate if a device is reachable. This state is computed when the device is configured as UP. It is not computed if the device is DOWN or UNMANAGED.
|
|||
|
|
Reachable: The device can be reached by all configured protocols. |
||
|
|
Reachability Degraded: The device can be reached by at least one protocol, but is not reachable by one or more of the other protocols configured for it. |
||
|
|
Unreachable: The device cannot be reached by any protocol configured for it. |
||
|
|
Reachability Unknown: Crosswork Network Controller cannot determine if the device is reachable. |
||
|
Operational State icons show if a device is operational.
|
|||
|
|
The device is operational and under management, and all individual protocols are "OK" ( also known as "up"). |
||
|
|
The device is not operational ("down"). The same icon is used when the device has been set "administratively down" by an operator. |
||
|
|
The device's operational state is unknown. |
||
|
|
The device's operational state is degraded. |
||
|
|
The device's operational state is in an error condition. It is either not up, or unreachable, or both, due to errors encountered while attempting to reach it and compute its operational state. The number in the circle shown next to the icon indicates the number of recent errors. Click on the number to see a list of these errors. (Note that the icon badging for errors is not available in the topology map.) |
||
|
|
The device's operational state is currently being checked. |
||
|
|
The device is being deleted. |
||
|
|
The device is unmanaged. |
||
|
NSO State icons show whether a device is synced with Cisco NSO.
|
|||
|
The device is in sync with Cisco NSO. |
|||
|
The device is out of sync with Cisco NSO. |
|||
Note |
|
Filter network devices by tags
Quickly locate and group network devices by applying one or more tag filters.
Use this task to find devices that share specific attributes, such as location or administrator, based on assigned tags. You can also use tags to find and group devices with the same or similar tags in any window that lists devices.
Before you begin
Confirm that tags have already been created and assigned to the devices you want to filter.
Procedure
|
Step 1 |
From the main menu, go to . |
|
Step 2 |
In the Type to filter by tags field, enter all or part of a tag name. The Type to filter by Tags bar has a type-ahead feature: As you start typing, the field shows a drop-down list of tags that match all the characters you have typed so far. To view all available tags, enter an asterisk (*). |
|
Step 3 |
Select a tag from the drop-down list. The table or map shows only the devices with that tag. |
|
Step 4 |
To filter on more than one tag, repeat Steps 2 and 3 for each additional tag you want to set as part of the filter. After selecting your tags, the table or map shows devices that match at least one of the selected tags. |
|
Step 5 |
To clear tag filters, click the X next to that tag in the filter bar. |
The system displays only those devices matching all selected tags. The filter remains in effect until cleared or changed.
What to do next
To see how tags can be managed for assignment to the devices in your network, refer to the section Manage tags in the Cisco Crosswork Network Controller 7.2 Administration Guide.
Edit device settings
Modify settings for onboarded network devices.
Use this task to ensure device configurations remain current as network requirements change.
Before you begin
-
Ensure that you have administrative access and consider any network impact when you make changes.
-
Export a CSV backup of the devices you plan to change to avoid potential data loss.
-
For a list of the fields you can edit through the Crosswork Network Controller UI, refer the section, Field descriptions for new device addition.
Procedure
|
Step 1 |
From the main menu, choose . |
||
|
Step 2 |
(Optional) Filter the list of devices by filtering specific columns. |
||
|
Step 3 |
Select the check box of the device you want to change, then click Edit. |
||
|
Step 4 |
Update the device settings as needed.
|
||
|
Step 5 |
Click Save. The Save button is enabled only after all required fields are complete. |
||
|
Step 6 |
Resolve any errors and confirm device reachability. |
Device settings are updated and saved successfully.
Delete a device
Remove a device from Crosswork Network Controller so it is no longer monitored or managed. Device deletion may be necessary if a device is being withdrawn, reassigned, replaced, or was added by mistake.
Perform this task when you need to clean up your network inventory by eliminating devices that are not active or no longer required.
Before you begin
-
Export a backup CSV file containing the devices that you plan to delete.
-
If you set the auto-onboard property as managed or unmanaged for an SR-PCE provider, set auto-onboard as off for one or more SR-PCEs.
-
Confirm that the device is disconnected and powered off before deleting the device.
-
If devices are mapped to Cisco NSO with MDT capability and have active telemetry configurations, those configurations will be removed during deletion.
-
If auto-onboard is not set to off and it is still functional and connected to the network, the device is rediscovered as unmanaged when it is deleted.
Procedure
|
Step 1 |
From the main menu, choose . |
|
Step 2 |
(Optional) Filter the device list by entering text in the Search field or applying column filters to locate devices for deletion. |
|
Step 3 |
Select the check box for the devices you want to delete. |
|
Step 4 |
Click the Delete icon. |
|
Step 5 |
In the confirmation dialog box, confirm the deletion. |
The selected devices are removed from Crosswork Network Controller and are no longer monitored or managed within the platform.
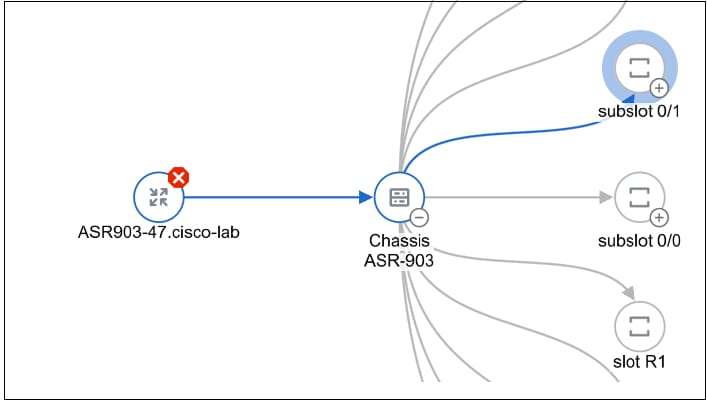
Detailed inventory collection
An inventory collection status is a network management indicator that
-
shows the current state of the device inventory collection process,
-
uses status icons to convey progress, errors, or maintenance states, and
-
helps users quickly assess device data completeness or issues in Cisco Crosswork Network Controller.
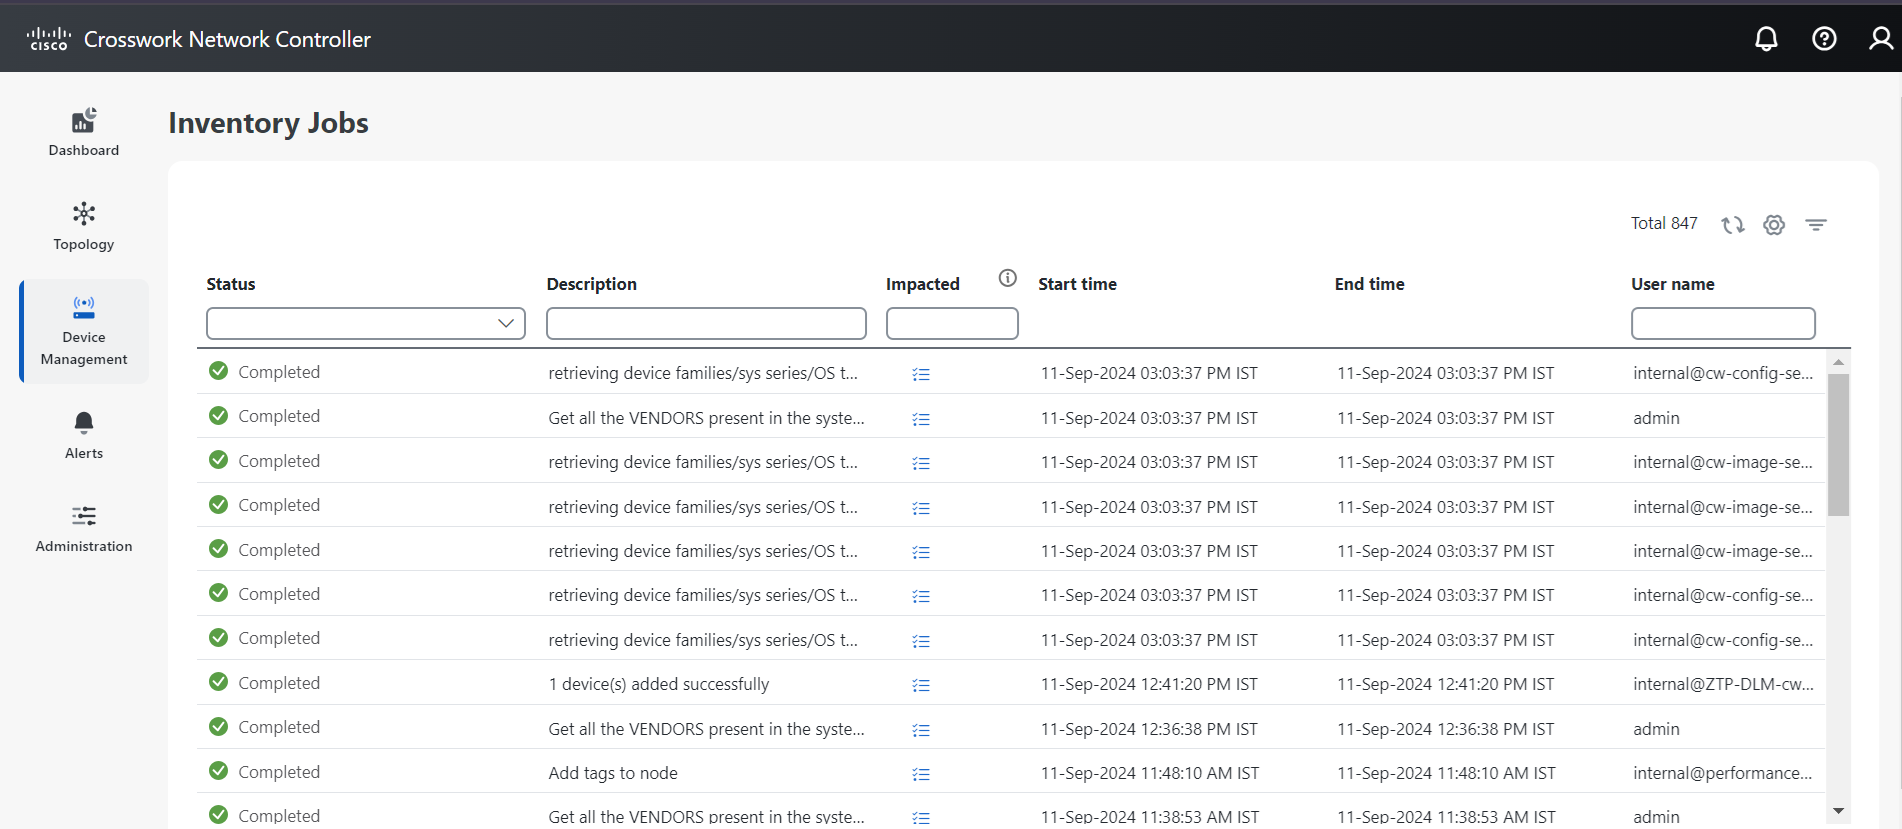
Inventory collection status
The table illustrates the standard inventory collection statuses and their meanings.
|
This icon |
Indicates |
|---|---|
|
|
Completed: The device inventory collection process has finished. |
|
|
Failed: The device inventory collection process has encountered an error and did not complete. |
|
|
In Progress: The device inventory collection is in progress and the system is currently in the process of collecting and updating inventory data for network elements. |
|
|
Maintenance: Operation for detailed inventory collection is suspended. It may not be possible to initiate new inventory collection processes, or the data displayed might not reflect the most recent state of the network elements. |
|
|
Warning: The inventory collection process has encountered some issues that may not have completely prevented the process from completing but could still affect the accuracy or completeness of the data collected. After addressing the causes of the warnings, the inventory collection process may need to be rerun to confirm that all issues have been resolved and that the collected data is both accurate and complete. |


Note |
For Cisco ASR 9000 Series devices operating as Large Routers, with 1,000 or more interfaces migrated from a prior release to Crosswork Network Controller 7.2, the Completed state is not achieved automatically. To finalize the device's status, add the gNMI credentials and then perform a detailed inventory synchronization. |
Change granular inventory status
Enable or disable granular inventory on selected devices to manage device data detail and system resource usage.
Granular inventory in Crosswork Network Controller provides detailed device data for enhanced monitoring and troubleshooting. Enabling granular inventory provides more detailed data but may consume additional system resources and storage. Disabling it can improve performance, especially in large networks.
The inventory sync process includes several automated steps. A nightly sync updates the inventory system, while any failed features for devices prompt a sync attempt every 30 minutes. Newly added devices in the UP state and existing devices transitioning from DOWN to UP state also trigger inventory syncs. The automatic synchronization occurs when there are configuration or state changes on a device. The device notifies these changes through traps or syslogs.
Before you begin
-
Ensure you have the required permissions to modify device inventory settings.
-
Confirm all devices you wish to modify are in the same current state. The devices should either all be enabled or all disabled for a granular inventory update.
Procedure
|
Step 1 |
To enable granular inventory:
|
|
Step 2 |
To disable granular inventory: |
Selected devices have their granular inventory status changed as specified. A nightly synchronization will update details for those with granular inventory enabled.
Perform detailed inventory sync
Ensure that the system maintains an up-to-date view of all network devices by synchronizing detailed inventory information.
Perform this task when network changes occur, such as adding new devices, removing devices, or updating device configurations. An on-demand inventory sync captures and updates these changes in the system.
Before you begin
Follow these steps to synchronize the network device inventory:
Procedure
|
Step 1 |
From the main menu, choose . |
|
Step 2 |
Select one or more devices to synchronize. |
|
Step 3 |
Click to sync and reflect the current state of the network devices.
|

 Feedback