Use this procedure to launch workspaces. The task helps you open focused monitoring and management views for service, network, and operational workflows.
Use this procedure to view launch workspaces in Cisco Optical Network Controller. Complete this task when you need to configure, verify, or manage the related network operation.
Workspaces provide focused environments for specific monitoring and management tasks. They integrate data and functionality from multiple applications, presenting a unified view and streamlined workflow for users. This approach reduces the need to navigate between different applications, improving efficiency and user experience.
From 25.1.1 release, you can acknowledge and unacknowledge alarms from the alarms tab in workspaces.
From 26.1.1 release, Circuit workspaces support PM history for OTN services that include the PM of all the ODU ports in both working and protect paths.
Before you begin
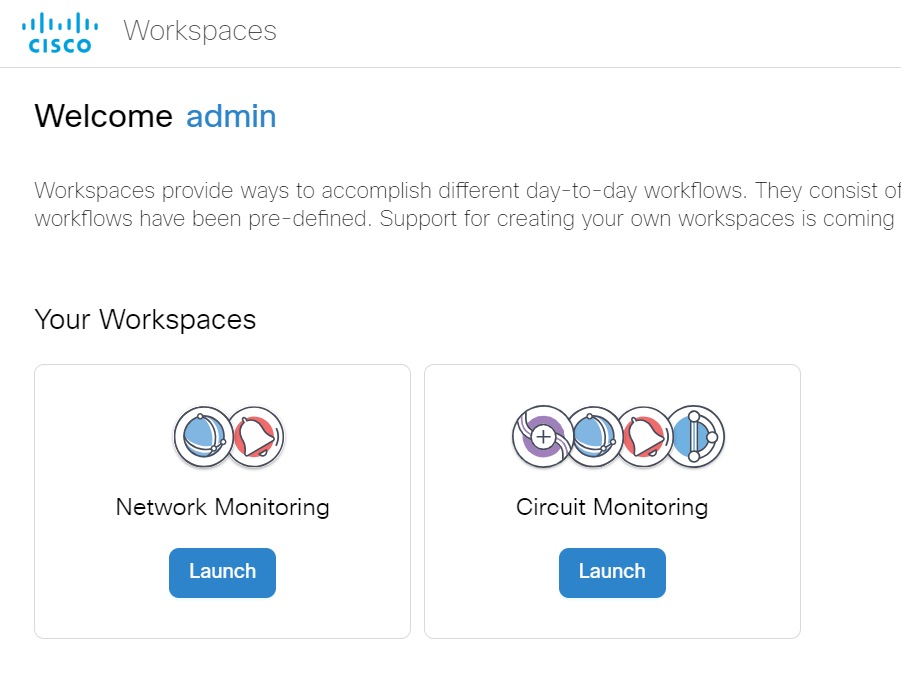
Workspaces option allows you to manage different workflows on a daily basis. The multiple standalone applications can interact with each other anytime and are displayed in multiple panels. The workflows available are Network Monitoring, Link Monitoring, and Circuit Monitoring.
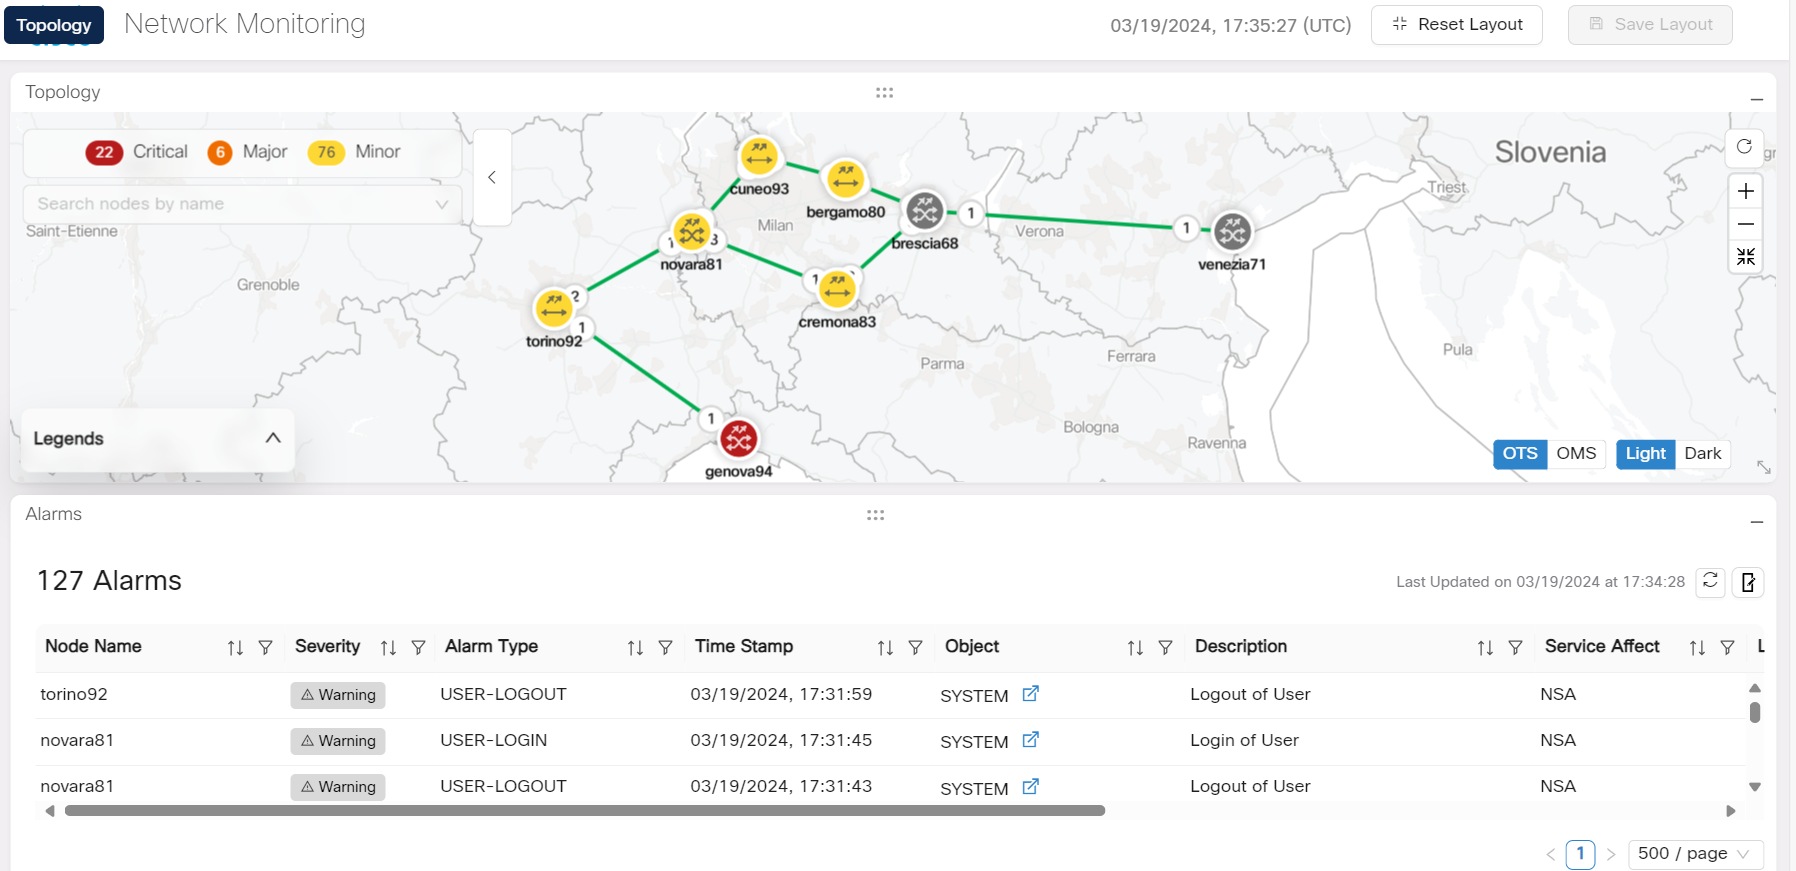
In the network monitoring screen above, the alarm details are displayed based on the node or link which is selected from topology.
In the Topology screen above, select any node or link and right click followed by Show service(s). This will display all the services related to the selected node or link in the services layout.
In the Alarms screen above, select any alarm and right click followed by Show Affected service(s). This will display all the services related to the selected alarm in the services layout.
From 24.3.1 release onwards, PM tab is available in the Circuit Monitoring workflow application.
The IMPROPER-REMOVAL alarm is not displayed in the detailed service path or the alarms table when a circuit is selected.
There can be many such workflows that can be added to the workspace anytime. Also, the workspace panels are dynamic and interactive. By default, we can see the Alarms, Service List, Topology and Detailed Service Path panels. These individual panels can be dragged and dropped anywhere on the monitoring screen. They can also be minimized and maximized as necessary anytime.
The alarms displayed here are applicable to the selected services only and not to the entire Topology. Also for multi carrier services, alarms are displayed for the selected carrier only.
Follow these steps to view launch workspaces:
Procedure
The view launch workspaces task is complete.