This section provides details about audit and debug logs, including log categories, display features, retention, archiving, and SEDO commands. Use it to understand log behavior and administration options.
Use this reference to understand audit and debug logs.
Audit and debug logs include:
-
Cisco Optical Network Controller supports two sets of logs:.
-
The Audit logs.
-
The developer or Debug logs.
-
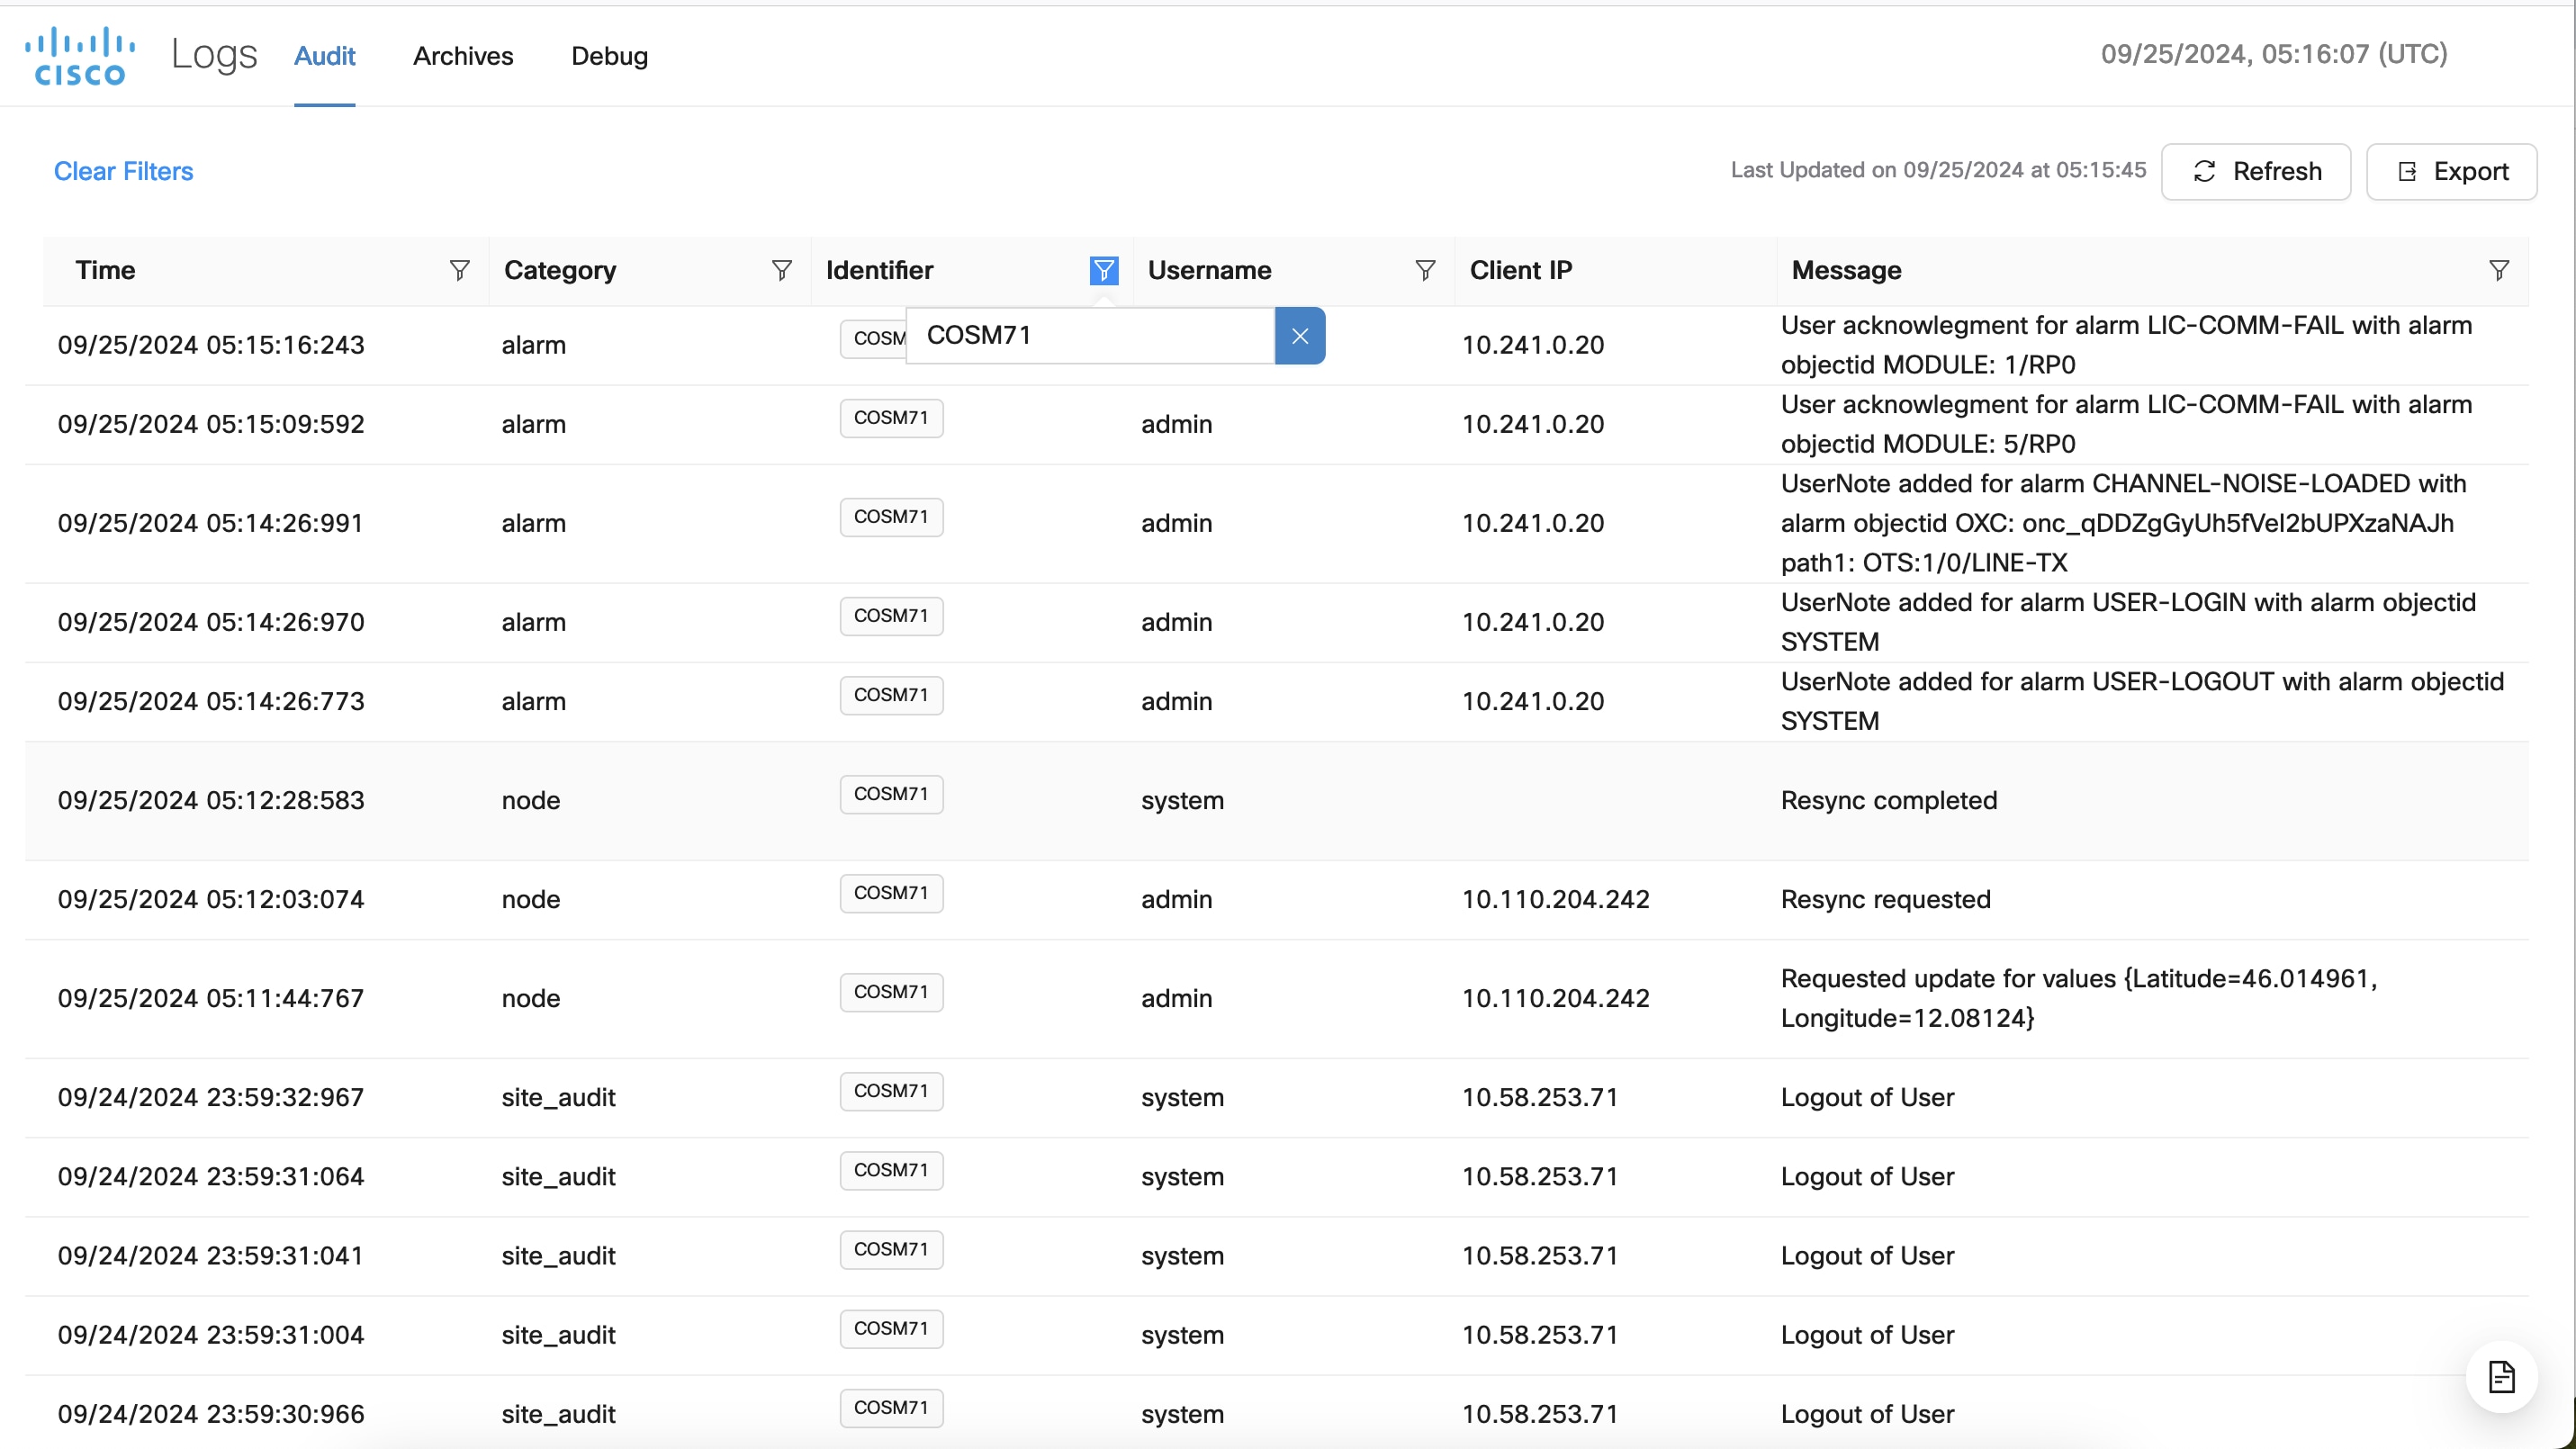
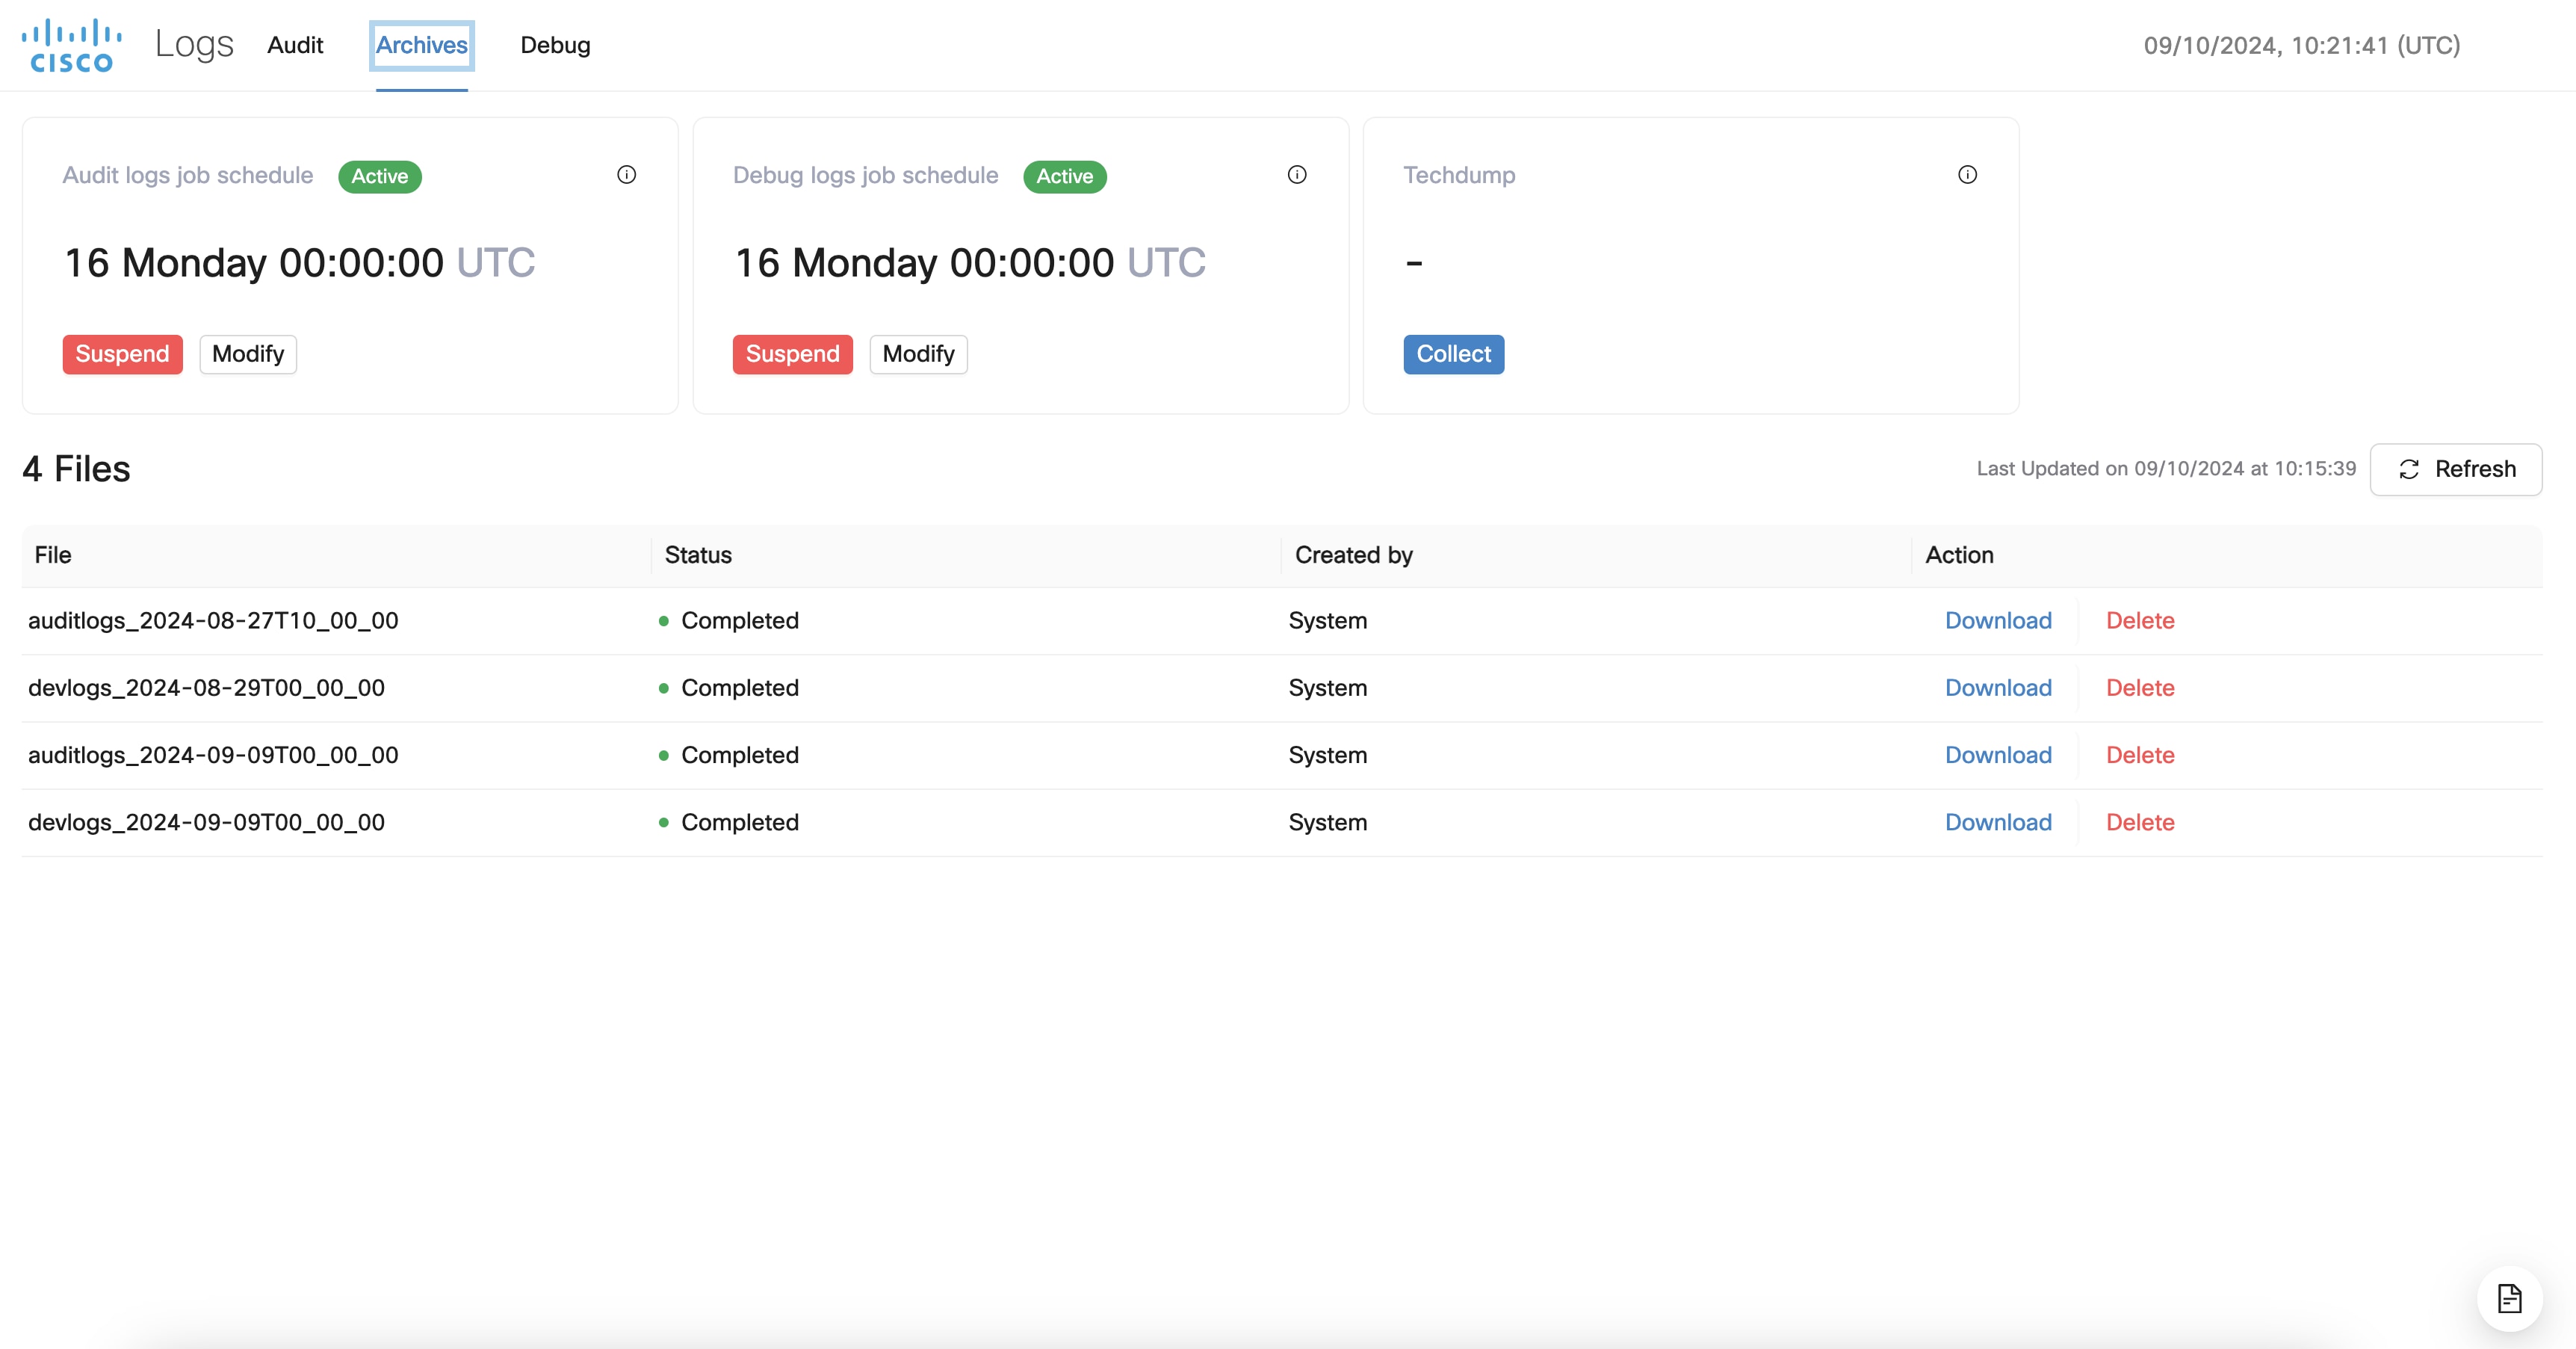
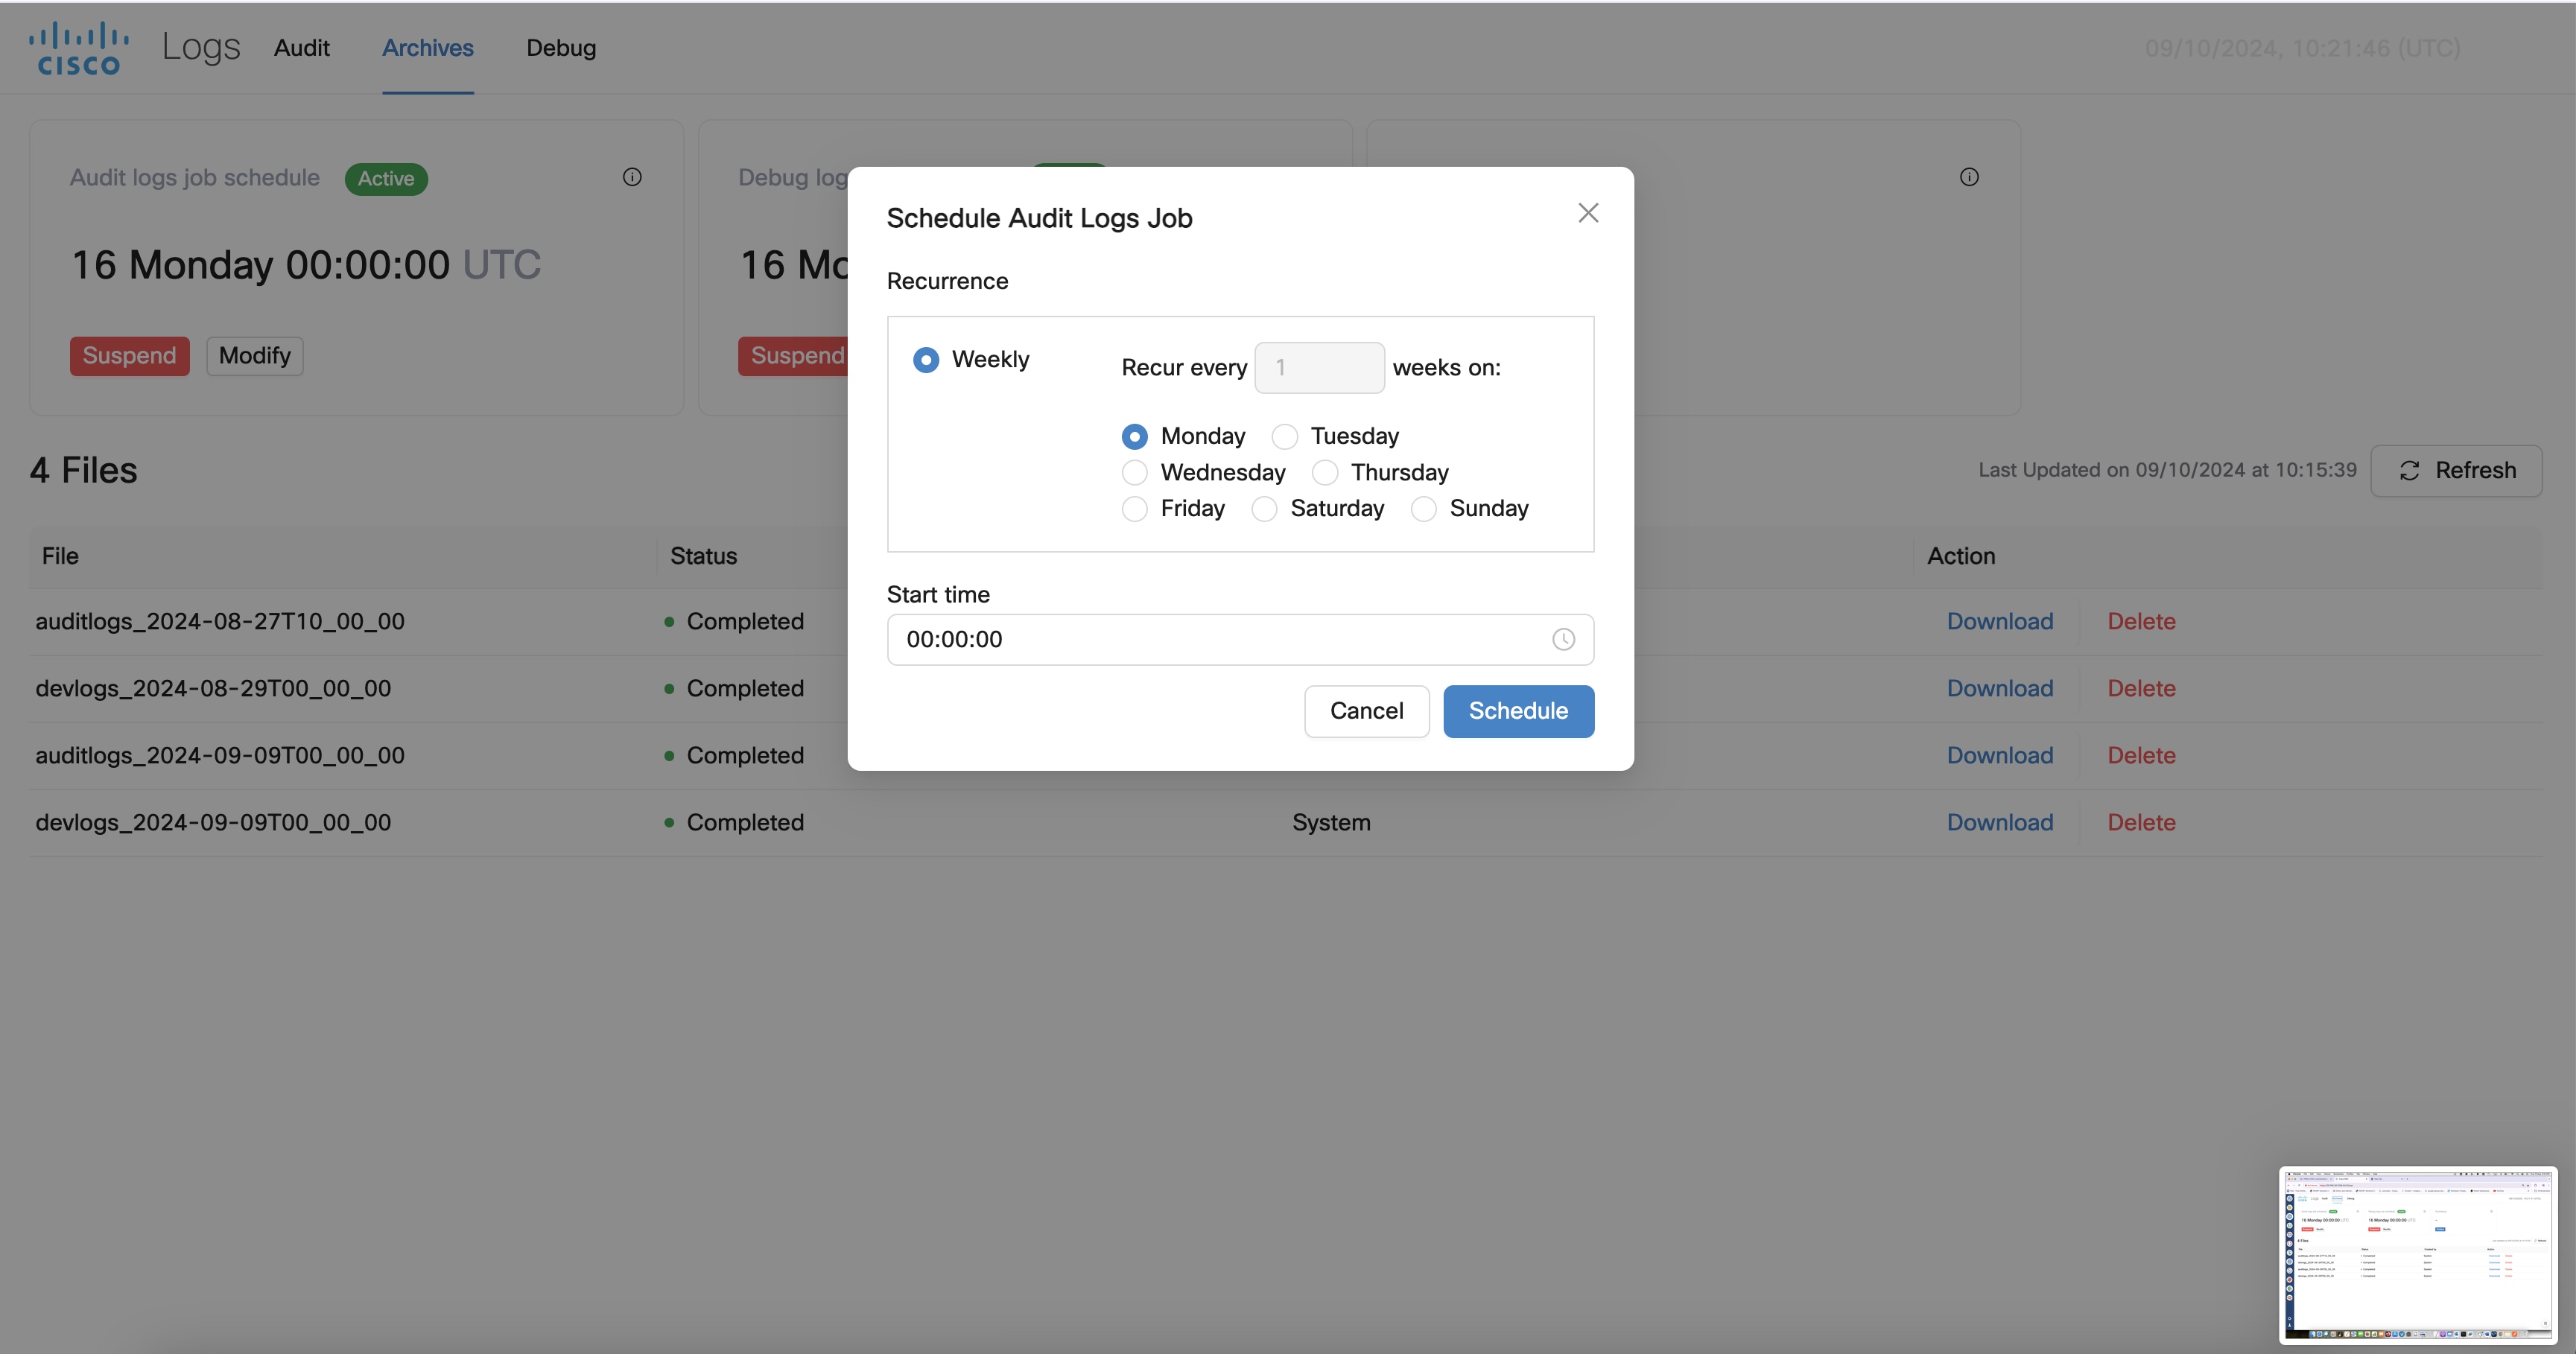
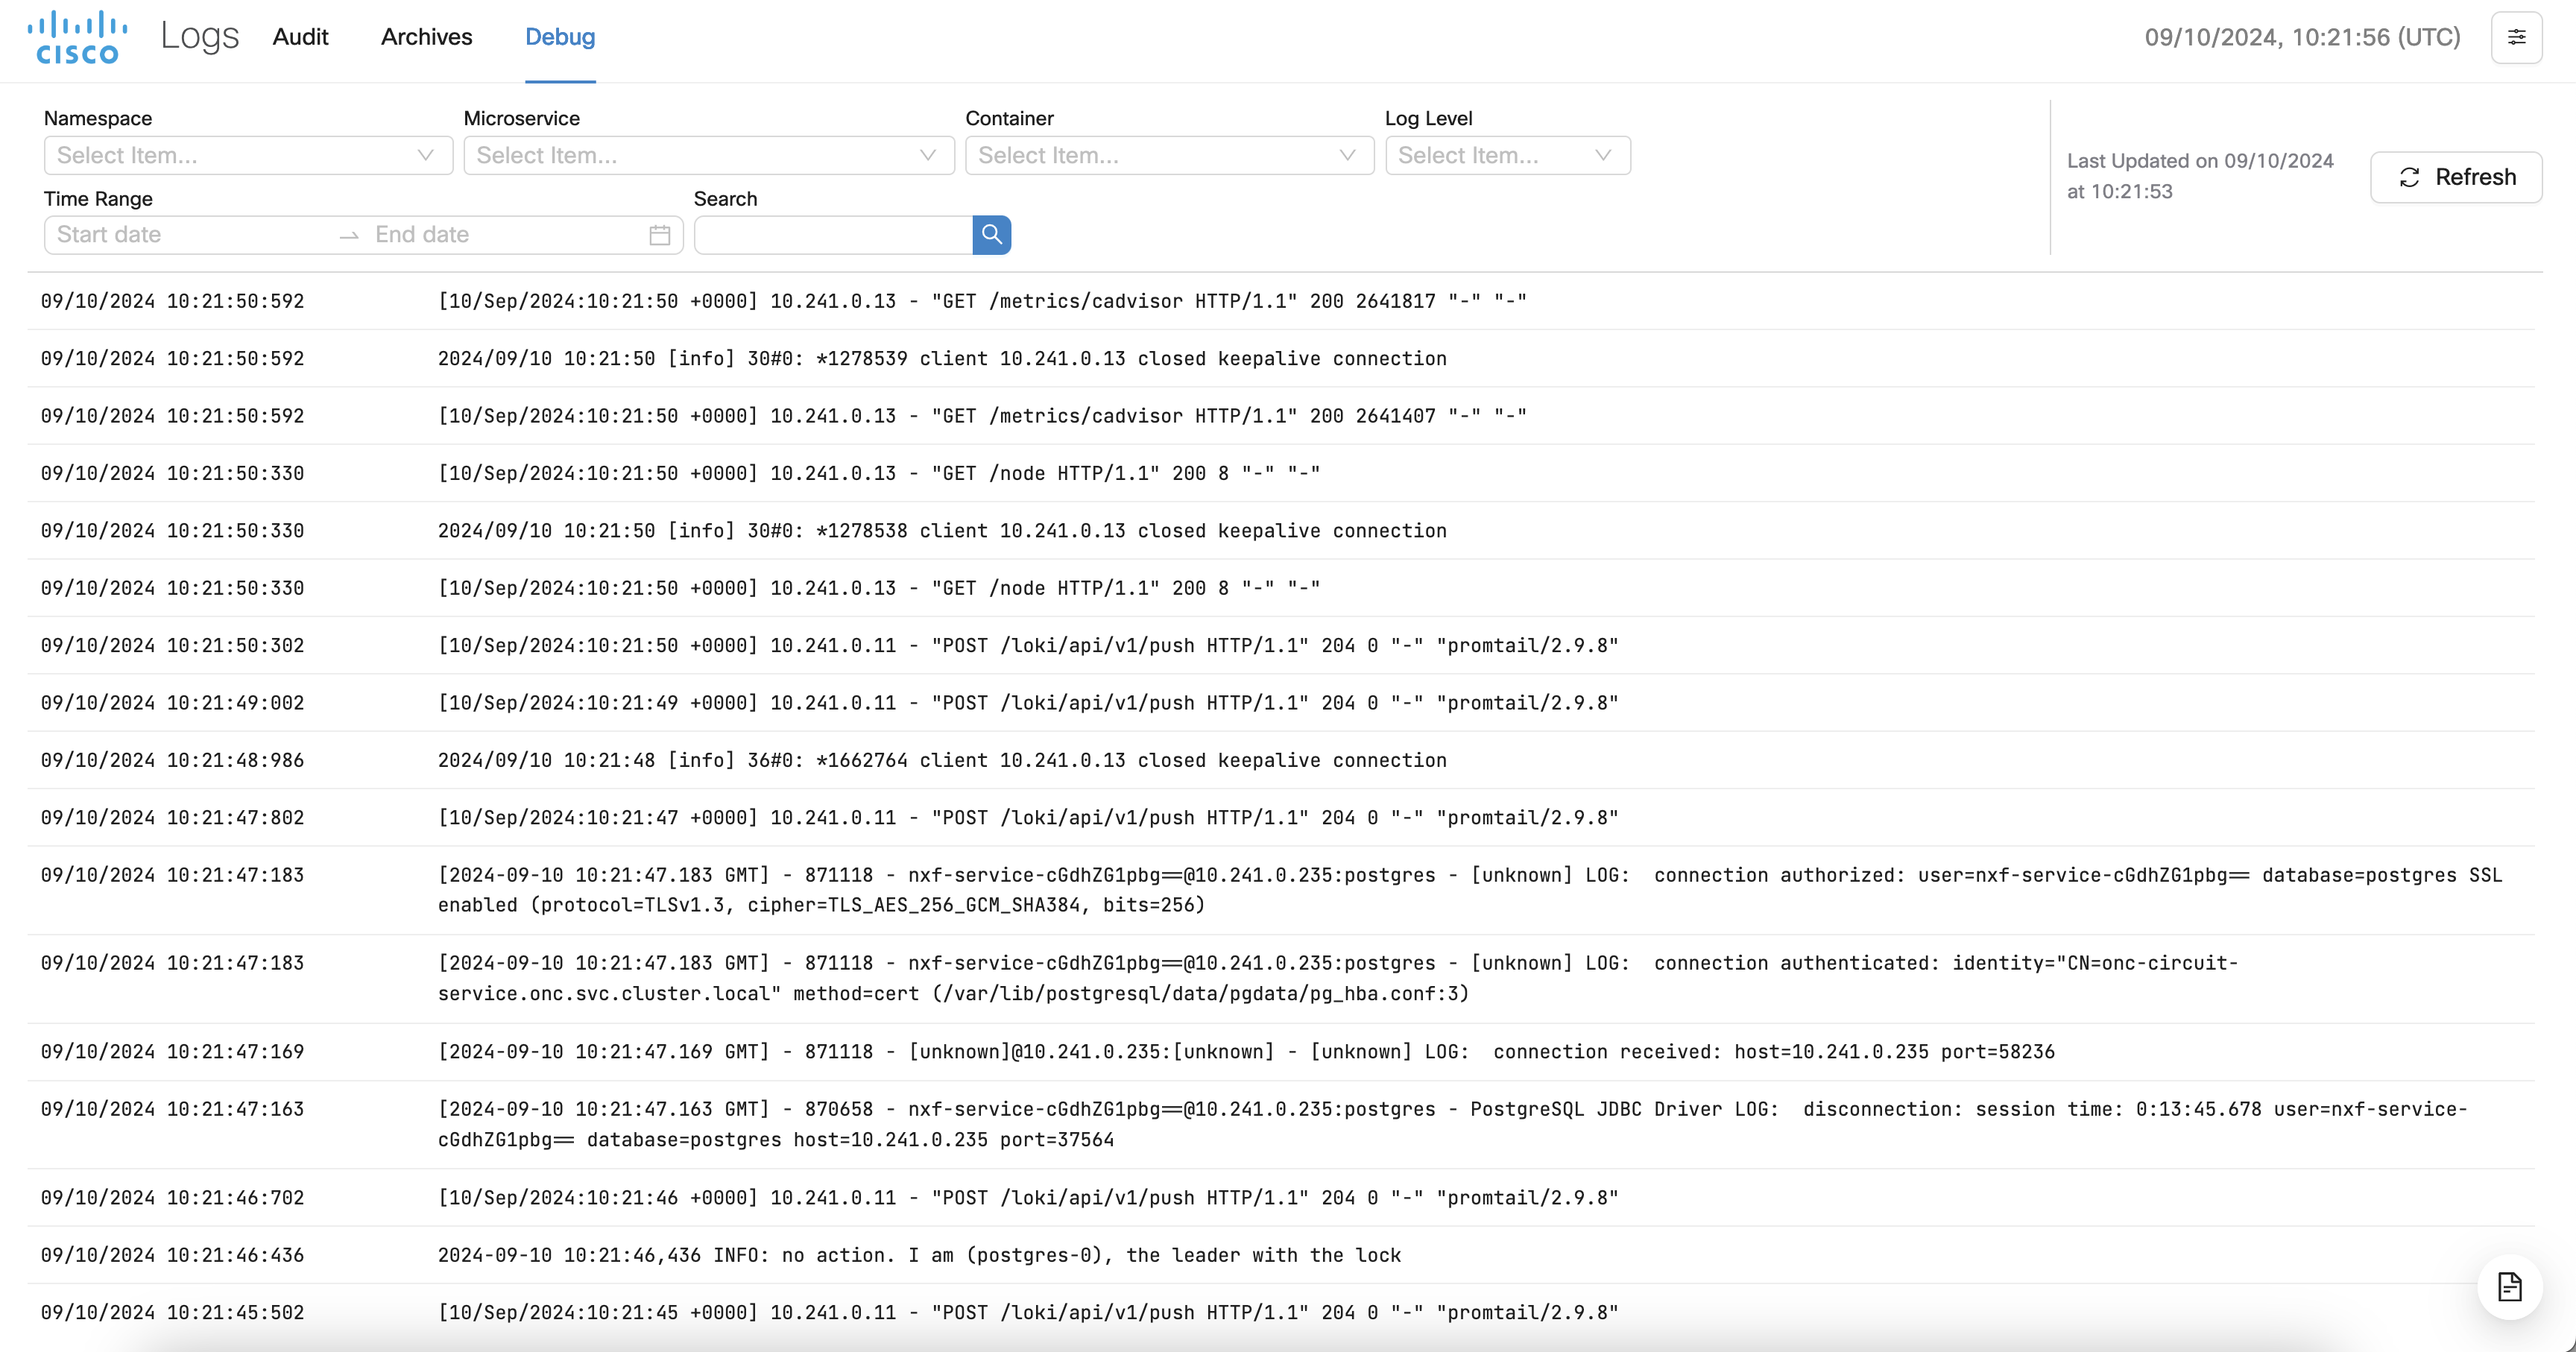
Both these logs can be viewed online, using the Logs application's Audit and Debug tabs. These logs are archived every week on Monday around midnight by default. The archived logs are in the .tgz format. You can also schedule different day and time values as the archive scheduler time. These archives can be downloaded and deleted using the Archive tab.
Audit logs
Audit logs include:
-
The Audit logs option helps in:.
-
Auditing all the Cisco Optical Network Controller operations which include circuit operations, Cisco Optical Network Controller and COSM user login or logout procedures and traffic related operations that are done on COSM or node.
-
The logs can be used to learn about all the changes that have occurred as a result of external notifications that come from connected nodes. Audit logs are not added for configurations which are done on the devices before the device discovery.
Display features
Display features include:
-
Pagination and filter options are available for Audit logs.
-
Filter option is set to All by default.
Categorization of audit logs
Categorization of audit logs include:
-
Audit logs are categorized into:.
-
Only admin or internal users can view logs, collect techdump, download or delete archive files and schedule archive. Only users with read-only permission and the supervisor users can view the archived files and collect techdump. The user names are based on the type of user. The User Name field is marked as [ Unknown ] for a few scenarios. For example: when the user login authentication fails, because of incorrect credentials you get this message: User failed while logging in due to invalid CSRF token .
|
Category Field |
Description |
|---|---|
|
System |
The events that are part of this category are:
|
|
Inventory |
The events that are part of this category are:
|
|
Node |
The events that are part of this category are:
|
|
Service |
The events that are part of this category are:
|
|
Topology |
The events of this category include the OMS and OTS interfaces. |
|
Site_Audit |
The events that are part of this category are:
|
|
Alarm |
All the events related to Alarms. |
|
Alien_Import |
All the events related to Alien_Import. |
|
SNMP |
|
Only admin or internal users can view logs, collect techdump, download or delete archive files and schedule archive.
Only users with read-only permission and the supervisor users can view the archived files and collect techdump.
The user names are based on the type of user.
The User Name field is marked as [Unknown] for a few scenarios. For example: when the user login authentication fails, because of incorrect credentials you get this message: User failed while logging in due to invalid CSRF token.
Debug logs
Debug logs include:
-
Under Debug logs, all the developer logs are displayed with filters and pagination. There is also an option to enable and disable debugging of all services. Also, similar to the Audit logs, the Debug logs have the logs active for up to seven days. After seven days these logs get archived, from where they can also be downloaded.
-
Debug logs that are older than one month are cleared, as they are retained only for a month.
Debug logs that are older than one month are cleared, as they are retained only for a month.
Retention and archiving and archive logs
Retention and archiving and archive logs include:
-
The Audit logs can be retained and saved as given.
-
Audit logs are retained for up to seven days which can be viewed online using the Logs application.
-
Logs beyond seven days are archived and kept in the Cisco Optical Network Controller storage. The Archive logs are maintained for three months and are deleted later.
-
The archived logs can be downloaded any time by using the Archive tab in the Logs application.
-
The Audit logs archiving can be scheduled weekly using the Audit log scheduler.
-
The active Audit logs are visible in the Audit log table for up to seven days after which they are moved to the Archive logs.
-
The archived logs can be retrieved anytime and are available in the archive tab. Archived logs which are more than three months old are deleted by Cisco Optical Network Controller by default.
-
You can download or delete the archived logs anytime. You can also suspend or resume archiving of logs anytime.
Archive logs
Archive logs include:
-
The Archive logs allow you to schedule the logs. It consists of two schedulers:.
-
Audit logs job scheduler : Refers to all the archived audit logs.
-
Debug logs job scheduler : Refers to all the archived developer logs. Techdump : Refers to the on-demand collection of logs from the services which are displayed in the table. It collects the data base (DB) snapshots for all the services. You can collect or download and also delete these logs from the table.
-
The Archive logs are saved as tar zip files. The Suspend and Modify options can be used to suspend, resume or modify the archived logs. The Modify option works on a weekly basis and you can also set any day as the value as per your requirement. The archived audit logs are stored for up to three months where as the developer logs are stored for one month. When one archive collection is proceeding, it is recommended to not change the scheduler time as otherwise it can lead to generation of multiple In Progress tasks.
The Archive logs are saved as tar zip files.
The Suspend and Modify options can be used to suspend, resume or modify the archived logs. The Modify option works on a weekly basis and you can also set any day as the value as per your requirement.
The archived audit logs are stored for up to three months where as the developer logs are stored for one month.
When one archive collection is proceeding, it is recommended to not change the scheduler time as otherwise it can lead to generation of multiple In Progress tasks.
SEDO commands
SEDO commands include:
-
For any issues with the logs, you can collect the techdump data and use the sedo command logs and report them.
-
The sedo commands are as given:.
-
Step 1: Use sedo diagnostics archive-logs /tmp/logs to collect all service 7 days logs. It collects logs and stores them in the /tmp/logs directory with the file name nxfos-logs-xxxxxxx.tar.gz .
-
Step 2: Use the scp command to copy nxfos-logs-xxxxxxxx.tar.gz file to the local system.
-
Download of developer archive logs will time-out when logs are too huge, then it is recommended to use the sedo commands to download:.
-
Step 1: Use the command sedo object-store list onc-torch-service-dev-log-data-archives which lists all archived files under the developer logs. For example: Ex : root@abrageor-nxf:~# sedo object-store list onc-torch-service-dev-log-data-archives ┌─────────────────────────────┬──────────────┬───────────────────────────────┐ │ OBJECT │ SIZE (BYTES) │ LAST MODIFIED │ ├─────────────────────────────┼──────────────┼───────────────────────────────┤ │ devlogs_2024-09-20T12_40_00 │ 13606281 │ Fri, 20 Sep 2024 12:47:01 UTC │ │ devlogs_2024-09-22T07_31_00 │ 175939085 │ Sun, 22 Sep 2024 08:58:12 UTC │ └─────────────────────────────┴──────────────┴───────────────────────────────┘.
-
Step 2: Use the command sedo object-store get onc-torch-service-dev-log-data-archives/devlogs_2024-09-20T12_40_00 to download from the current directory. devlogs_2024-09-20T12_40_00 is the file name list taken from the Step 1 output.
-
Step 3: You can download the file to the local system.
Audit and debug logs details
Details about audit and debug logs details.
Benefits of logs enhancement
Log enhancements help in:.
|
Benefit |
Description |
|---|---|
|
Organized Log Management |
Clear categorization and sub tab structure for easy navigation. |
|
Enhanced Usability |
Pagination, filters, and export options improve user experience. |
|
Efficient Retention |
Automated scheduling and archiving ensure logs are retained and managed effectively. |
|
User Access Control |
Different permissions for admin or internal users and readonly or supervisor users enhance security and control. |
|
Comprehensive Logging |
Detailed logging for various operations ensures thorough tracking and auditing. |