This section explains Cisco Optical Network Controller topology, including topology views, node options, alarm severity indicators, OTS links, and OTN span utilization. Use it to interpret topology information.
Cisco Optical Network Controller topology is a Cisco Optical Network Controller capability that
-
supports the related optical network management workflow,
-
provides context for configuration, monitoring, or troubleshooting tasks, and
-
helps operators understand how the feature behaves before they use it.
Cisco Optical Network Controller topology details
The Topology screen is an interactive screen which allows you to click on each node to fetch its information. The links between the nodes are the fiber links connecting each node. You can click on each fiber link to fetch its information when the OTS view is enabled. There can be multiple links connecting each node at any given point in time.
The Topology screen is responsible for maintaining and exposing the optical/OTN network topology for ONC, including:
-
Network devices (sites, nodes, interfaces).
-
Physical links (fiber spans, OMS/OTS/OTN links).
-
Optical protection groups.
-
OTDR configuration and SOR files.
-
Span-loss metrics and integration with PM flows.
Topology displays the network along with the nodes and the associated network links on a map. You can toggle between the Light and Dark modes to view this screen. You can zoom in zoom out the entire screen to view the network and its components. You can select the OTN, OMS or OTS layers as options in the display.
Layer segment buttons
The OTS option is used to show all fiber span between all type of nodes, OLT or ILA.
The OMS option is used to display only the ROADMs and the links between the ROADMs in the given network.
The OTN option is used to display the OTN links present between Transponders that support OTN, for example, NCS2K-400G-XP with card mode OTNXC.
Map control icons
Last time refreshedThe EDIT icon allows you to dynamically move any node to any Geo location on the screen. You can click on the RESET or SAVE button to reset or save the network status that is being displayed in the Topology screen anytime. Use the CENTER icon to position the map in the center.
The disconnected nodes are displayed with a cross mark. To cross launch to other related pages use the options appearing when you right click from anywhere on the map. You can click on the REFRESH button to refresh the Topology screen with the current status anytime.
Reload icon: This icon reloads the topology screen with the current status anytime.
Configurations icon: This icon provides these toggle switches.
-
Mute Acknowledged Alarms: Enable to mute the alarms.
-
Display Degree Descriptions: Enable to display the first character of the degree description configured in COSM for every node degree. If the description is missing, the degree number will be shown. When you hover over the node, a pop up displays the full description of the degree. To add a degree description:
-
Right-click the required node and select View in Nodal UI to cross-launch COSM.
COSM opens.
-
Select
-
Click Edit, change description and click Apply.
The degree description changes reflects in the topology view after a refresh.
For more information, see the Configuration Guide for Cisco Optical Site Manager.
Documentation icon: Opens the Cisco Optical Network Controller configuration guide.
Default view: The topology view zooms on the world map to show all the nodes by default. If you have a specific set of nodes that you are interested in, zoom and pan the map to the view that you want, and click Lock default view button to make it your default view. The default view persists across reloads and logins on the same browser. The default view shows the world map if there are no nodes. The topology view across Cisco Optical Network Controller shows the default view.
Eye icon: From R26.1.1, the topology view includes an eye icon that allows you to choose an SVO hosting map and submarine links map. This icon provide these check boxes.
-
Show SVO-LC Hosting Domain Groups: Displays the NCS 2000 nodes hosting SVO line cards. Click on the node to discover the domain groups associated to the same SVO line cards in HA. In the SVO domain groups view, the Domain Group Associations table appears displaying the Node Name, SVO-LC Name. In this map view, the Legends are updated with new icons such as circle (for nodes with one SVO line card) and pentagon (for nodes with more than one SVO line card).
Figure 1. Domain Group Associations 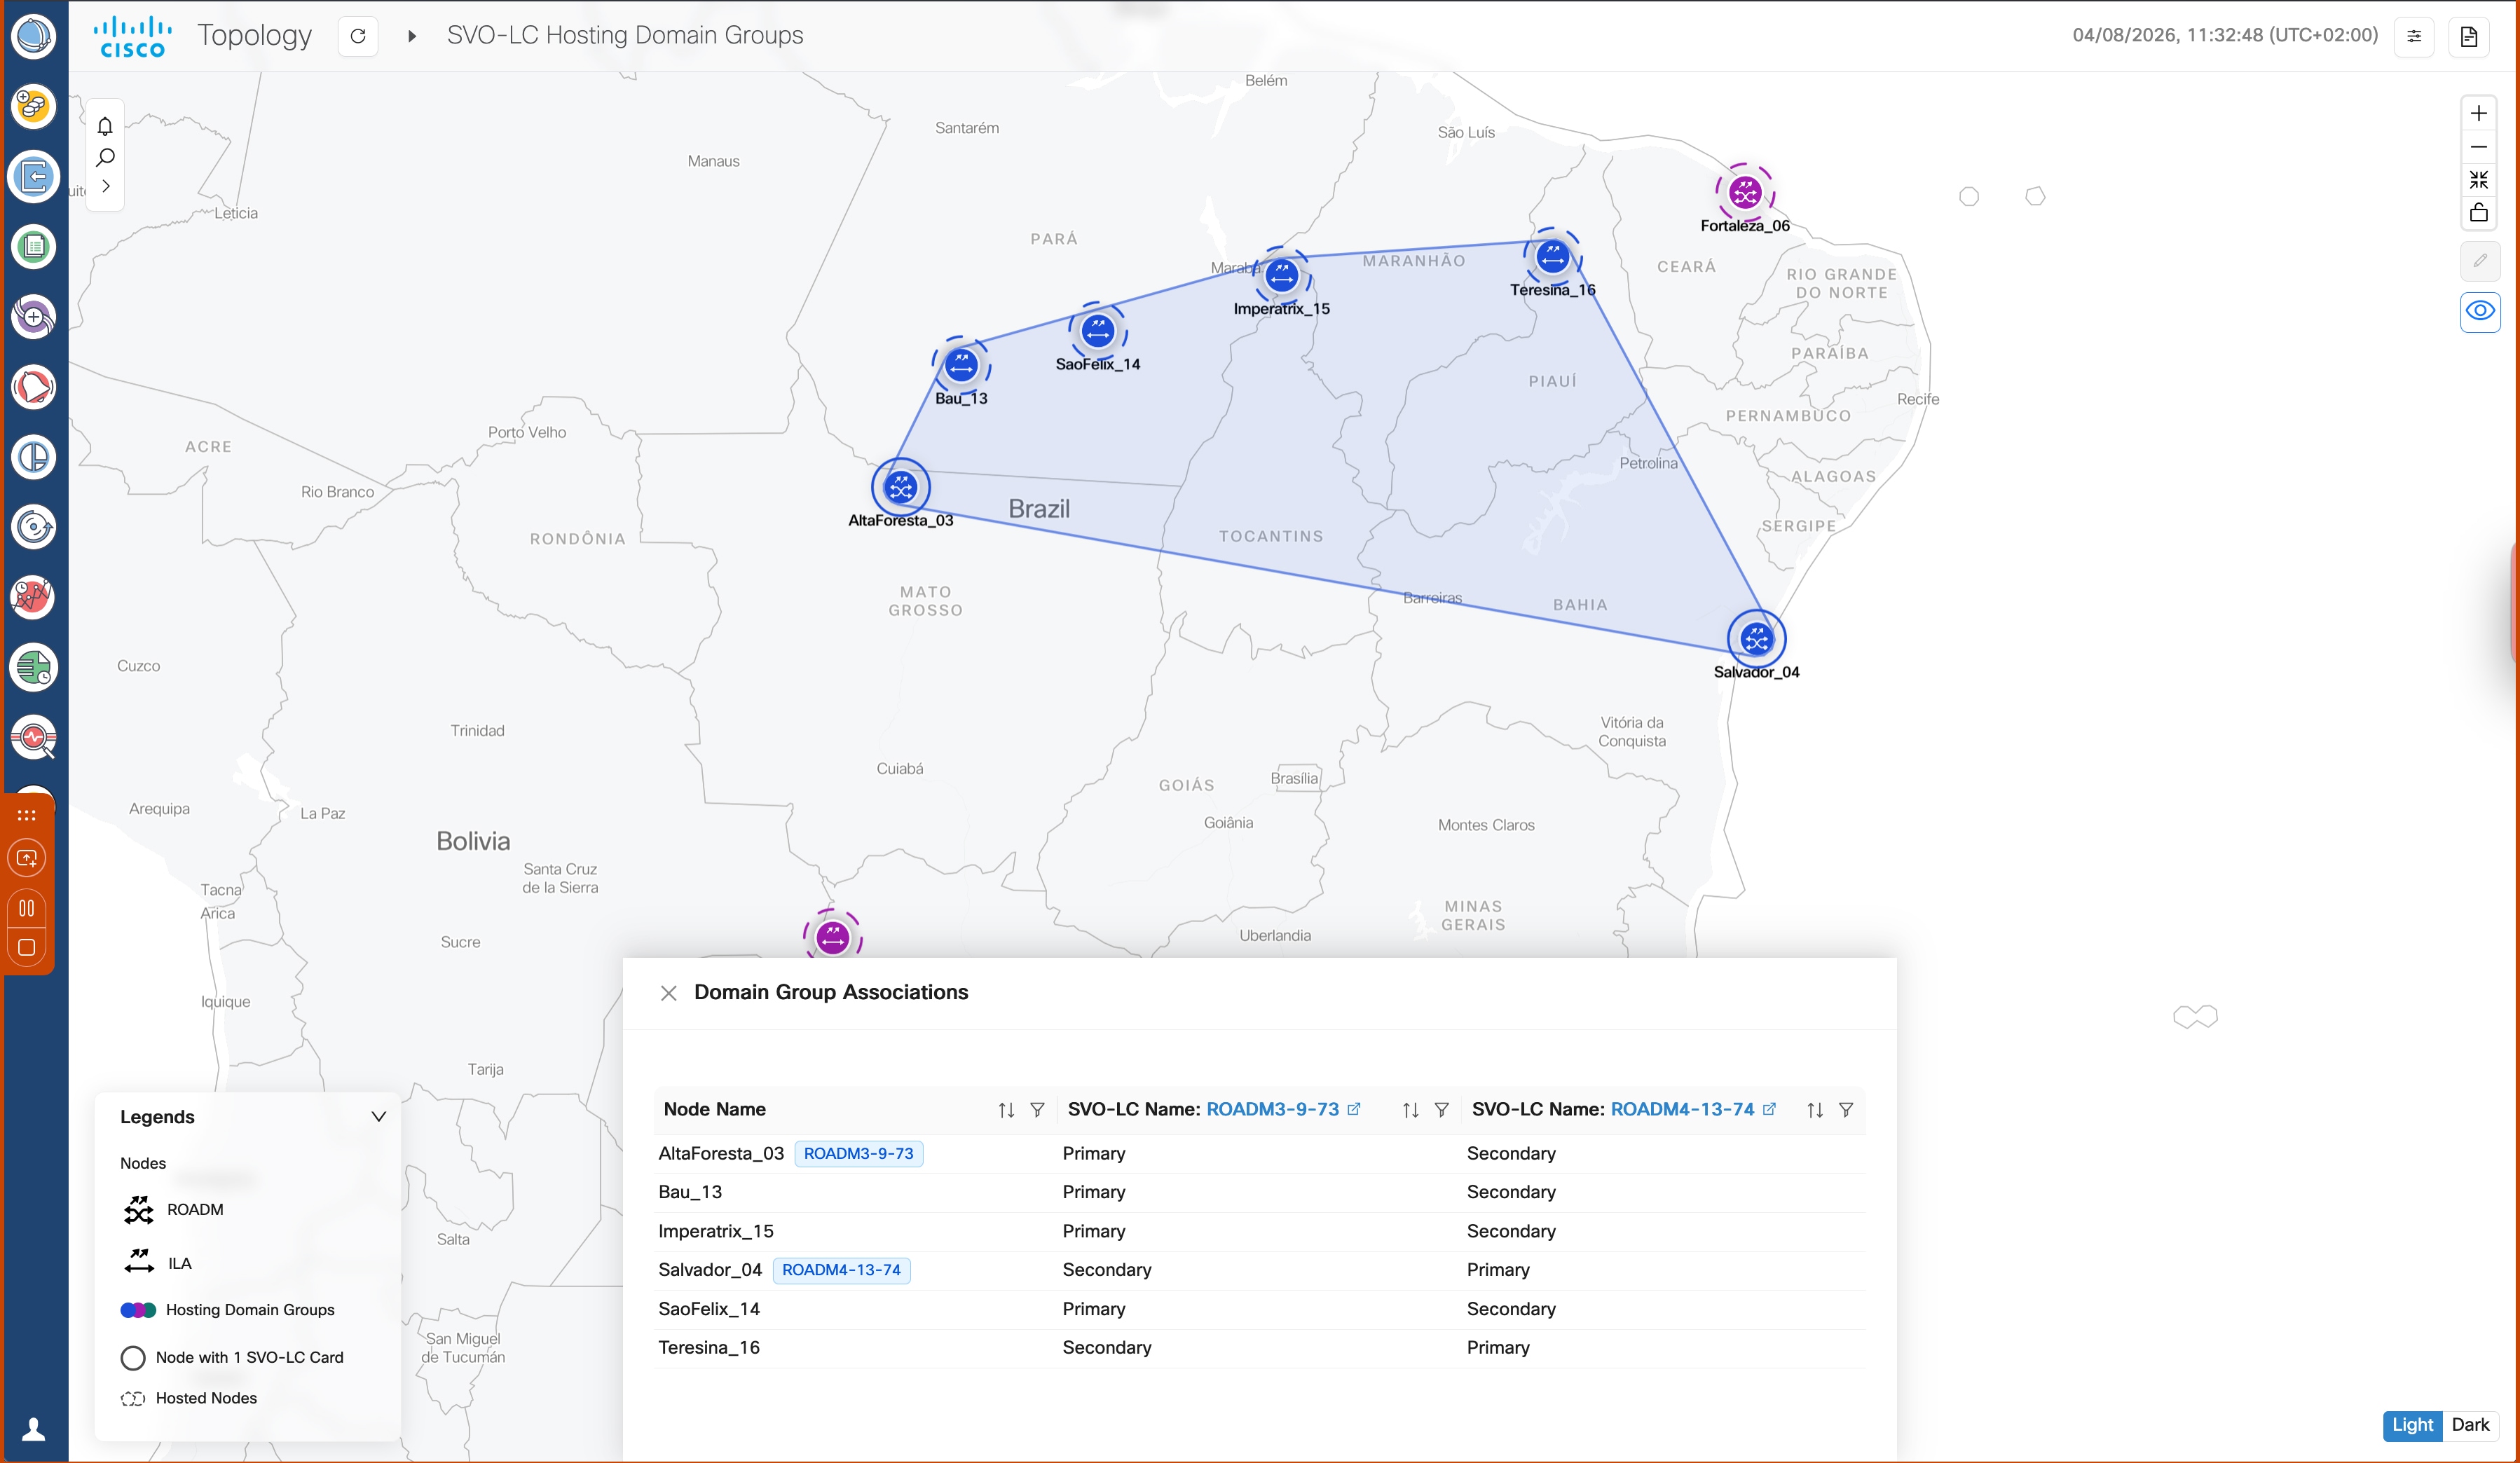
-
Filter Submarine Links: Displays the submarine connections.
Alarm severity bar
On the top of this screen, there is an alarms bar for displaying the different alarm types and the count of each type of alarm that are part of the network. The View Alarm hyperlink opens the Alarm app. The alarm types are color coded based on the types of severity as seen in the table below.
|
Alarm Type |
Description |
|---|---|
| RED |
Critical alarms are displayed in red color. |
| ORANGE |
Major alarms are displayed in orange color. |
| YELLOW |
Minor alarms are displayed in yellow color. |
Alarm severity type for any warning will appear as Warning and for cleared alarms they severity is displayed as Cleared.
In the Topology screen, the alarms reported at the top left are related to only those nodes that have the Geo location defined. Due to this there can be a discrepancy between the alarms reported in the Topology and the Alarms screen related to these nodes.
In the Topology screen only the critical, major and minor count alarms are reported, unlike the Alarms screen which reports the warnings or cleared alarms.
Use the Search nodes by name search bar to search for nodes in the topology network. This will fetch and locate the exact node in the map.
Individual node pop-up options
You can get the node name along with the COSM site name it belongs to and its current state by hovering over each node in the Topology map anytime.
-
Hover over a node and right click on it.
The pop-up options appear.
-
Select of the options: Resync, View in Node UI and View Alarms options.
|
Options |
Description |
|---|---|
| Resync |
Resync starts the resync of the selected node. |
| View in Node UI |
This option takes you to the COSM site from where you can view the node details. |
| View Alarms |
This option opens the Alarms application in a new tab, from where you can view all the alarms details. |
You can also view the information related to the different nodes, links, and the states of each node in the network at any point in time by clicking the Legends option. To select any node in the network, use the drop-down box to select the node.
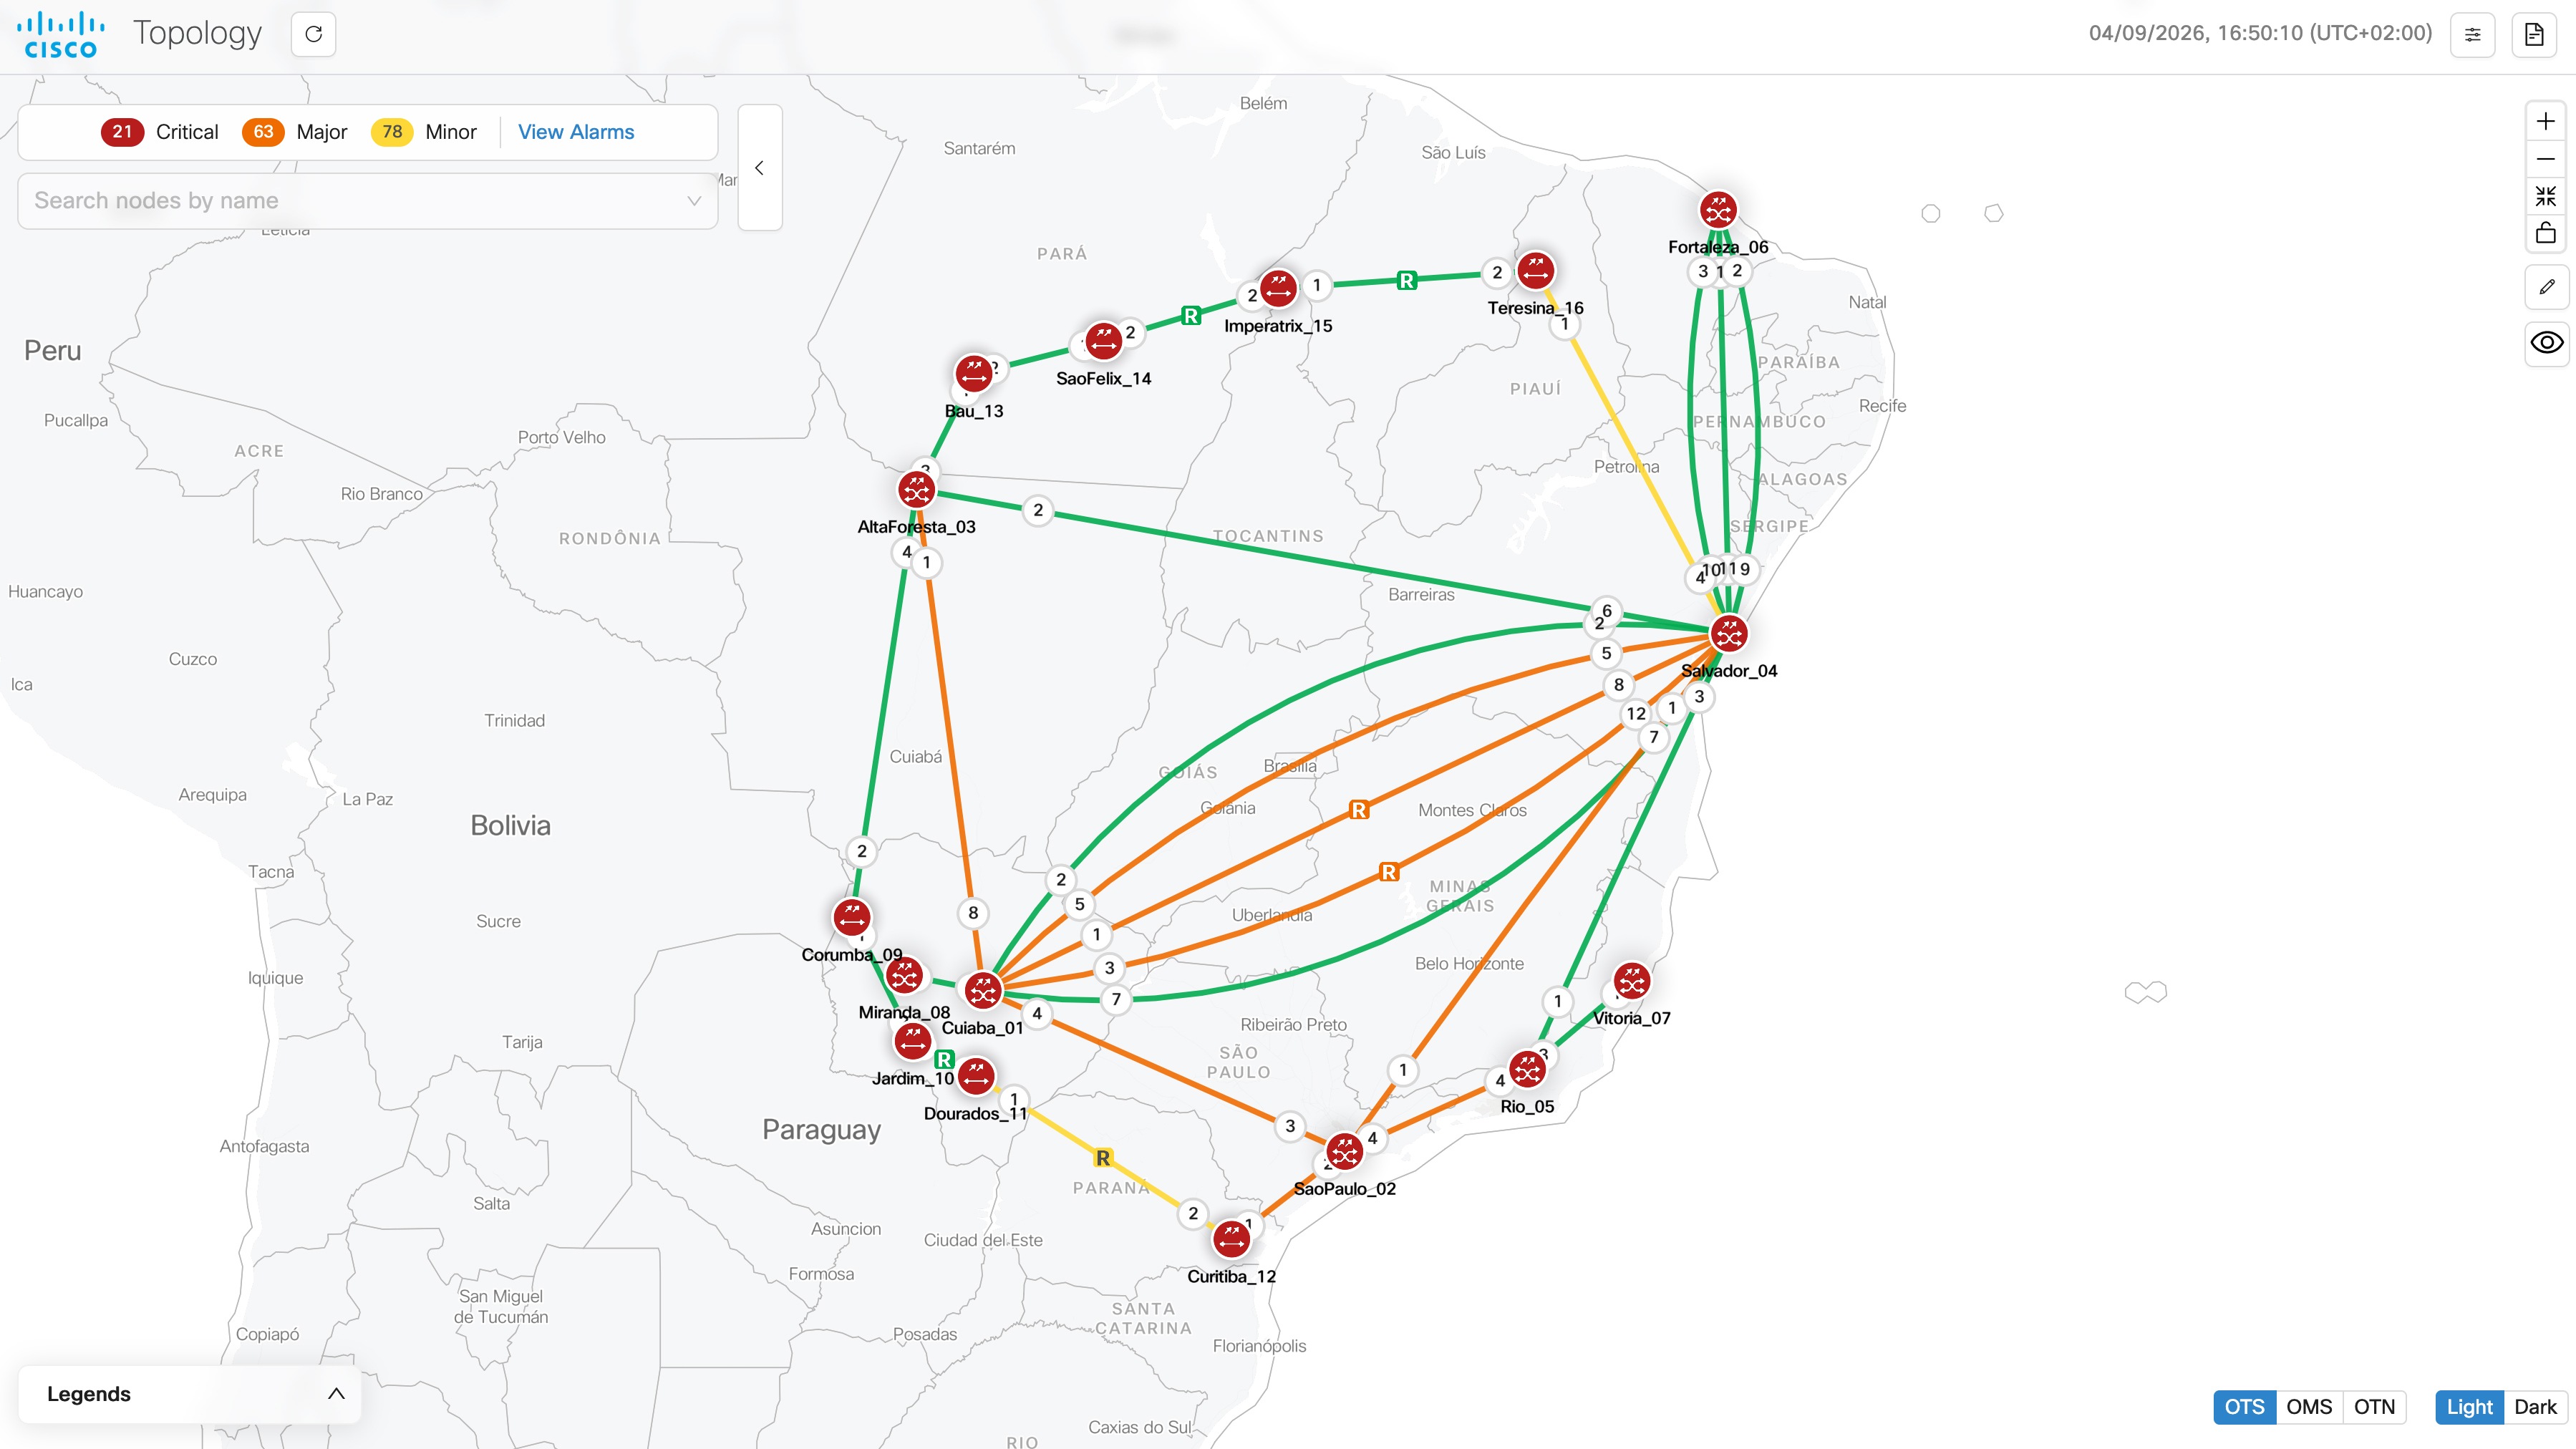
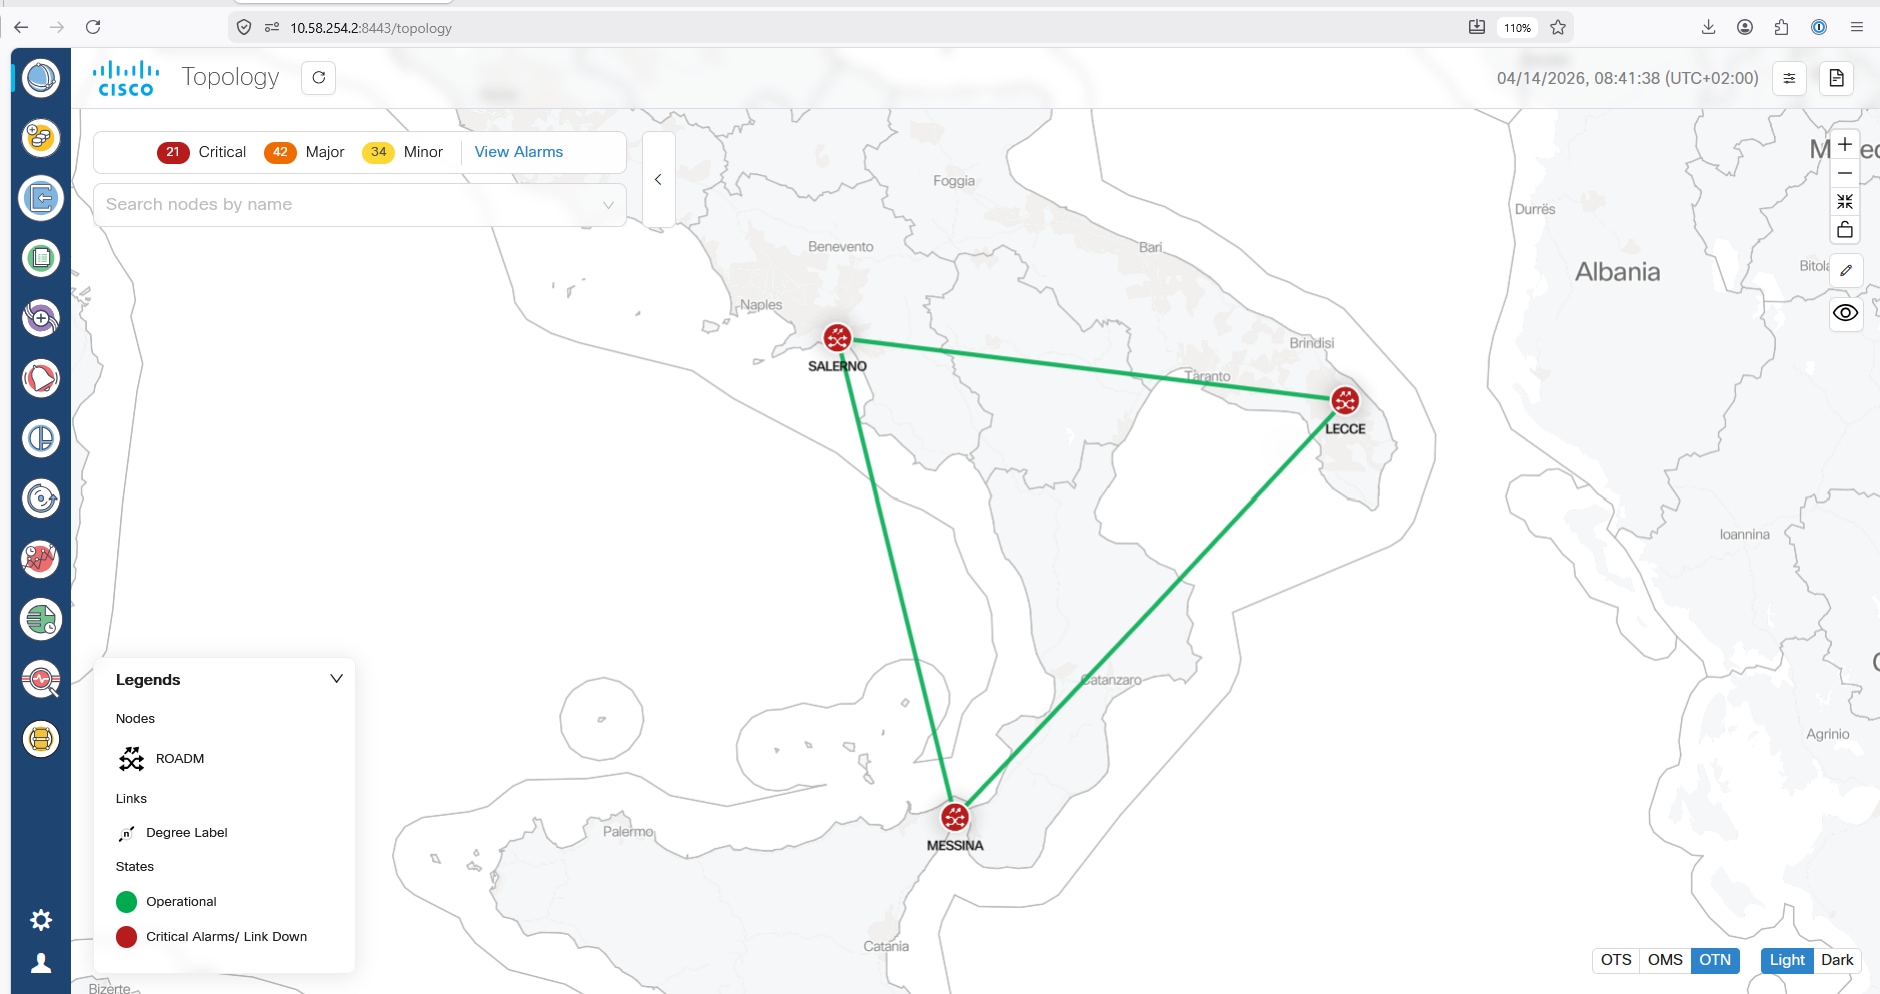
The links between each node in the network in the Topology map displays the degree numbers which can be right clicked to navigate to the particular Node UI. The 'R' in the link refers to Rama Amplified. This is not visible when you select the OMS layer option to view the map.
Click Legends in the bottom of the Topology screen to view the various representations used in the map as shown below.
Nodes: The different nodes that are part of the network at any given time.
Links: The different links between nodes along with the amplifier and degree labels.
States: The different states like operational, critical alarms, link down and minor alarms.
In the Topology map if two nodes have the same Geo location then they appear as a single node due to overlapping with each other which is a constraint.
If any node in the Topology screen does not have a Geo location specified, the button in the upper right corner which is used to enter the Geo location value displays an orange highlight or dot. This orange dot is used to represent that there is at least one node which does not have any Geo location specified. When you click this orange dot a pop-up menu appears displaying all such nodes that are lacking Geo locations. Click the Edit icon and then select any node to move it to any desired location om the map. This will add the Geo locations to the node. You can move the node and the Topology maps the Geo location automatically for these node based on the location.
Once the Geo location is selected, Cisco ONC displays a message to indicate that the Topology has been updated and to view the updated changes you must refresh the page by clicking the Refresh or Reload button.
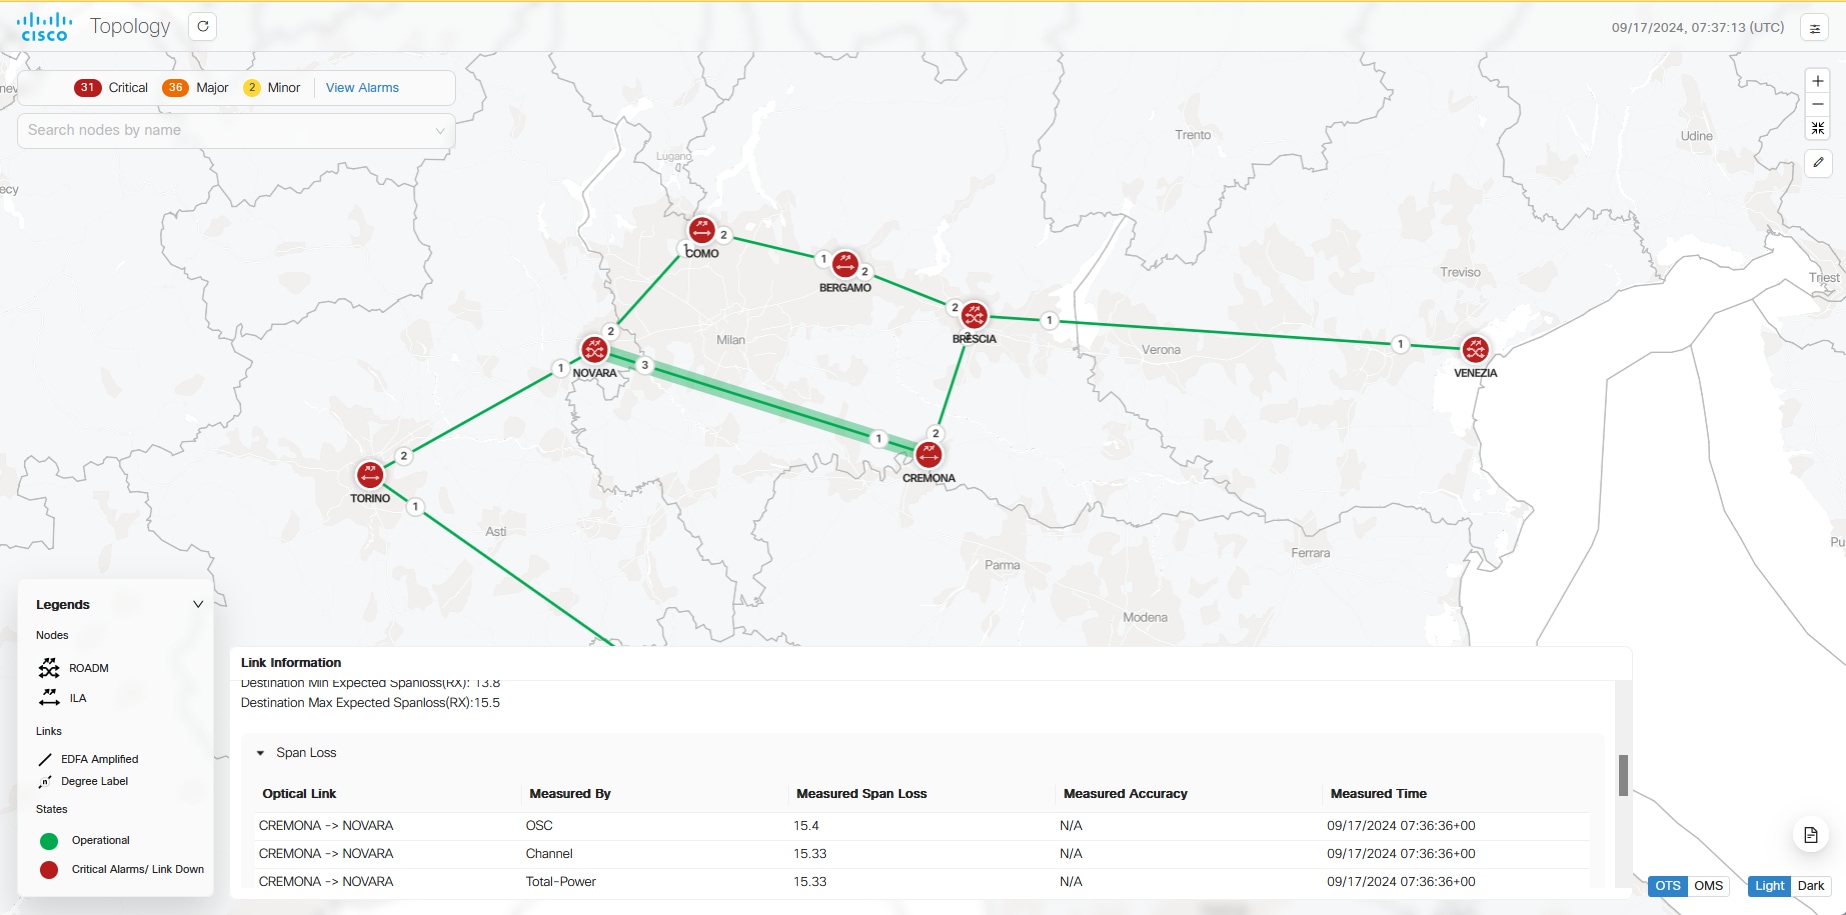
From Cisco Optical Network Controller 24.3.1 release onwards, fiber information and span loss details are added newly to the Topology live PM tool tip. When you click on the fiber span link in the map, you will see the following details appearing in the tool tip information:
-
Fiber Type: The type of fiber link.
-
Length: The length of the fiber link.
-
Source Min Expected Spanloss: Source node's minimum expected span loss value.
-
Source Max Expected Spanloss: Source node's maximum expected span loss value.
-
Destination Min Expected Spanloss: Destination node's minimum expected span loss value.
-
Destination Max Expected Spanloss: Destination node's maximum expected span loss value.
-
Span Loss: Span loss table.
Check span utilization summary for OTN links
-
In the left panel, click the Links app.
-
Go to the OTN tab and click the required OTN link.
Figure 4. Links app 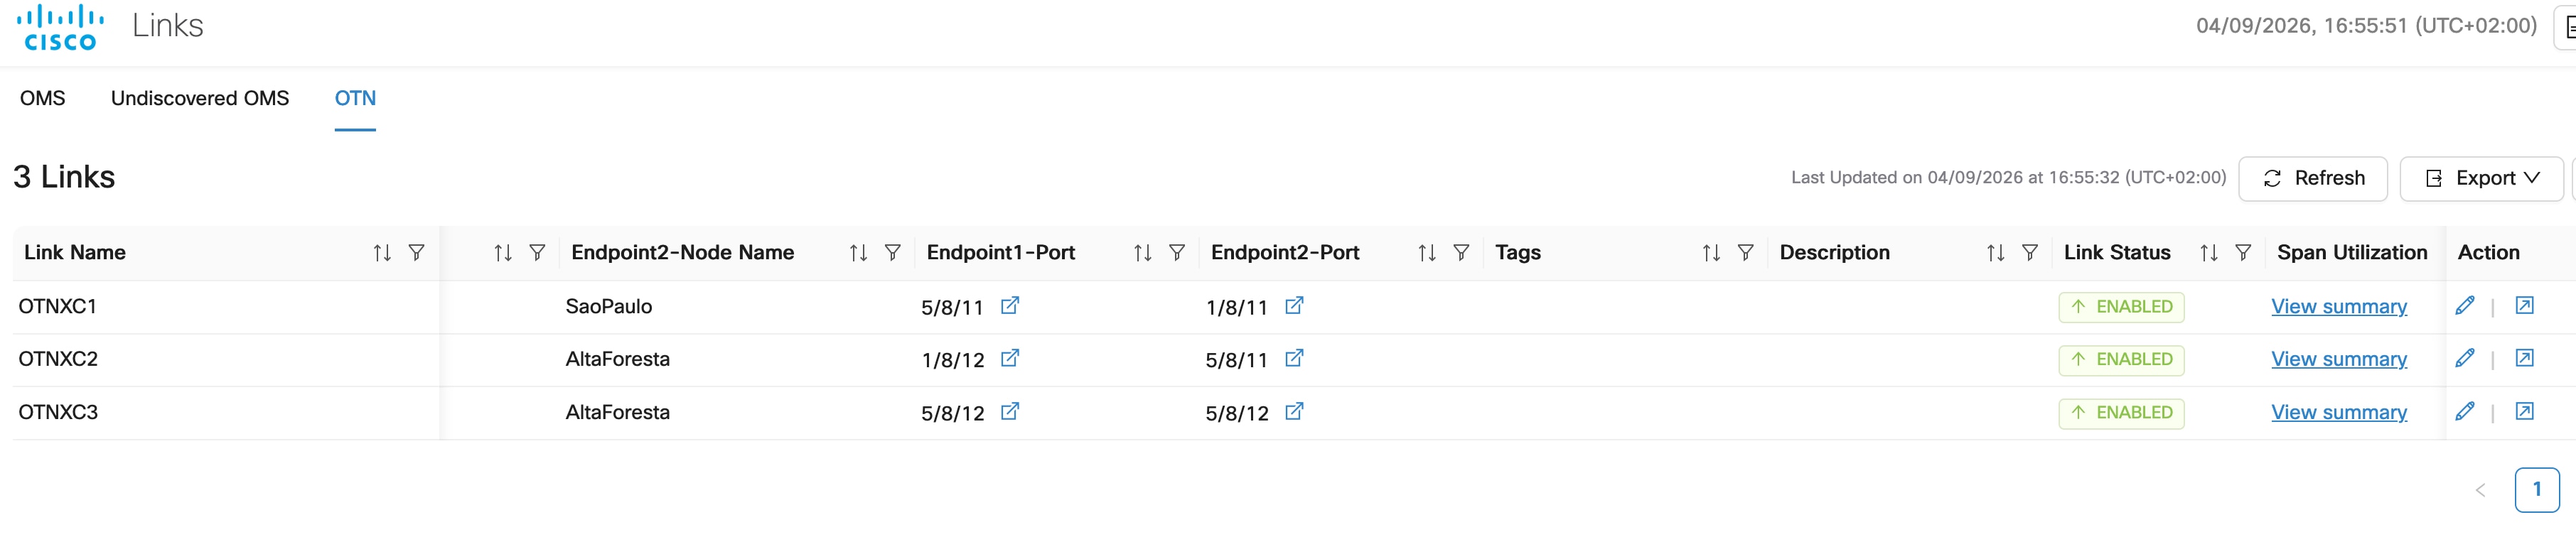
-
Click View summary to open Span Utilization Summary for the selected OTN link.
Figure 5. Span utilization summary in Topology screen 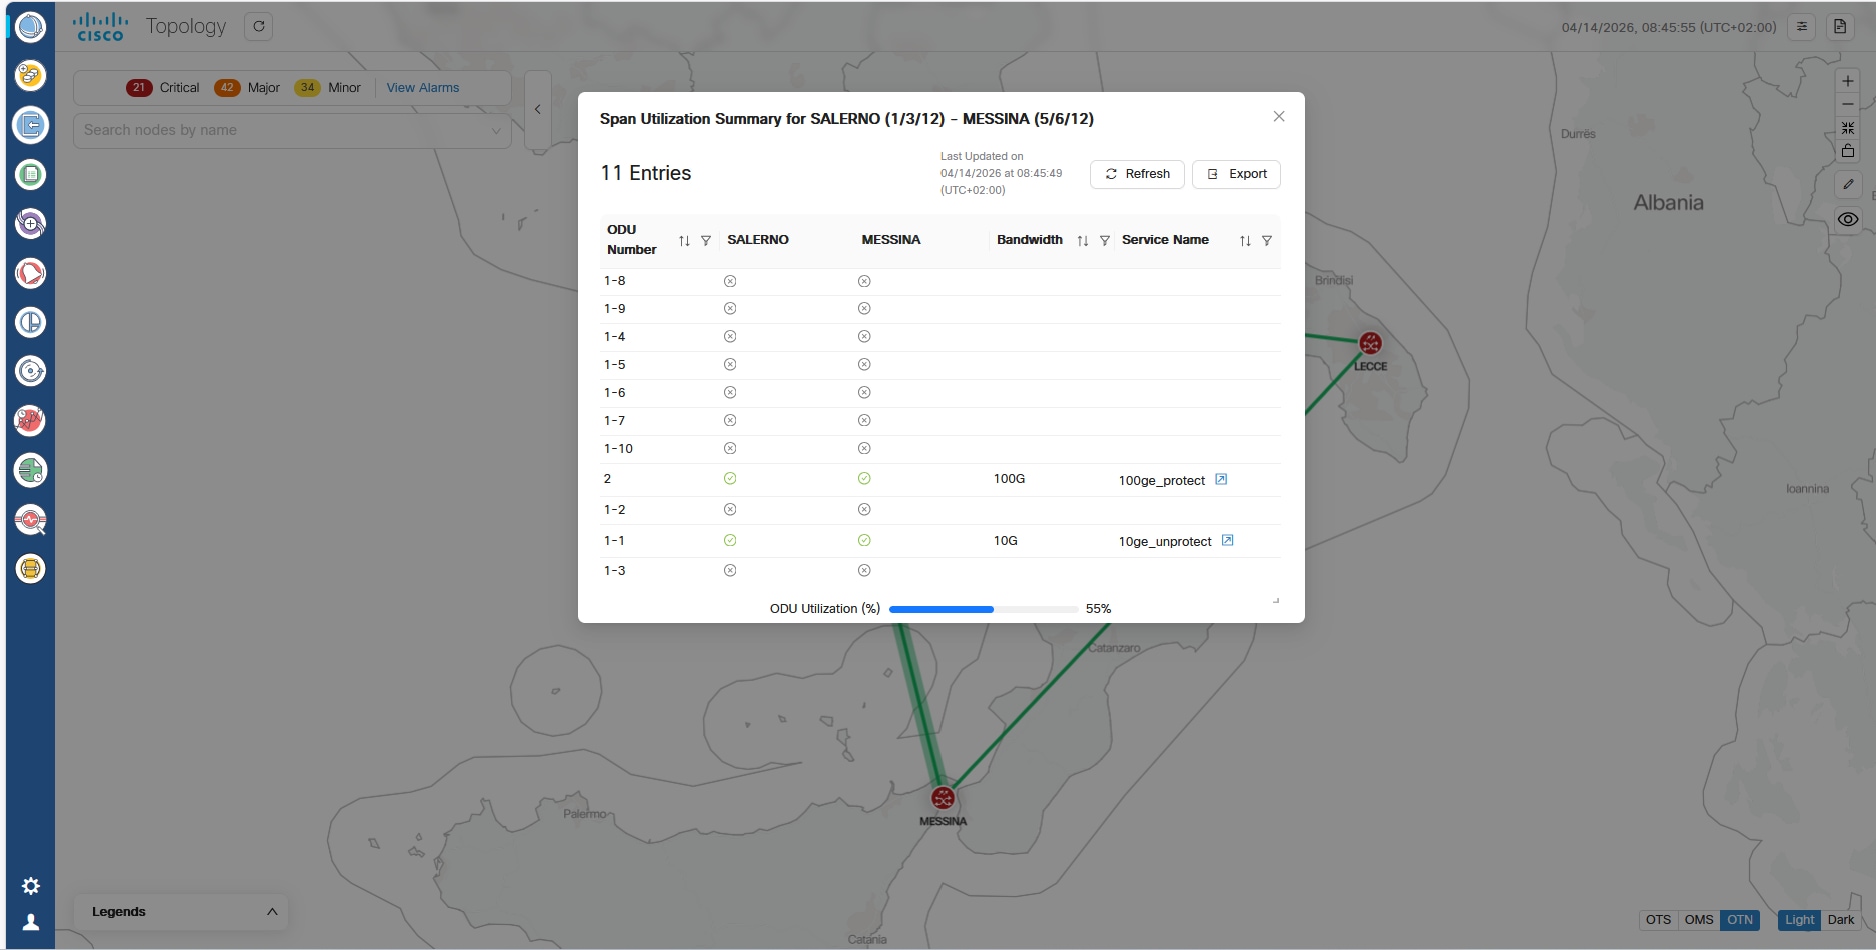
In this summary, these parameters appear:
-
ODU Number
-
Source endpoint
-
Destination endpoint
-
Bandwidth
-
Service Name for all ODU connection present.
ODU Utilization (%) in percentage is also available with respect to total bandwidth available in OTN-link.
-
-
(Optional) Click Export to export the ODU span utilization table in an Excel.
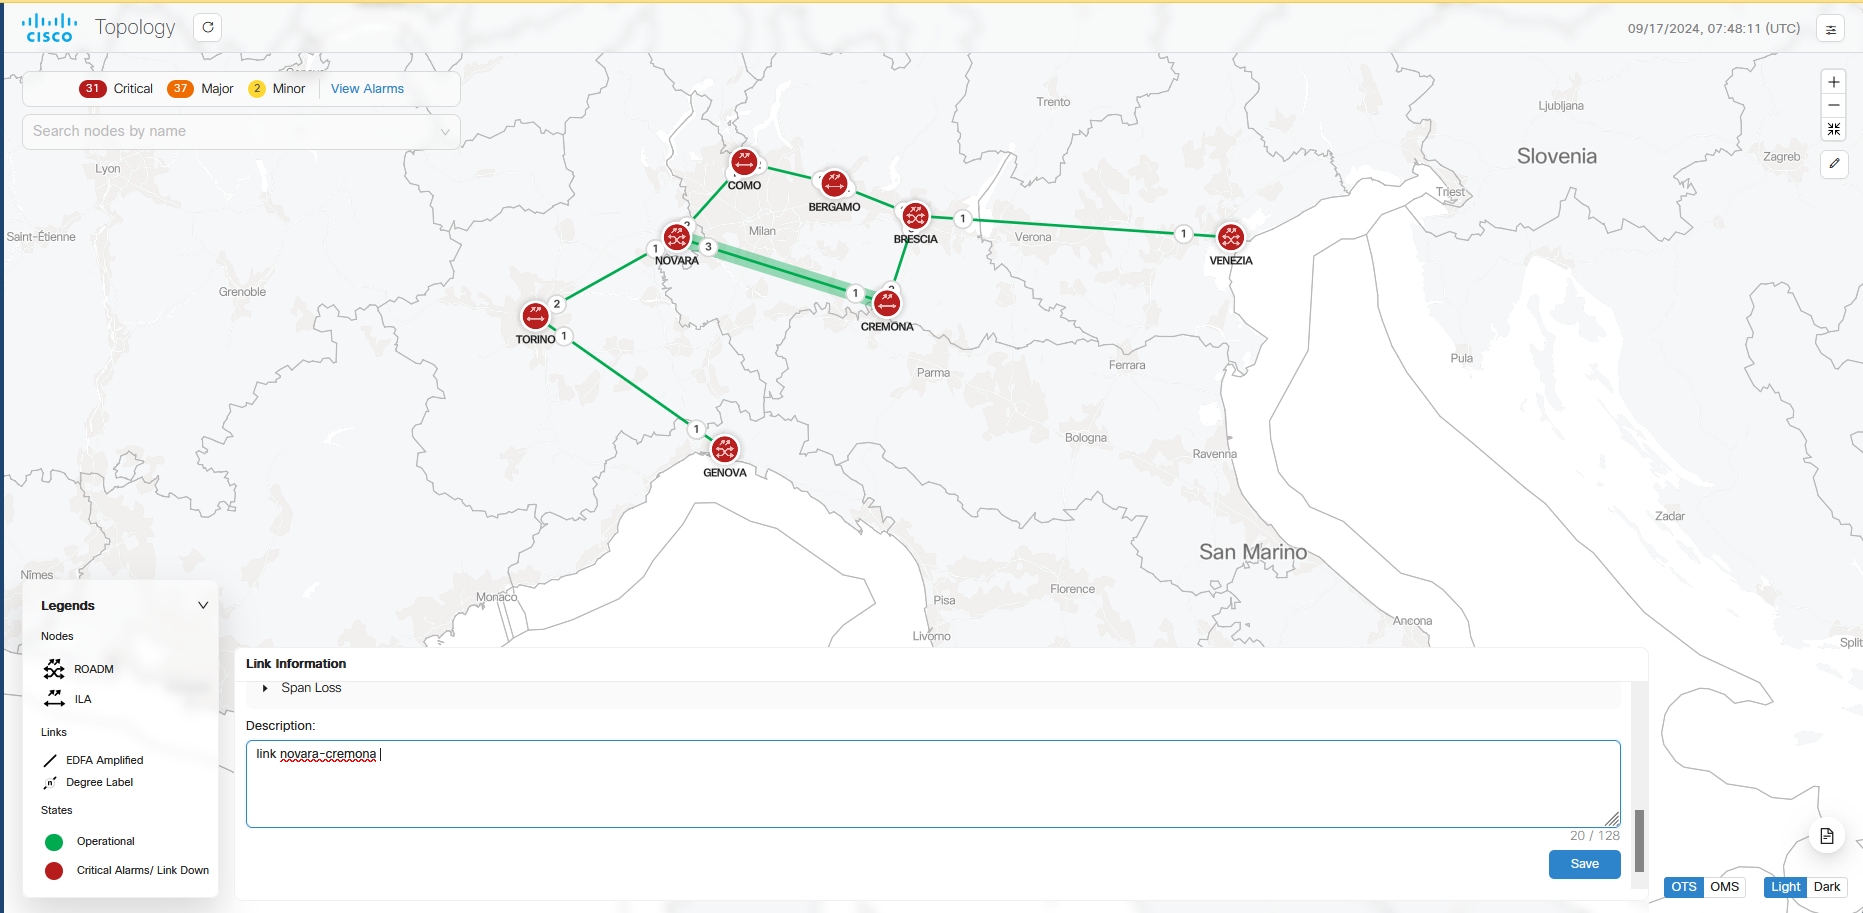
On Topology tool tip information, it is possible to add a description and save.