- Preface
- Basic Functionality
- Basic Configurations
- Configuring System
- Configuring Green Ethernet
- Configuring Thermal Protection
- Configuring Ports
- Configuring Security
- Configuring Aggregation
- Configuring Link OAM
- Configuring Loop Protection
- Configuring Spanning Tree
- Configuring MVR
- Configuring LLDP
- Configuring SyncE
- Configuring EPS
- Configuring MEP
- Configuring ERPS
- Configuring MAC Table
- Configuring VLANs
- Configuring VLAN Translation
- Configuring Ethernet Services
- Configuring Performance Monitor
- Configuring QoS
- Configuring HQoS
- Configuring Mirroring
- Configuring PTP
- Configuring sFlow
- Configuring Traffic Test
- Configuring Traffic Test Loops
- Configuring DDMI
- Configuring UDLD
- Configuring Flex Links
- Monitoring System
- Monitoring Green Ethernet
- Monitoring Thermal Protection
- Monitoring Ports
- Monitoring Link OAM
- Monitoring Security
- Monitoring Aggregation
- Monitoring Loop Protection
- Monitoring Spanning Tree
- Monitoring MVR
- Monitoring LLDP
- Monitoring Ethernet Services
- Monitoring Performance Monitor
- Monitoring PTP
- Monitoring MAC Table
- Monitoring VLANs
- Monitoring sFlow
- Monitoring DDMI
- Monitoring UDLD
- Monitoring Flex Links
- Diagnostics
- Maintenance
- Use Cases
Monitoring
System
The System feature available on the ME 1200 Web GUI allows you to monitor your computer's configuration information.
- System Information
- System LED Status
- CPU Load
- IP Status
- System Log Information
- Detailed System Log Information
- System Power Supply Status
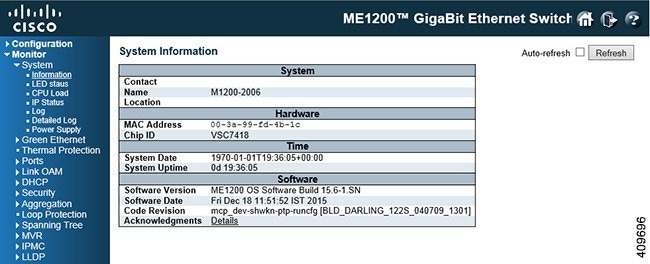
System Information
-
Contact: The system contact configured in.
-
Name: The system name configured in.
-
Location: The system name configured in.
-
MAC Address: The MAC Address of this switch.
-
Chip ID: The Chip ID of this switch.
-
System Date: The current (GMT) system time and date. The system time is obtained through the Timing server running on the switch, if any.
-
System Uptime: The period of time the device has been operational.
-
Software Version: The software version of this switch.
-
Software Date: The date when the switch software was produced.
-
Code Revision: The version control identifier of the switch software.
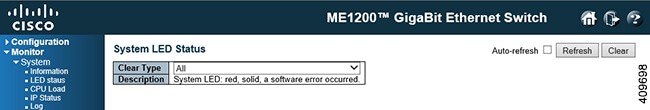
System LED Status
CPU Load
This option displays
the CPU Load of your system using an SVG graph.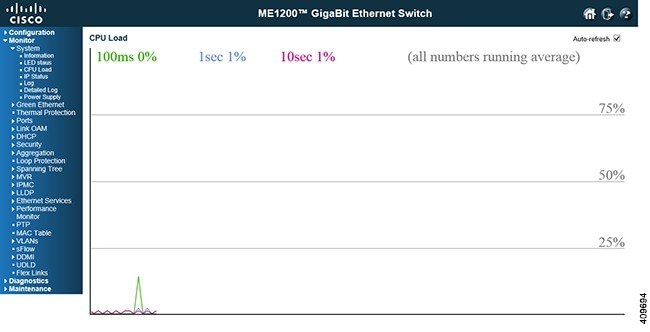
The load is measured as averaged over the last 100ms, 1sec and 10 seconds intervals. The last 120 samples are graphed, and the last numbers are displayed as text as well.
 Note | In order to display the SVG graph, your browser must support the SVG format. Consult the SVG Wiki for more information on browser support. Specifically, at the time of writing, Microsoft Internet Explorer will need to have a plugin installed to support SVG. |
IP Status
This option displays
the status of the IP protocol layer. The status is defined by the IP
interfaces, the IP routes and the neighbour cache (ARP cache) status.
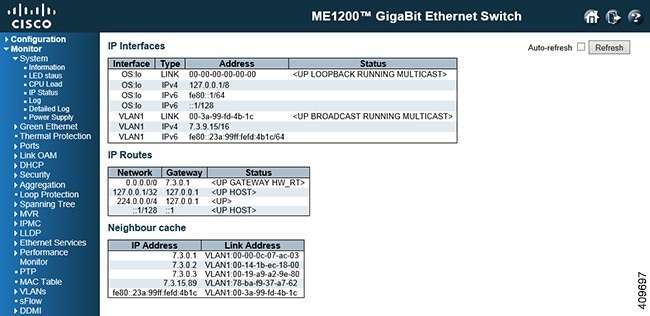
IP Interfaces
| Interface | The name of the interface. |
| Type | The address type of the entry. This may be LINK or IPv4. |
| Address | The current address of the interface. |
| Status | The status flags of the interface (and/or address). |
Click Add Interface to add and configure an IP Interface.
IP Routes
| Network | The destination IP network or host address of this route |
| Gateway | The gateway address of this route. |
| Status | The status flags of the route |
Click Add Route to add and configure an IP Route.
Neighbour cache
| IP Address | The IP address of the entry. |
| Link Address | The Link(MAC)address for which a binding to the IP address given exist. |
System Log Information
This option allows you
to view the switch system log information.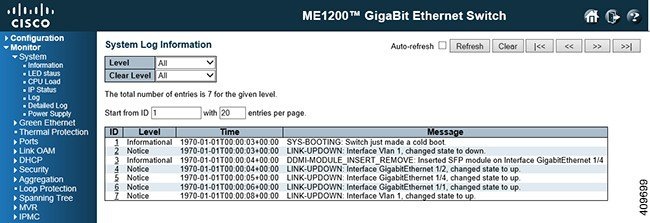
Navigating the System Log Information Table
Each page shows up to 999 table entries, selected through the entries per page input field. When first visited, the web page will show the beginning entries of this table. The Level input field is used to filter the display system log entries. The Clear Level input field is used to specify which system log entries will be cleared. To clear specific system log entries, select the clear level first then click the Clear button.
The Start from ID input field allow the user to change the starting point in this table. Clicking the Refresh button will update the displayed table starting from that or the closest next entry match. In addition, these input fields will upon a Refresh button click - assume the value of the first displayed entry, allowing for continuous refresh with the same start input field.
The >> will use the last entry of the currently displayed table as a basis for the next lookup. When the end is reached the text No more entries is shown in the displayed table. Use the << button to start over.
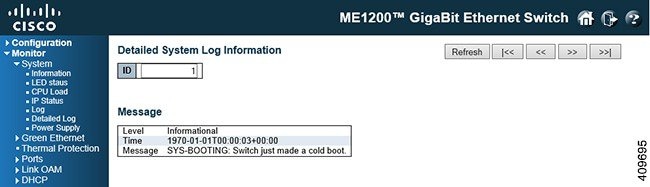
Detailed System Log Information
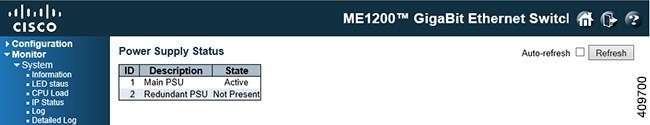
System Power Supply Status
 Feedback