Cisco Security Cloud Control: Secure Firewall ASA Management

PDF

Cisco Security Cloud Control: Secure Firewall ASA Management

Troubleshoot a Secure Event Connector

Want to summarize with AI?

Log in

Learn how to troubleshoot Secure Event Connector issues, including onboarding and registration failures, NSEL data flows, event logging problems, inactive SEC status, missing events, host removal, and health checks.


If none of the scenarios described below match your issue, open a case with Cisco Technical Assistance Center (TAC) for further assistance.
Troubleshoot SEC Onboarding Failures

The troubleshooting scenarios describe a variety of symptoms associated with Secure Event Connector (SEC) onboarding and operational failures. Use this topic to identify and resolve the issue impacting your deployment.

SEC onboarding failed

Symptom: SEC onboarding failed.

Repair: Remove and onboard the SEC again.

Tip

Always use the copy link to copy the bootstrap data when on-boarding an SEC.

Note

If this procedure does not correct the problem, gather the troubleshooting logs and contact your Managed Service Provider or the Cisco Technical Assistance Center.

Downloading, decoding, or extracting bootstrap data failed

Messages:

  • [Error] Downloading the bootstrap package failed.

  • [Error] Extracting the bootstrap package failed.

  • [Error] Max retries exceeded for bootstrap download.

Diagnosis: Decoding bootstrap data failed.

Repair:

  • Wait briefly and retry the bootstrap operation.

  • Add a new SEC in the UI and attempt to bootstrap the new one instead.

Adequate CPU and memory not available

Message: [Error] Secure Event Connector minimum system requirements not met.

 [sdc@localhost ~]$ /usr/local/cdo/toolkit/sec.sh setup 
[2020-06-10 04:37:26] ERROR unable to setup Secure Event Connector, minimum 4 cpus and 8 GB ram required, exiting. 

Diagnosis: Adequate CPU and memory not available.

Repair: Increase the resources of your virtual machine to meet the minimum required specifications.

Host already has an SEC

Message: [Error] This host currently has an SEC enabled for the same tenant. Please remove the SEC before trying to bootstrap it again.

Diagnosis: SEC already running.

Repair: Ensure that there is no existing operational SEC in your environment. If one is present but not operational, remove it and then re-bootstrap the SEC.

Note

Ensure that you are removing an active SEC. This error message can occur when a bootstrap progresses far enough for the system to assume normal operation but fails to fully complete. As a result, it is possible that a bootstrap error is causing this situation.

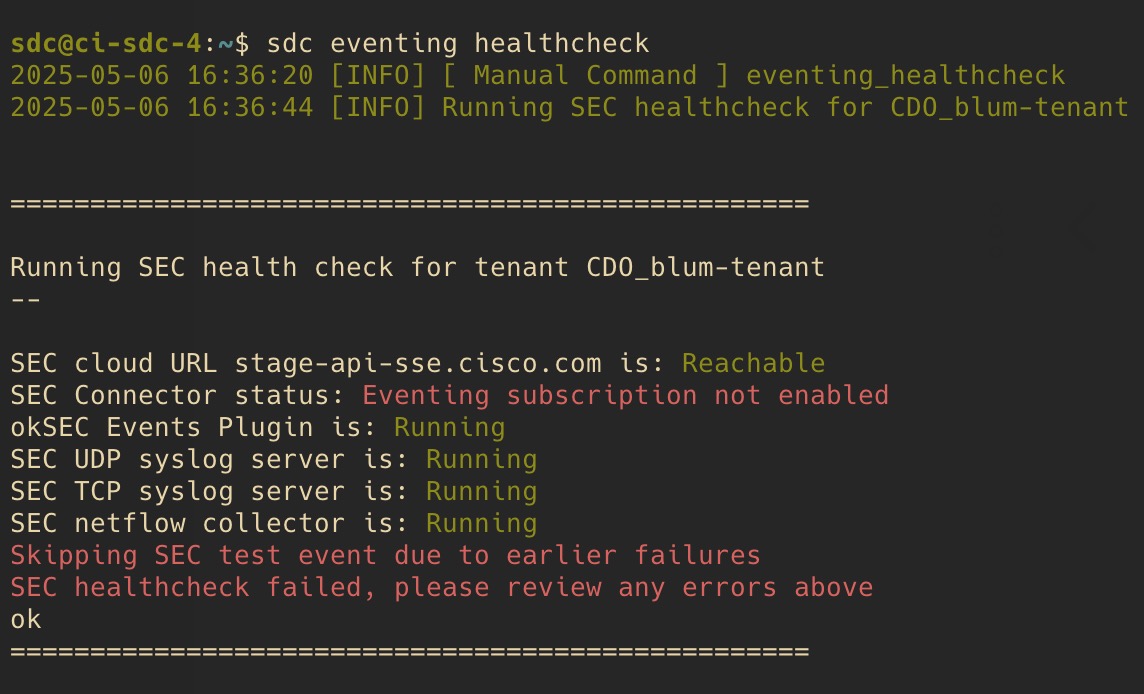
To confirm, run the command sdc eventing healthcheck. If the health check reports all green, it indicates that the SEC is active and functioning properly. In such a case, removing it would disrupt an operational SEC.

Contact Security Cloud Control Support

If none of the scenarios described above match your issue, open a case with Cisco Technical Assistance Center.


Troubleshoot Secure Event Connector Registration Failure

Symptom: Registration of Cisco Secure Event Connector to cloud eventing service fails.

Diagnosis: These are the most common reasons that the SEC fails to register to the eventing cloud service.

  • The SEC is unable to reach the Eventing cloud service from SEC

    Repair: Ensure that Internet is accessible on port 443 and DNS is configured correctly.

  • Registration failure due to invalid or expired one-time-password in SEC bootstrapdata

    Repair:

Procedure

1.

SSH to the host VM as the admin user, typically cdo.

2.

Switch to the sdc user usingthe command: sudo su - sdc.

3.

View the connector log by running command sdc eventing logs --type connector.

Note

If the registration has failed due to an invalid token, you see an error message in the log file similar to the example below:

context:(*contextImpl).handleFailed] registration - CE2001: Registration failed - Failed to register the device because of invalid token. Retry with a new valid token.

4.

Remove the SEC.

5.

Add a new SEC in the UI and re-onboard.


Troubleshooting network problems using Security and Analytics Logging events

Here is a basic framework you can use to troubleshoot network problems using the Events Viewer.

This scenario assumes that your network operations team has had a report that a user can't access a resource on the network. Based on the user reporting the issue and their location, the network operations team has a reasonable idea of which firewall controls their access to resources.

Note

This scenario also assumes that an FDM-managed device is the firewall managing the network traffic. Security Analytics and Logging does not collect logging information from other device types.

Procedure

1.

From the Security Cloud Control Home page, click Firewall.

2.

In the left pane, click Events & Logs > Events > Event Logging.

3.

Click the Historical tab.

4.

Start filtering events by Time Range. By default, the Historical tab shows the last hour of events. If that is the correct time range, enter the current date and time as the End time. If that is not the correct time range, enter a start and end time encompassing the time of the reported issue.

5.

Enter the IP address of the firewall that you suspect is controlling the user's access in the Sensor ID field. If it could be more than one firewall, filter events using attribute:value pairs in the search bar. Make two entries and combine them with an OR statement. For example: SensorID:192.168.10.2 OR SensorID:192.168.20.2.

6.

Enter the user's IP address in the Source IP field in the Events filter bar.

7.

If the user can't access a resource, try entering that resource's IP address in the Destination IP field.

8.

Expand the events in the results and look at their details. Here are some details to look at:

  • AC_RuleAction - The action taken (Allow, Trust, Block) when the rule was triggered.

  • FirewallPolicy - The policy in which the rule that triggered the event resides.

  • FirewallRule - The name of the rule that triggered the event. If the value is Default Action then it was the default action of the policy that triggered the event and not one of the rules in the policy.

  • UserName - The user associated with the initiator IP address. The Initiator IP address is the same as the Source IP address.

9.

If the rule action is preventing access, look at the FirewallRule and FirewallPolicy fields to identify the rule in the policy that is blocking access.


Event Logging Troubleshooting Log Files

The Secure Event Connector troubleshooting command collects logs, configurations, and limited system information, compressing them into a single archive to simplify the diagnosis of issues. If you already have a TAC case open, the compressed archive can also be sent directly to your TAC representative.

  1. SSH to your host using the admin account, typically cdo.

  2. Switch to the SDC user using the command sudo su - sdc

  3. If you do not have a TAC case open: Run the command to gather and compress the troubleshooting bundle:

    sdc eventing troubleshoot

  4. If you already have a TAC case open: Request an upload token from your TAC representative and use the command to gather, compress, and upload the troubleshooting bundle directly to your case:

    sdc eventing troubleshoot --case-number [your-tac-case-number] --token [the-token-tac-provided]

  5. If you prefer to retrieve the troubleshooting bundle manually, use SCP or SFTP. Locate the absolute path to the bundle provided in the last log entry after running the troubleshoot command. Then, use the following SCP command to download the bundle to your local machine:

    scp -P [22 or whichever port you SSH on]
            cdo@your-vm-ip:/opt/cdo/.cdo/troubleshooting/cdo_[tenant-name-here]
            -troubleshooting-[timestamp-here].tar.gz ./sec-troubleshooting-bundle.tar.gz
    Note

    Replace /opt/cdo/.cdo/troubleshooting/cdo_\[tenant-name-here\]-troubleshooting-\[timestamp-here\].tar.gz with the actual path displayed in the log output.

    If you want to decompress the archive to review the logs and system configurations, use the command: tar xvf ./[sec-troubleshooting-bundle-filename].tar.gz


SEC Status is Inactive in Security Cloud Control

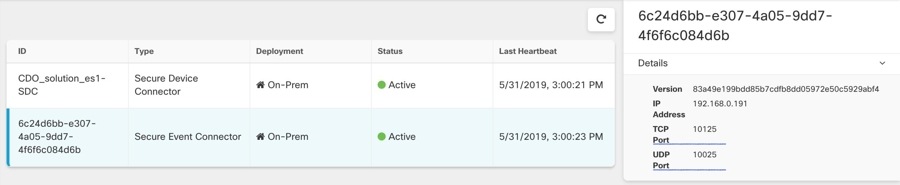
Symptom: The Secure Event Connector status shows "Inactive" in the Security Cloud Control Secure Connectors page after onboarding for one of these reasons:

  • Heartbeat failed

  • Connector registration failed

Repair:

  • Heartbeat failed: Request SEC heartbeat and refresh Secure Connector page to see if the status changes to "Active", if not check if the Secure Device Connector registration failed.

  • Connector registration failed: Refer issue Troubleshooting SEC Registration Failure.


The SEC is online, but there are no events in Security Cloud Control Event Logging Page

Symptom: The Secure Event Connector shows "Active" in Security Cloud Control Secure Connectors page but you do not see events in Security Cloud Control Event viewer.

Solution or workaround:

Procedure

1.

SSH to your host using the admin account, typically cdo.

2.

Switch to the SDC user with the command sudo su - sdc.

3.

Perform the following checks:

INFO success: estreamer-connector entered RUNNING state, process has stayed up for > than 1 seconds

INFO success: estreamer-plugin entered RUNNING state, process has stayed up for > than 1 seconds

INFO success: estreamer-rsyslog entered RUNNING state, process has stayed up for > than 1 seconds

  • Ensure that the firewall rules on the on-premise SDC are not blocking the UDP and TCP ports shown for the SEC on the Secure Connectors page.

  • If you have setup SDC manually using a CentOS 7 VM of your own and have the firewall configured to block incoming requests, you could execute the following commands to unblock the UDP and TCP ports:

firewall-cmd --zone=public --add-port=<udp_port>/udp --permanent

firewall-cmd --zone=public --add-port=<tcp_port>/tcp --permanent

firewall-cmd --reload

  • Using Linux network tools of your choice, check if packets are being received on these ports. If not receiving, re-check the FTD logging configuration.

If none of the above repairs work, raise a support ticket with Security Cloud Control support..


Remove an SEC from Your Host

The Secure Event Connector (SEC) delete command removes the SEC container along with its associated files from the Secure Device Connector (SDC) virtual machine. This command is typically used to address issues such as Secure Event Connector registration failures or onboarding failures.

To run the command:

Procedure

1.

SSH to your host using the admin account, typically cdo.

2.

Switch to the SDC user with sudo su - sdc.

3.

Run the command sdc eventing delete.

If applicable, you will be prompted to select the tenant you wish to delete. Follow the on-screen prompts to confirm your selection and fully remove the SEC data from the virtual machine.


Use Health Check to Learn the State of your Secure Event Connector

The Secure Event Connector (SEC) Health Check script provides information on the state of your SEC.

Follow this procedure to run Health Check:

Procedure

1.

SSH to your host using the admin account, typically cdo.

2.

Switch to the SDC user using the command sudo su - sdc

3.

Run the command sdc eventing healthcheck and, if applicable, select the tenant when prompted.

Values of Health Check output:

  • SEC Cloud URL: Displays the Security Cloud Control cloud URL and whether or not the SEC can reach Security Cloud Control.

  • SEC Connector: Will show "Running" if the SEC connector has been onboarded correctly and has started.

  • SEC UDP syslog server: Will show "Running" if the UDP syslog server is ready to send UDP events.

  • SEC TCP syslog server: Will show "Running" if the TCP syslog server is ready to send TCP events.

  • SEC Connector status: Will show Active if the SEC is running and onboarded to Security Cloud Control.

  • SEC Send sample event: If at the end of the health check, all the status checks are "green," the tool sends a sample event. (If any of the processes are "Down," the tool skips sending the test event.) The sample event shows up in the Event Log as a policy named "sec-health-check."