Explains how to monitor Security Cloud Control workflows, troubleshoot failed device or connector tasks, export workflow details for TAC analysis, and copy stack traces for unresolved errors.
Workflow monitoring is a Security Cloud Control capability that
-
tracks every process that Security Cloud Control runs when communicating with devices, Secure Device Connector (SDC), or Secure Event Connector (SEC), and when applying ruleset changes to devices,
-
creates an entry in the workflow table for every step and displays its outcome, and
-
contains information pertaining only to the action performed by Security Cloud Control and not the device it is interacting with.
Workflow error reporting and troubleshooting
Security Cloud Control reports an error when it fails to perform a task on a device. Navigate to the Workflows page to see the step where the error occurred, for more details.
This page also helps you determine and troubleshoot errors or share information with TAC, when required.
To navigate to the Workflows page, in the left pane, click Security Devices and, click the Devices tab. Click the appropriate device type tab to locate the device and select the device you want. Under the Devices and Actions in the right pane, click Workflows.
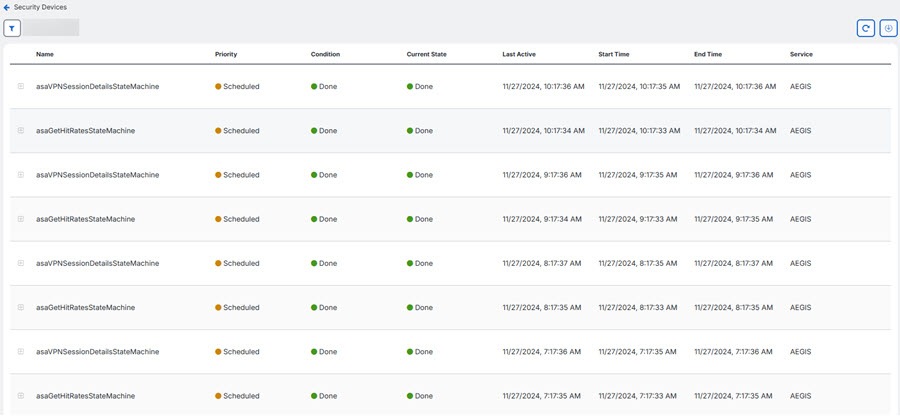
Export device workflows:
-
You can download the complete workflow information to a JSON file and provide it when the TAC team asks for further analysis. To export the workflow information, select the corresponding device and, navigate to its Workflows page and click the export (
 ) icon appearing at the top-right corner.
Copy stack trace:
-
If you have an error you cannot resolve and you approach TAC, they may ask you for a copy of the stack trace. To collect the stack trace for the error, click the Stack Trace link and click Copy Stacktrace to copy the stacks appearing on the screen, to a clipboard.