Summarizes key information regarding various policy types, including their current state and performance metrics. It offers interactive dashlets that allow users to filter data, identify unused policies, and monitor change events to maintain network stability and optimize resource usage.
The Traffic Engineering Dashboard provides a high-level summary of RSVP-TE tunnel, SR-MPLS, SRv6, and Tree-SID policy information.
To see the Traffic Engineering Dashboard, choose Services & Traffic Engineering > TE Dashboard .
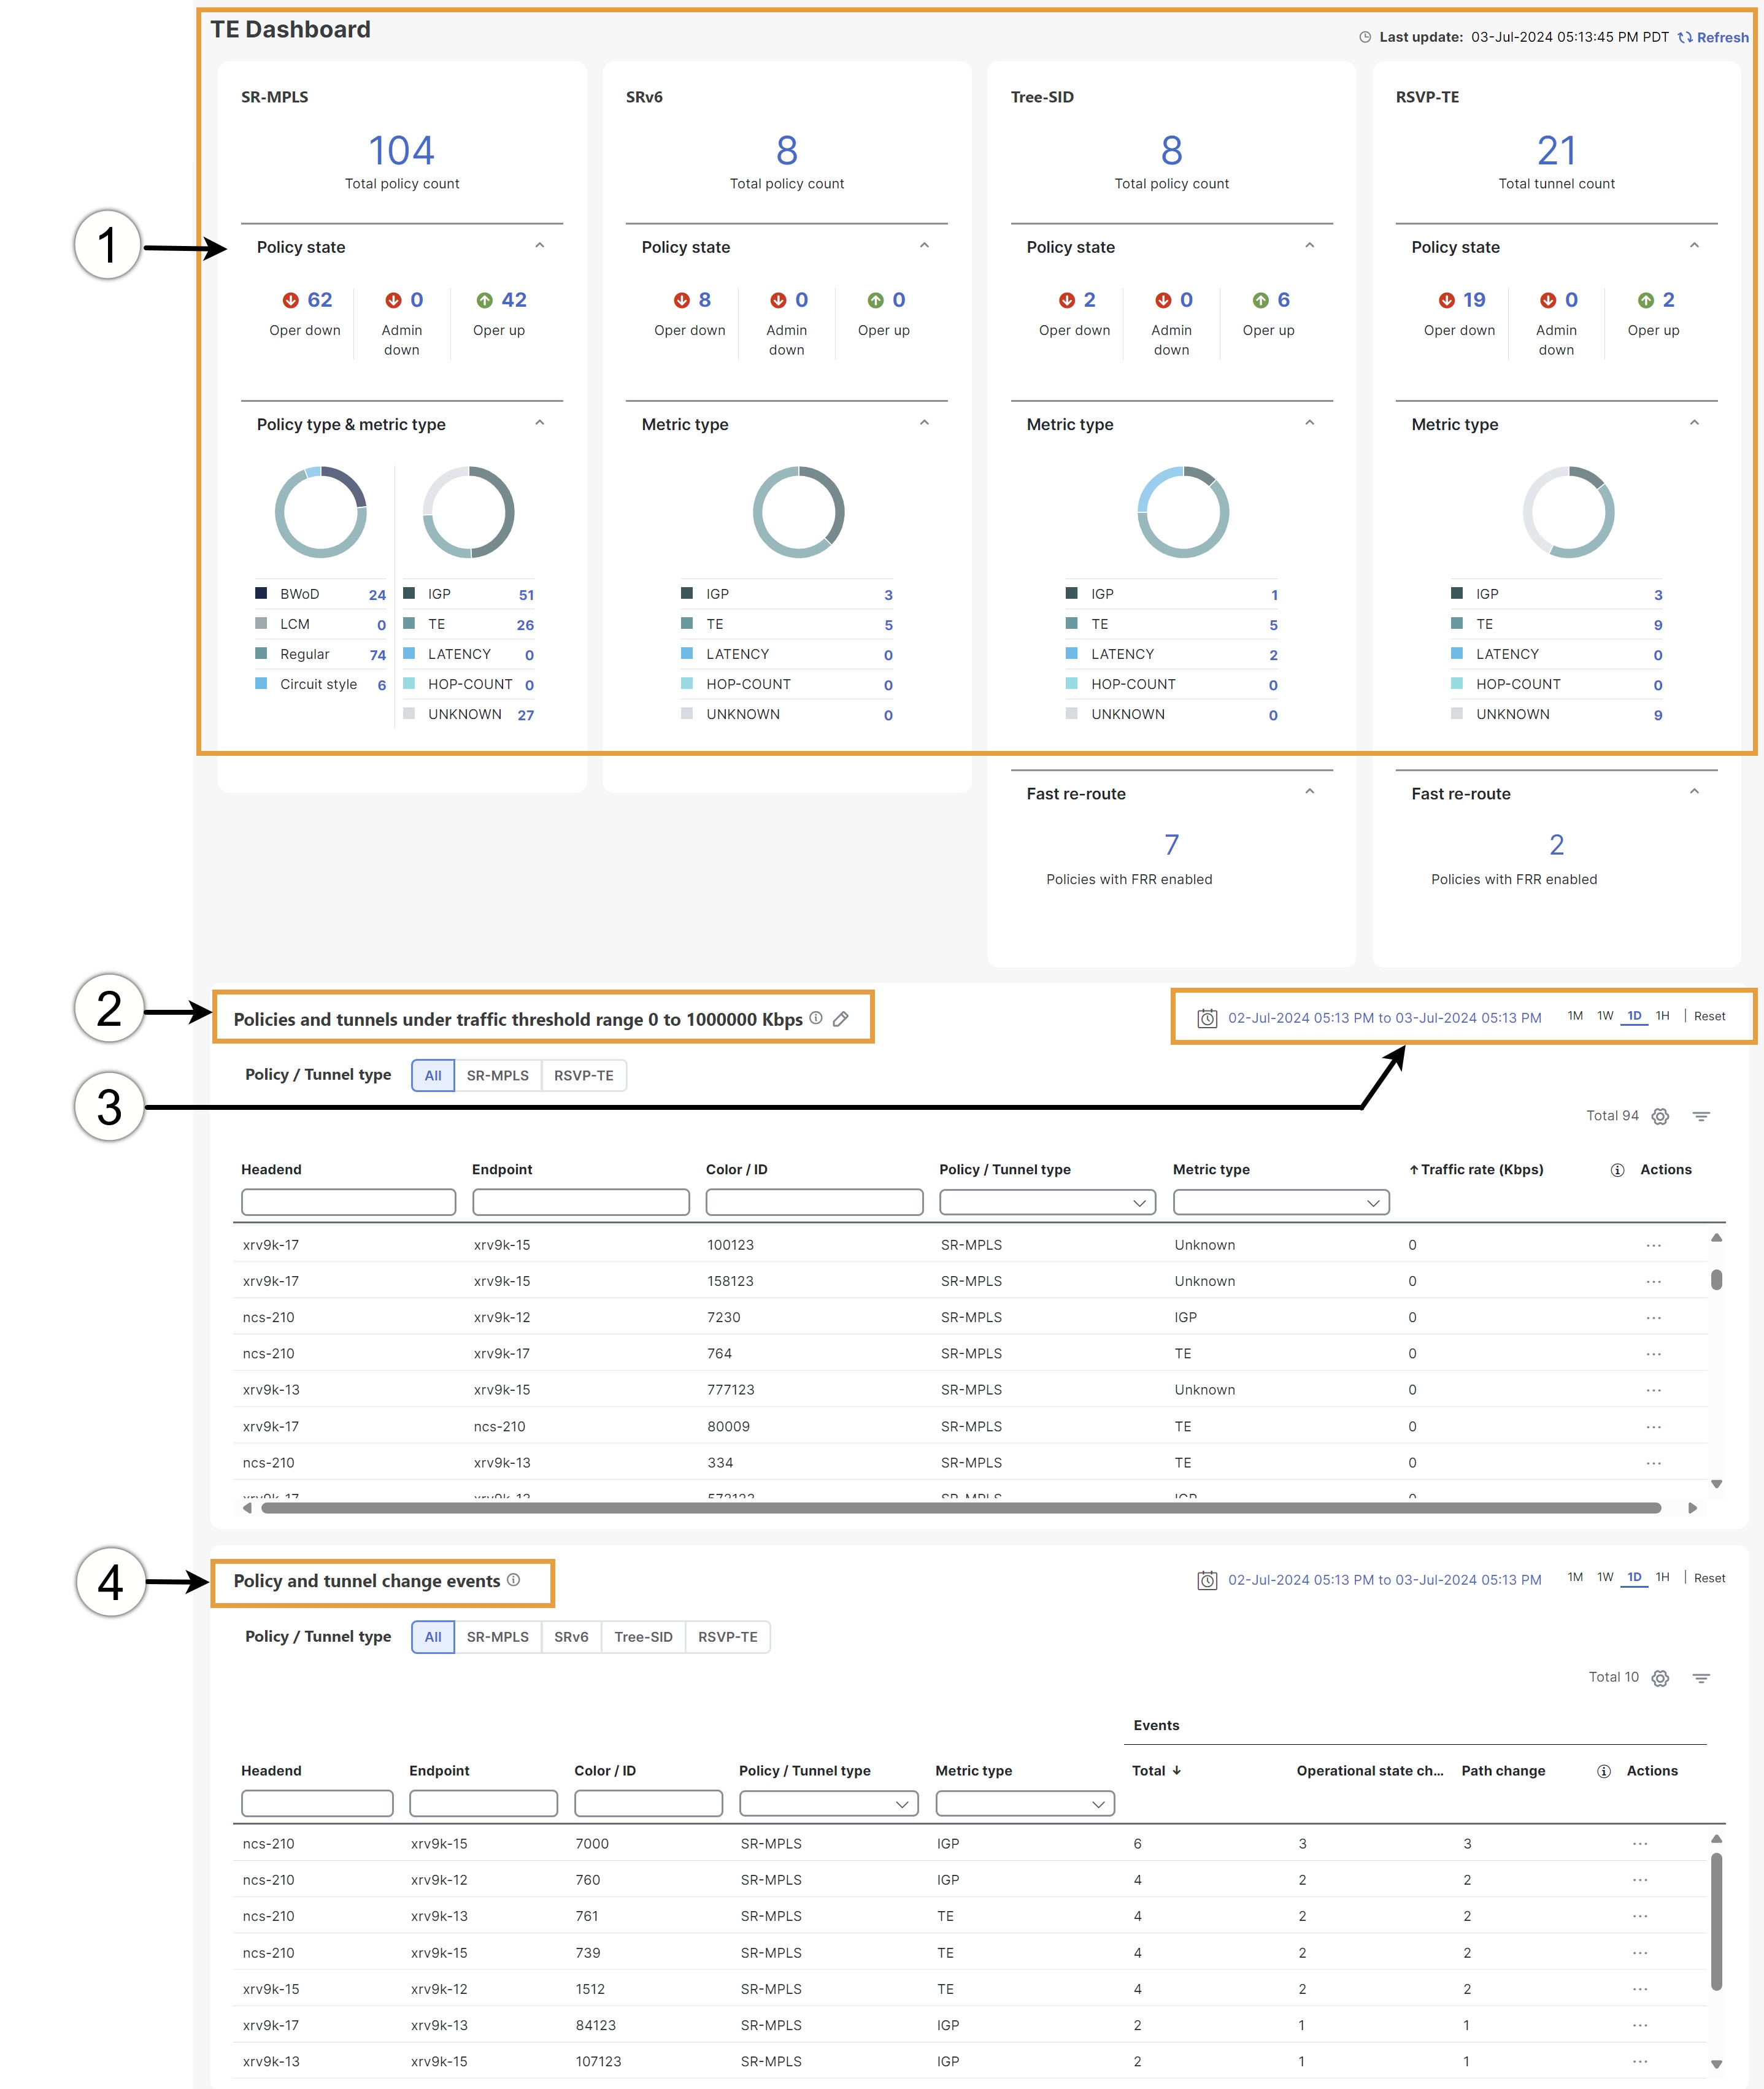
If you are viewing the HTML version of this guide, click the images to view them in full-size.
| Callout No. | Description |
|---|---|
| 1 |
Traffic Engineering Dashlet: Displays the total policy count and count of policies according to the policy state. It also displays the number of all TE policies and the number of policies or tunnels according to the metric types for all TE services. To drill down for more information, click on a value. The topology map and TE table appear, displaying only the filtered data you clicked on. |
| 2 |
Policies and Tunnels Under Traffic Threshold: Displays RSVP-TE tunnels and SR-MPLS policies with traffic below the defined threshold in the selected time period. This information may be used to find and filter the unused policies or tunnels. Click
|
| 3 |
Allows you to filter the data on the dashlet based on the time range you want to view (date, 1 month, 1 week, 1 day, and 1 hour). |
| 4 |
Policy and tunnel change events: Displays all the policies and tunnels that have had a path or state change event ordered by the event count, within the selected time range. This information helps identify the unstable policies and tunnels.
|
 to update the LSP threshold range and change the units from Kbps to Mbps.