Describes the Traffic Engineering topology map that visualizes RSVP-TE tunnels, including how it distinguishes path types, marks adjacency segment IDs, and summarizes tunnel status through a mini dashboard.
A Traffic Engineering topology map is a visualization tool that displays the network topology with clear emphasis on participating links and devices. The map distinguishes path types by representing Record Route Objects (RRO) as straight lines and Explicit Route Objects (ERO) as curved lines, and marks adjacency segment IDs (SIDs) for precise identification. Device clusters are labeled to indicate tunnel sources and destinations. The map also features a mini dashboard that summarizes tunnel statuses and counts, providing a concise overview of network traffic engineering elements.
Traffic Engineering topology map callouts
To open the Traffic Engineering topology map for RSVP-TE visualization, choose .
From the Traffic engineering table, select the RSVP-TE tunnels you want to view on the map. RSVP-TE tunnels appear as colored lines indicating their source and destination.
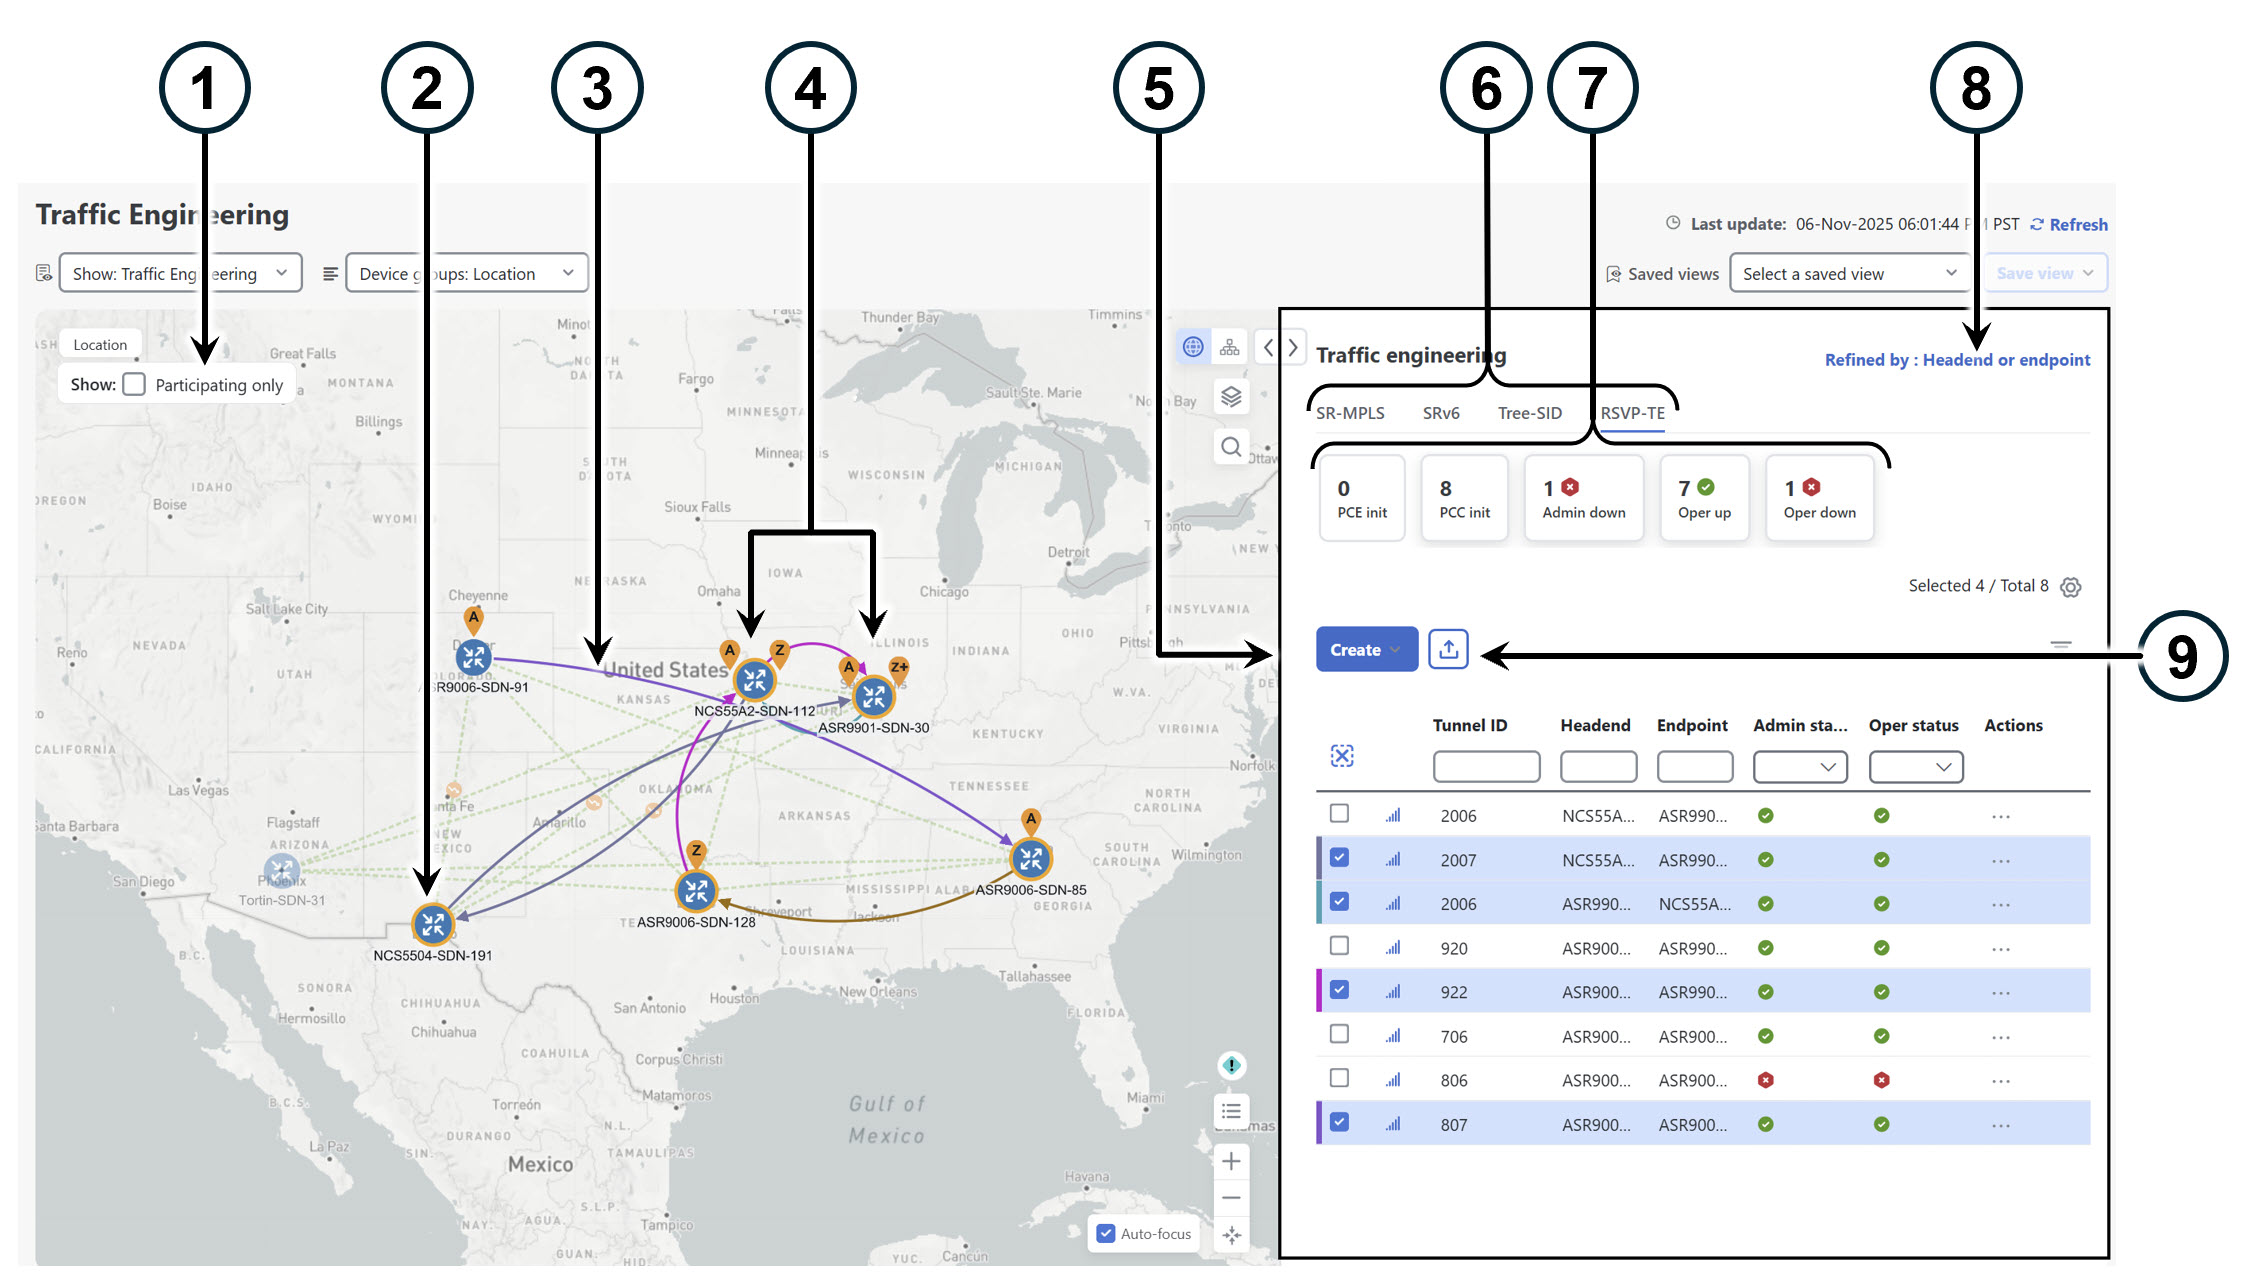
The following table describes the callouts for the Traffic Engineering topology map for RSVP-TE tunnels.
Callout no. |
Description |
|---|---|
1 |
Show Participating only: Displays only links belonging to the selected RSVP-TE tunnels. All other links and devices are hidden. |
2 |
Device outlines:
|
3 |
Tunnel visualization: When you select RSVP-TE tunnels in the RSVP-TE Tunnel table, the map displays colored directional lines showing the source and destination.
If both A and Z are displayed in a device cluster, at least one node in the cluster is a source, and another is a destination.
|
4 |
RSVP-TE tunnel origin and destination: If both A and Z are displayed in a device cluster, at least one node in the cluster is a source, and another is a destination.
|
5 |
Window content: The window content depends on the selected or filtered items. In this example, the RSVP-TE tab shows the RSVP-TE Tunnels table. Depending on the map selection, you can create, modify, or view RSVP-TE tunnels. |
6 |
Tabs: Click the RSVP-TE tab to access RSVP-TE data. |
7 |
Mini dashlets: Summarizes the operational RSVP-TE tunnel status and displays the number of PCC and PCE-initiated tunnels listed in the RSVP-TE table. When you select a dashlet, filters are applied and the policy table updates to display data corresponding to the filtered dashlet. |
8 |
Group filter: Controls how group filters apply to table data. For example, if Headend only is selected, the table only displays policies where the policy's headend device is in the selected group. This filter helps you efficiently manage policies in large networks. Filter options:
|
9 |
Export function: Exports all data into a CSV file. You cannot export selected or filtered data. |
 ) indicates a device with a strict hop.
 ).
). to view performance metrics for the RSVP-TE tunnel.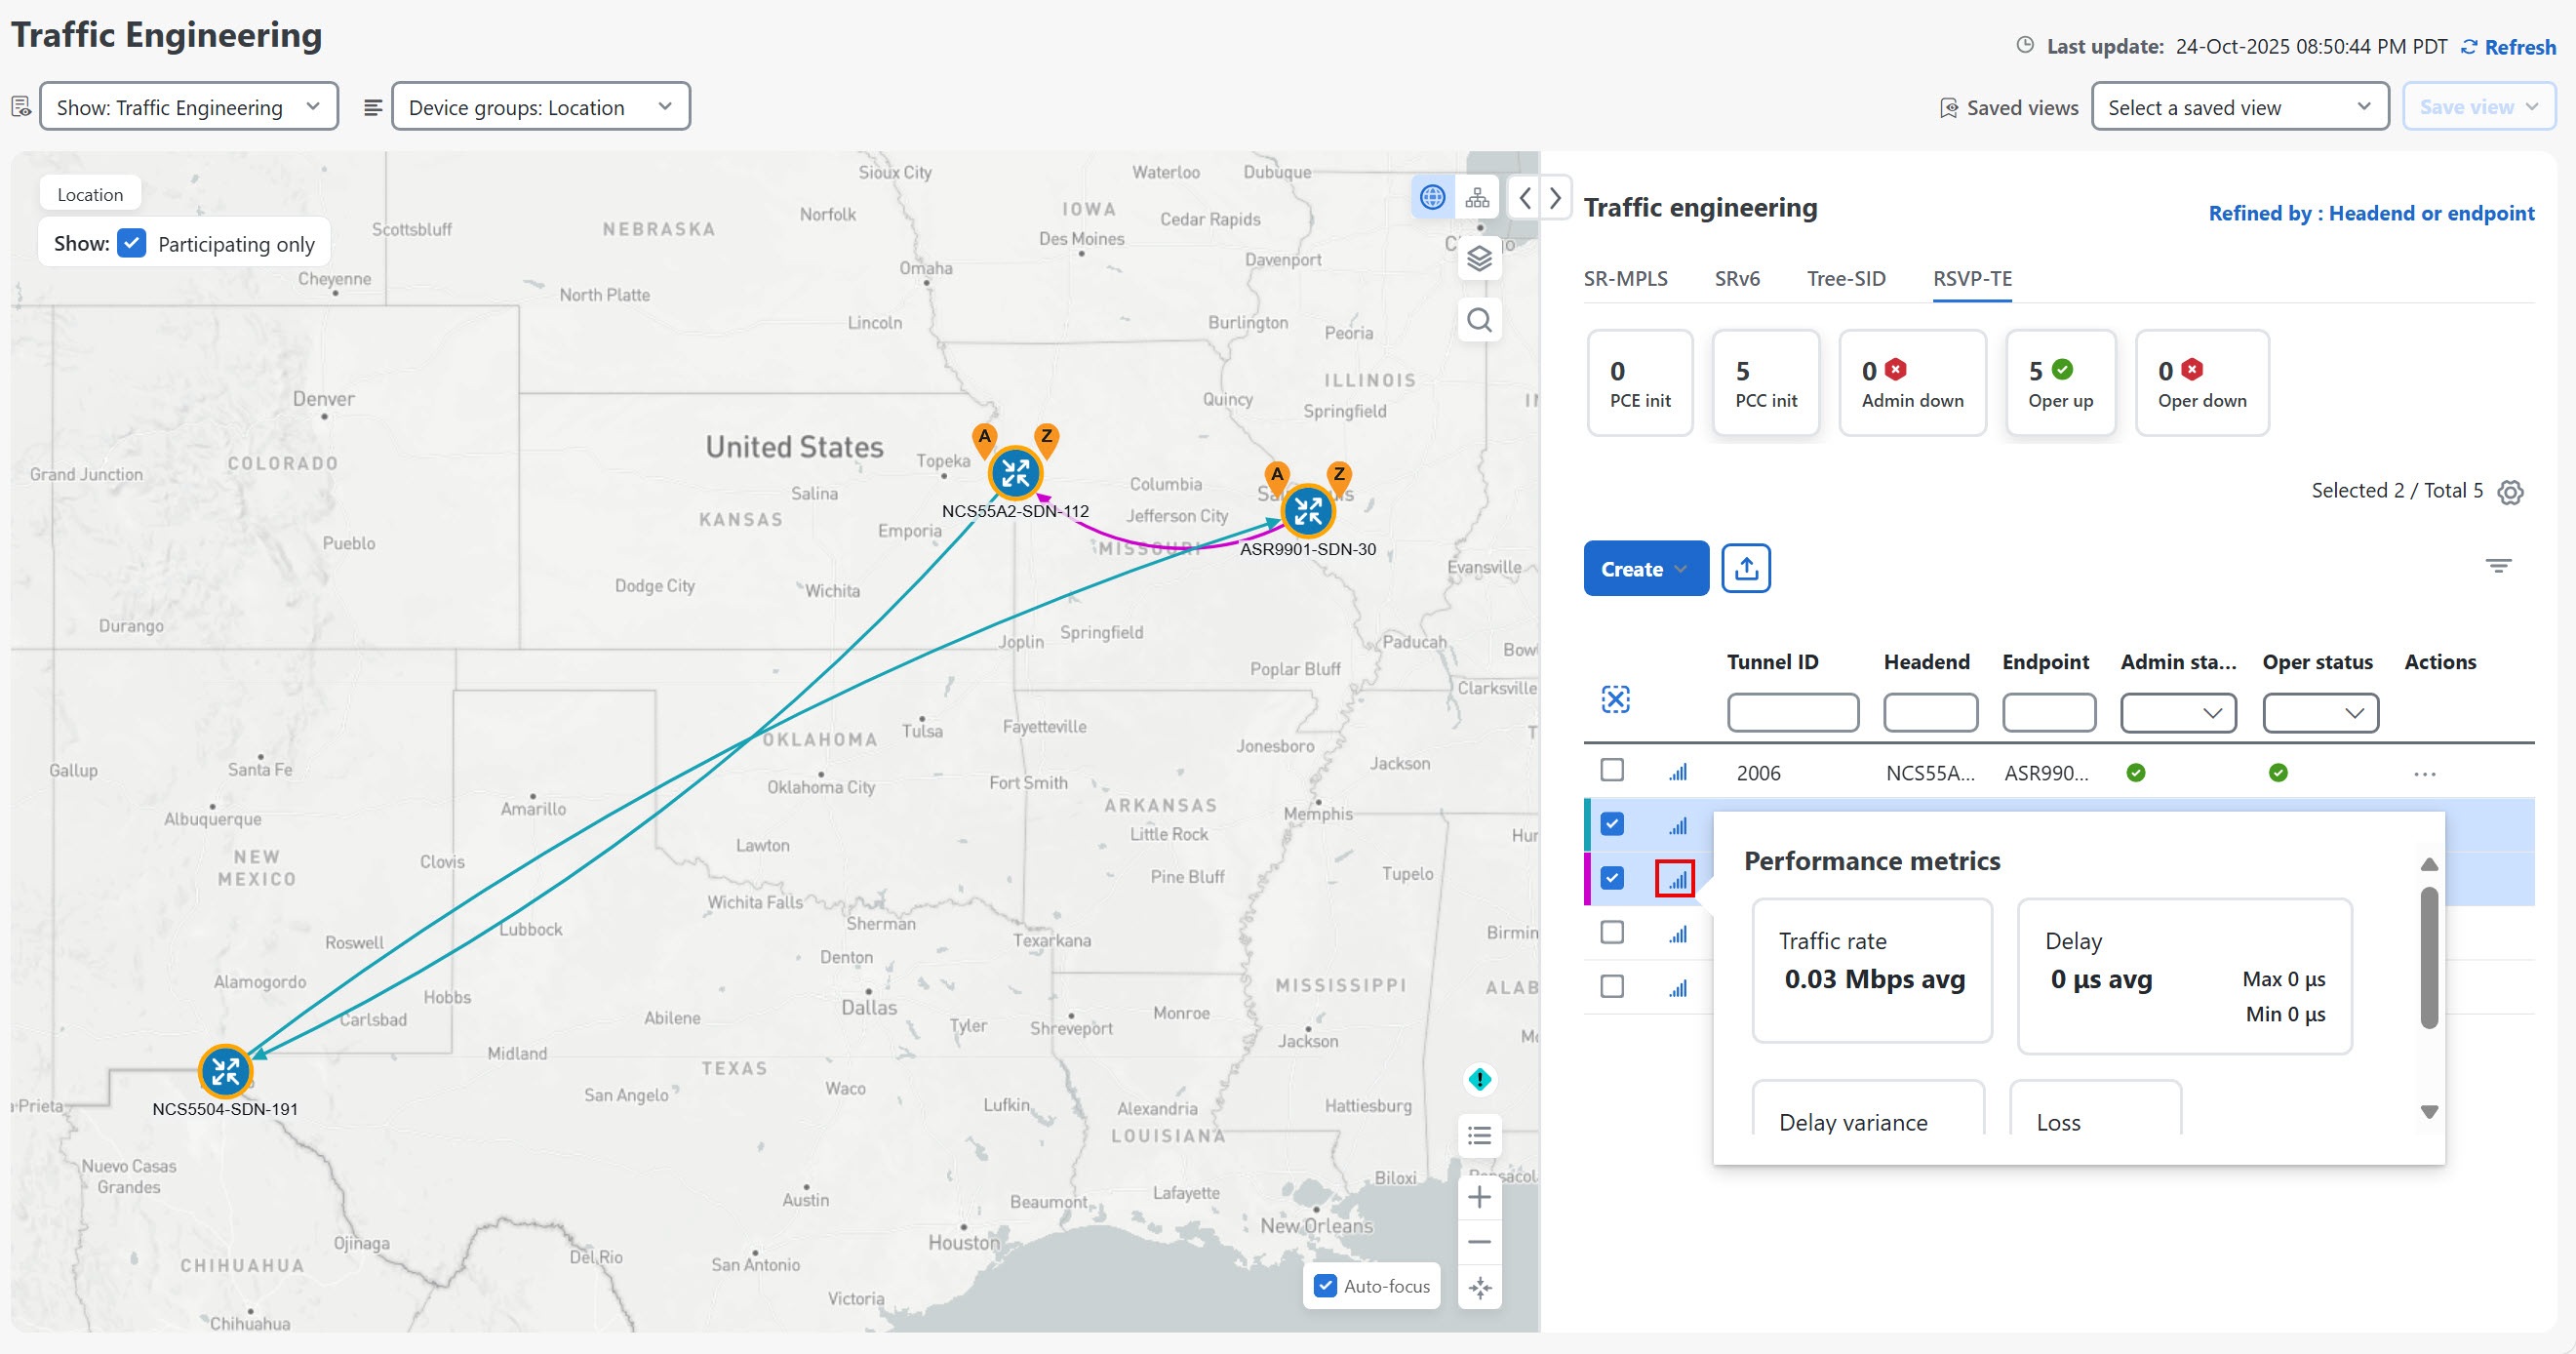

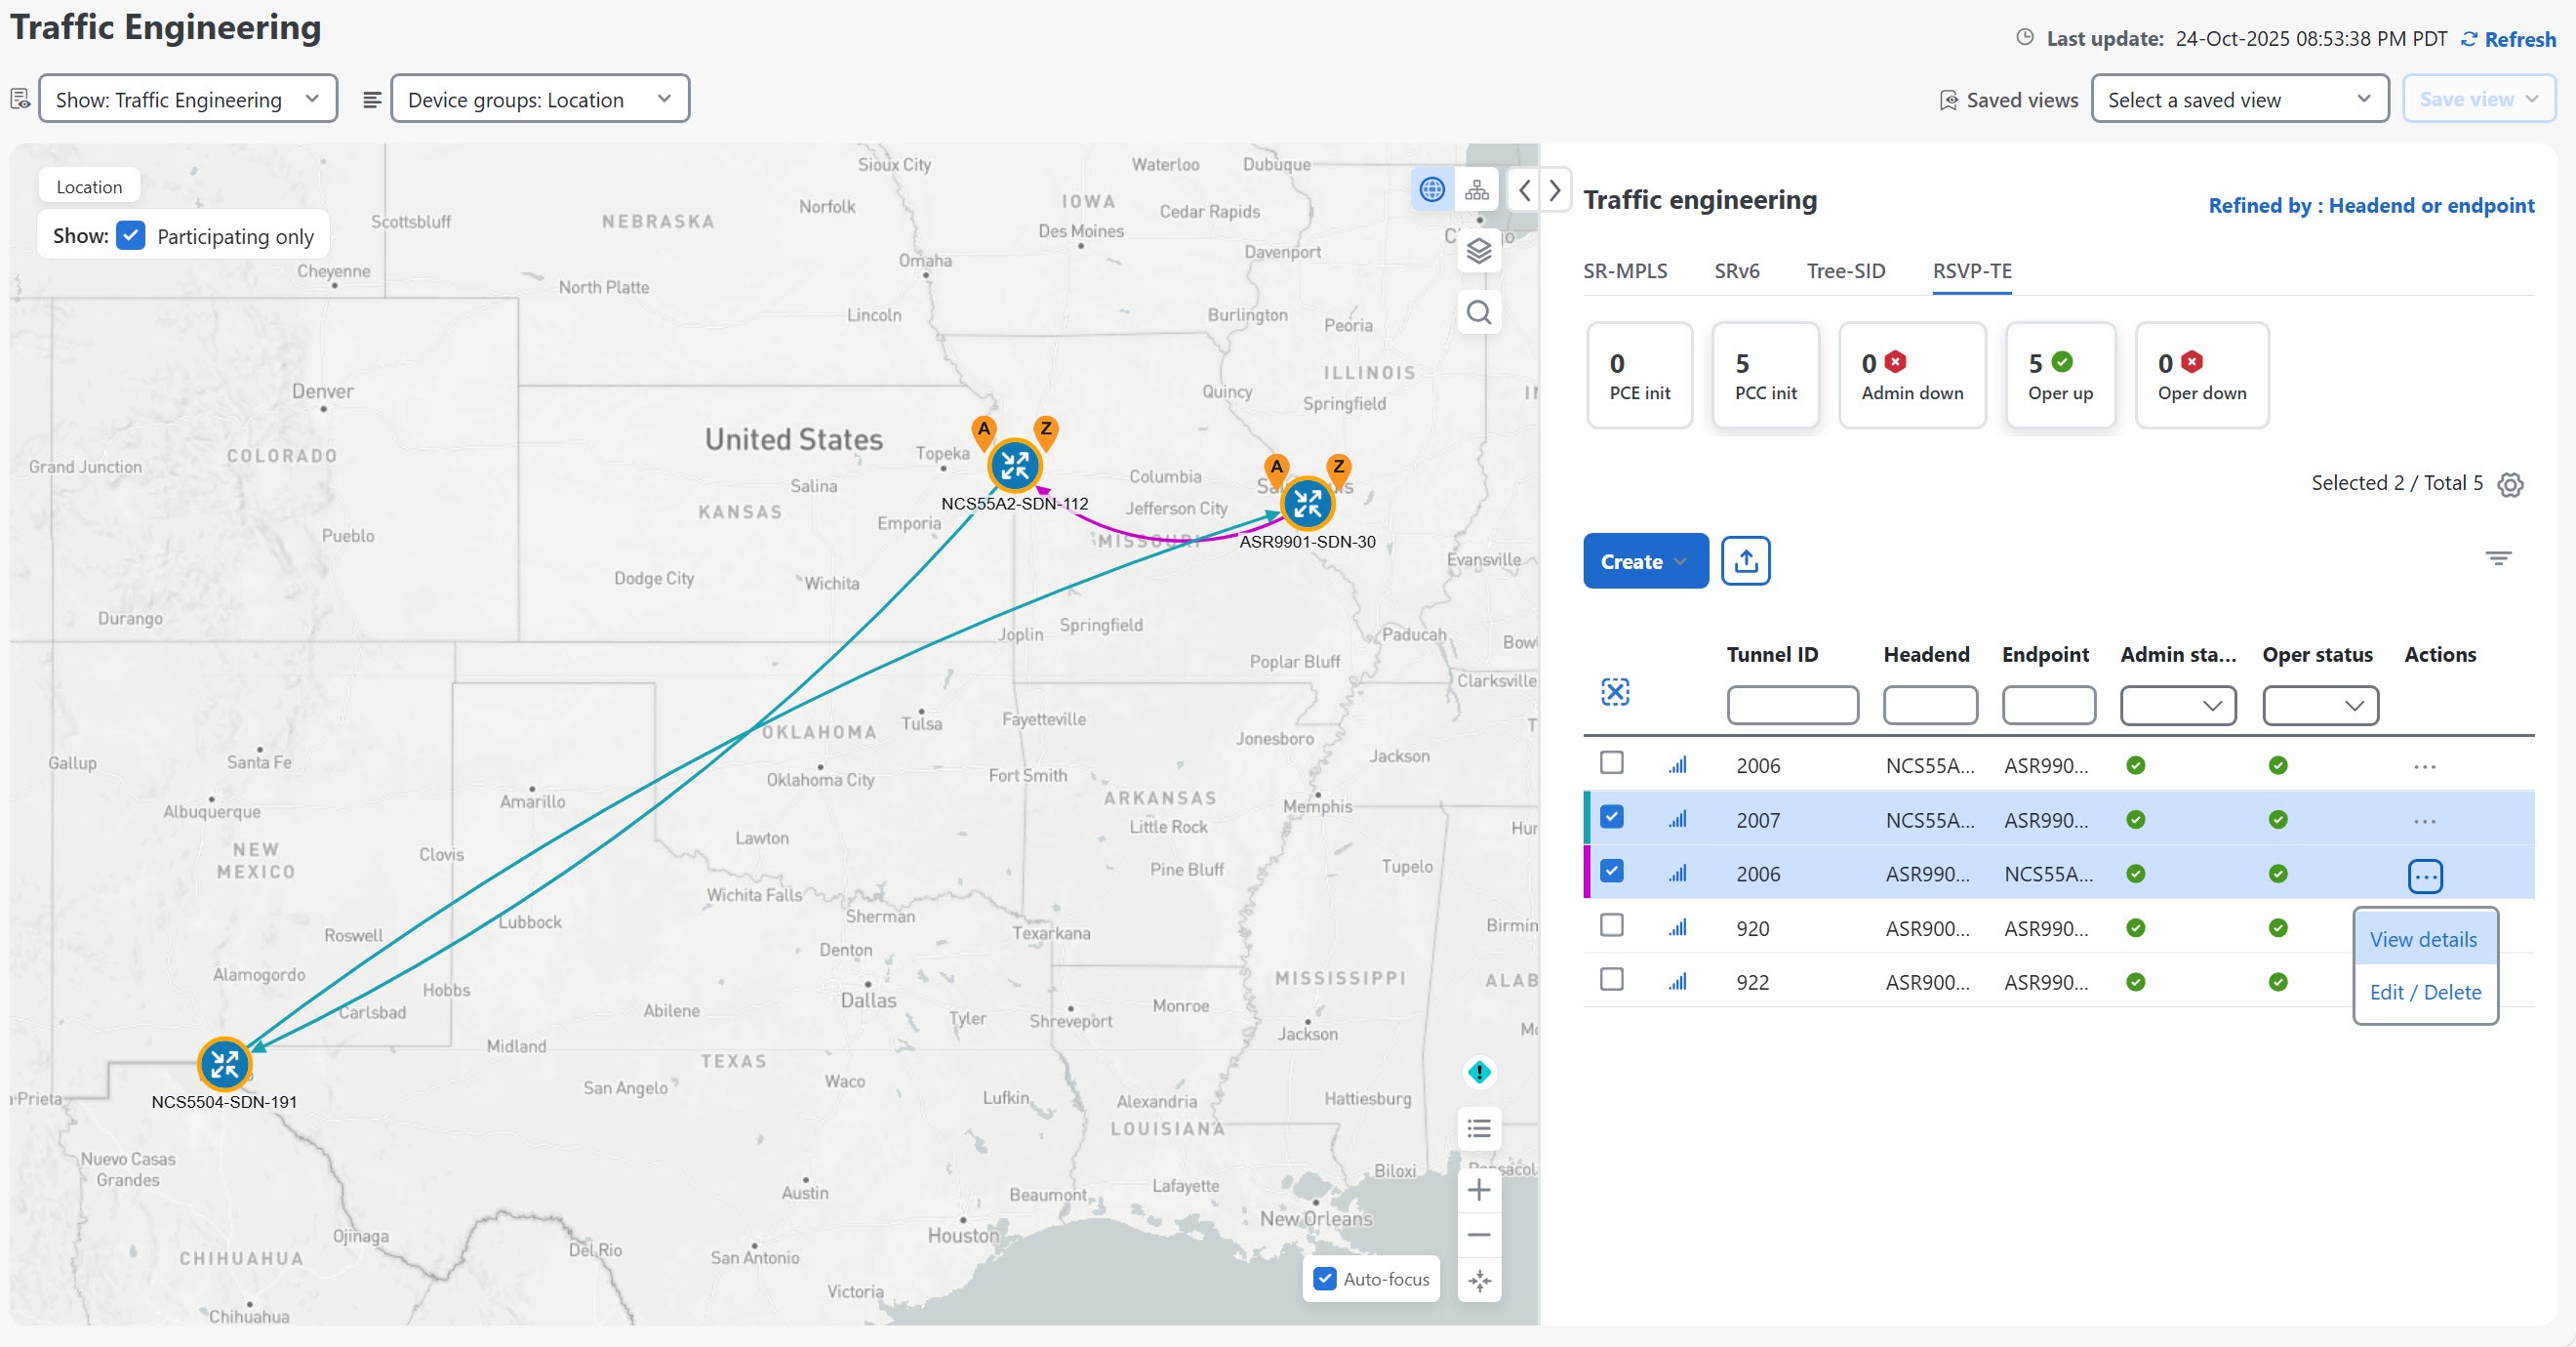
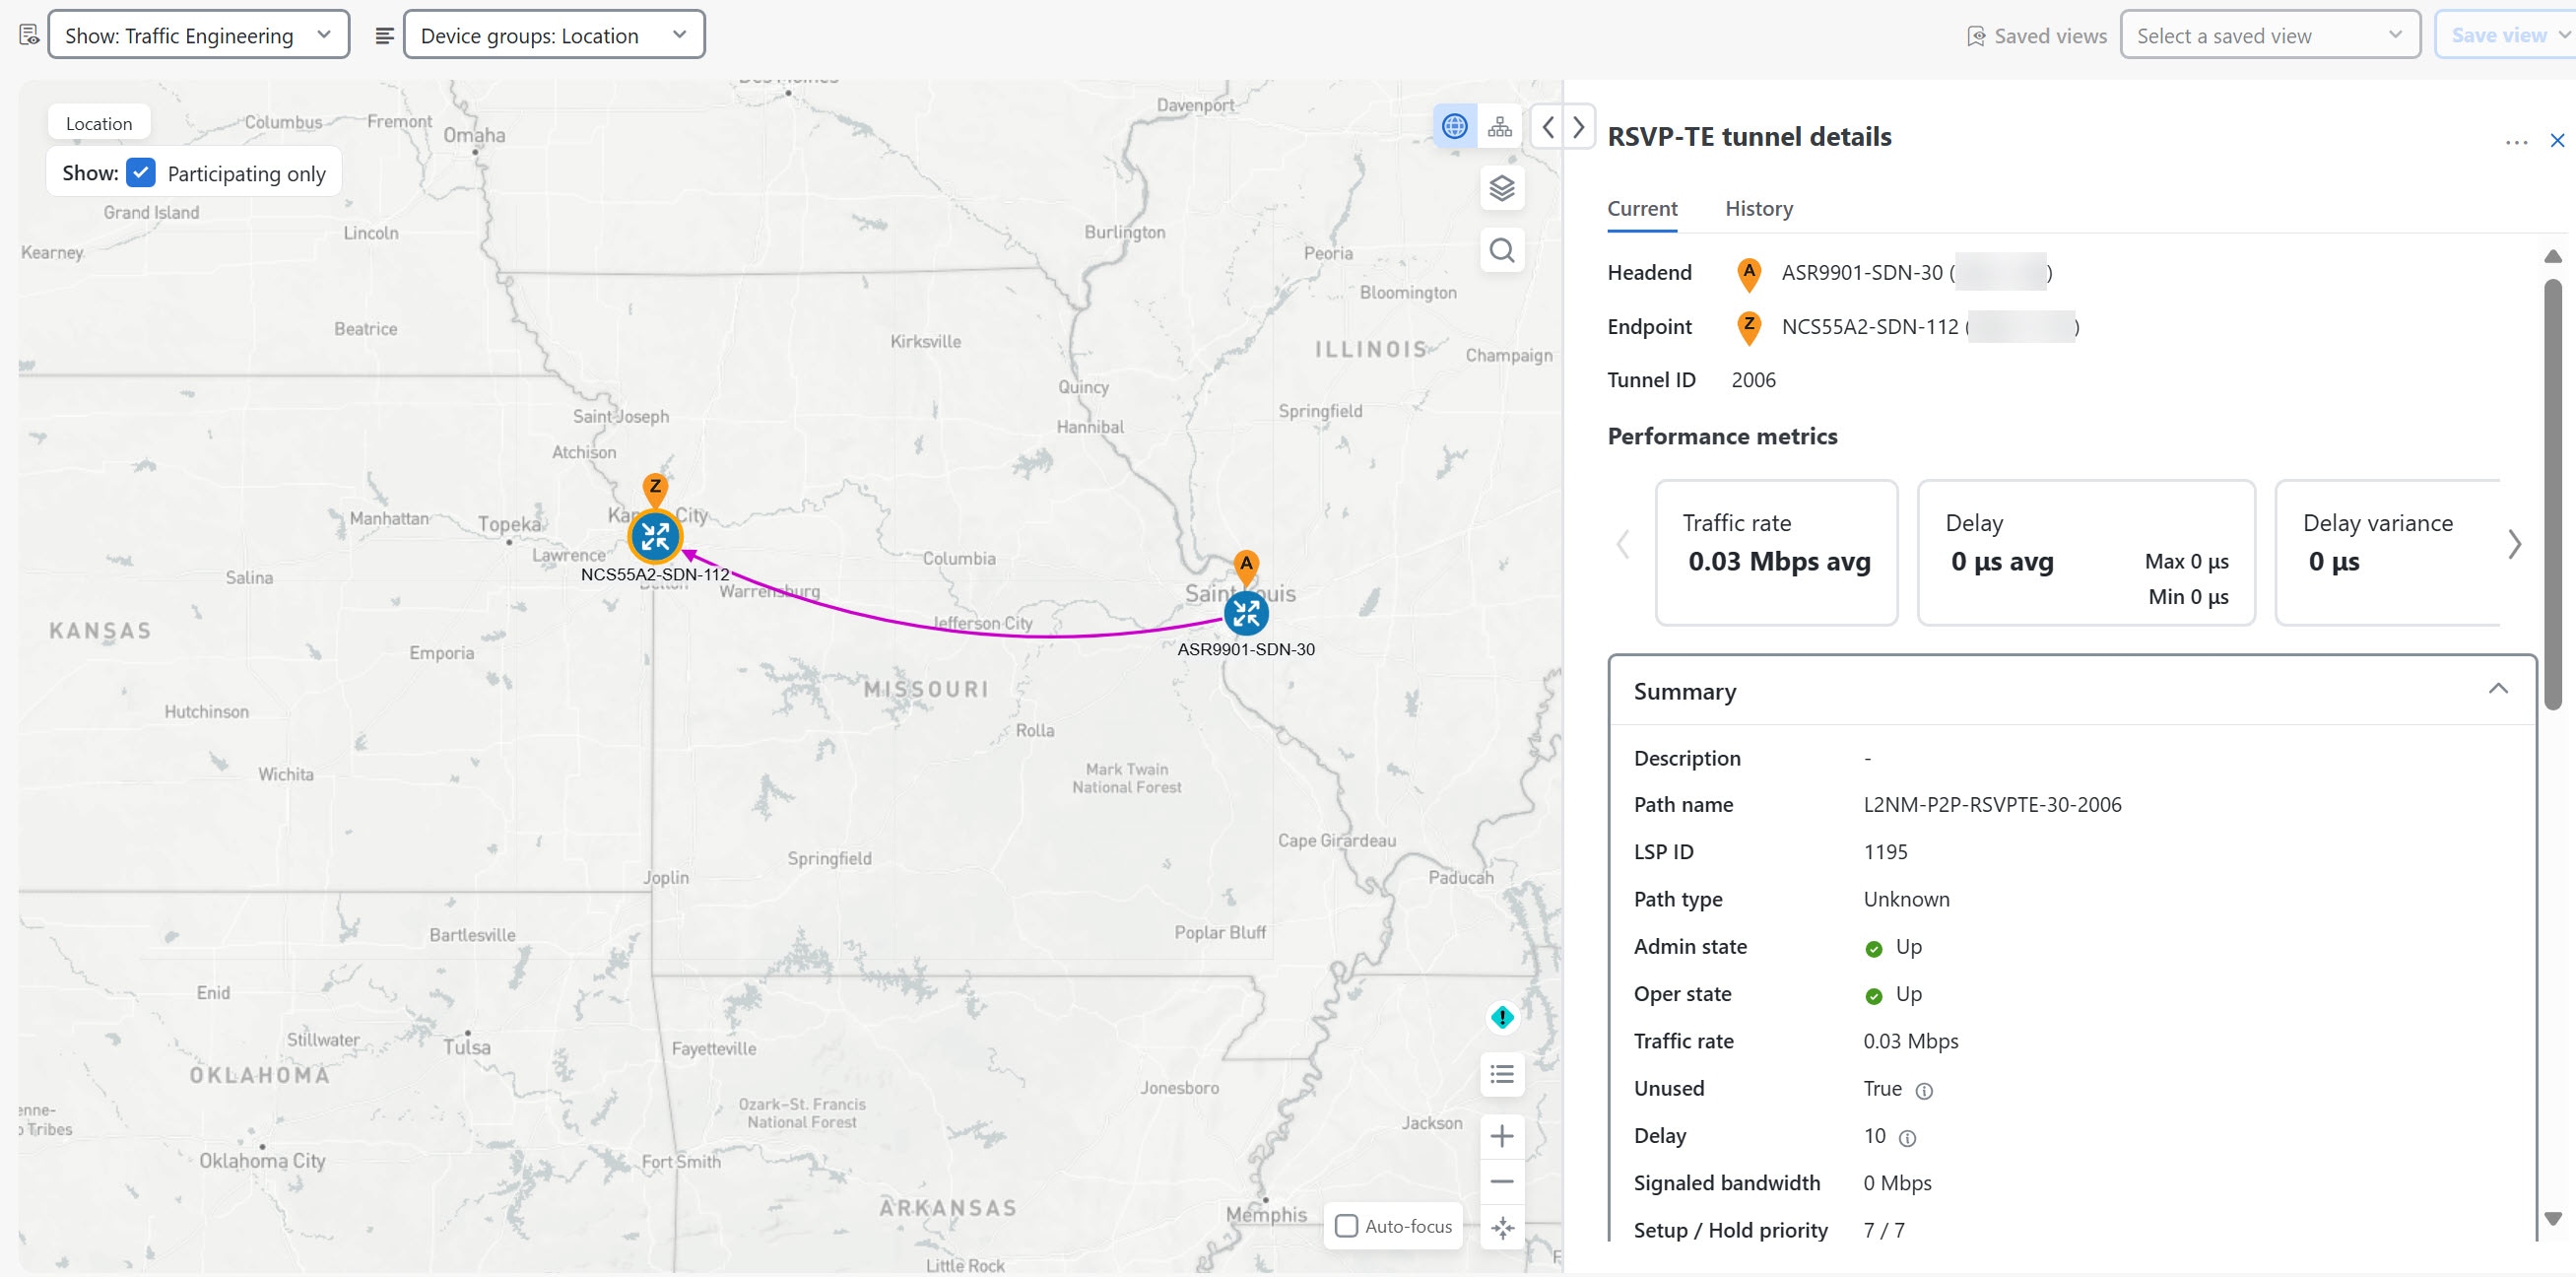
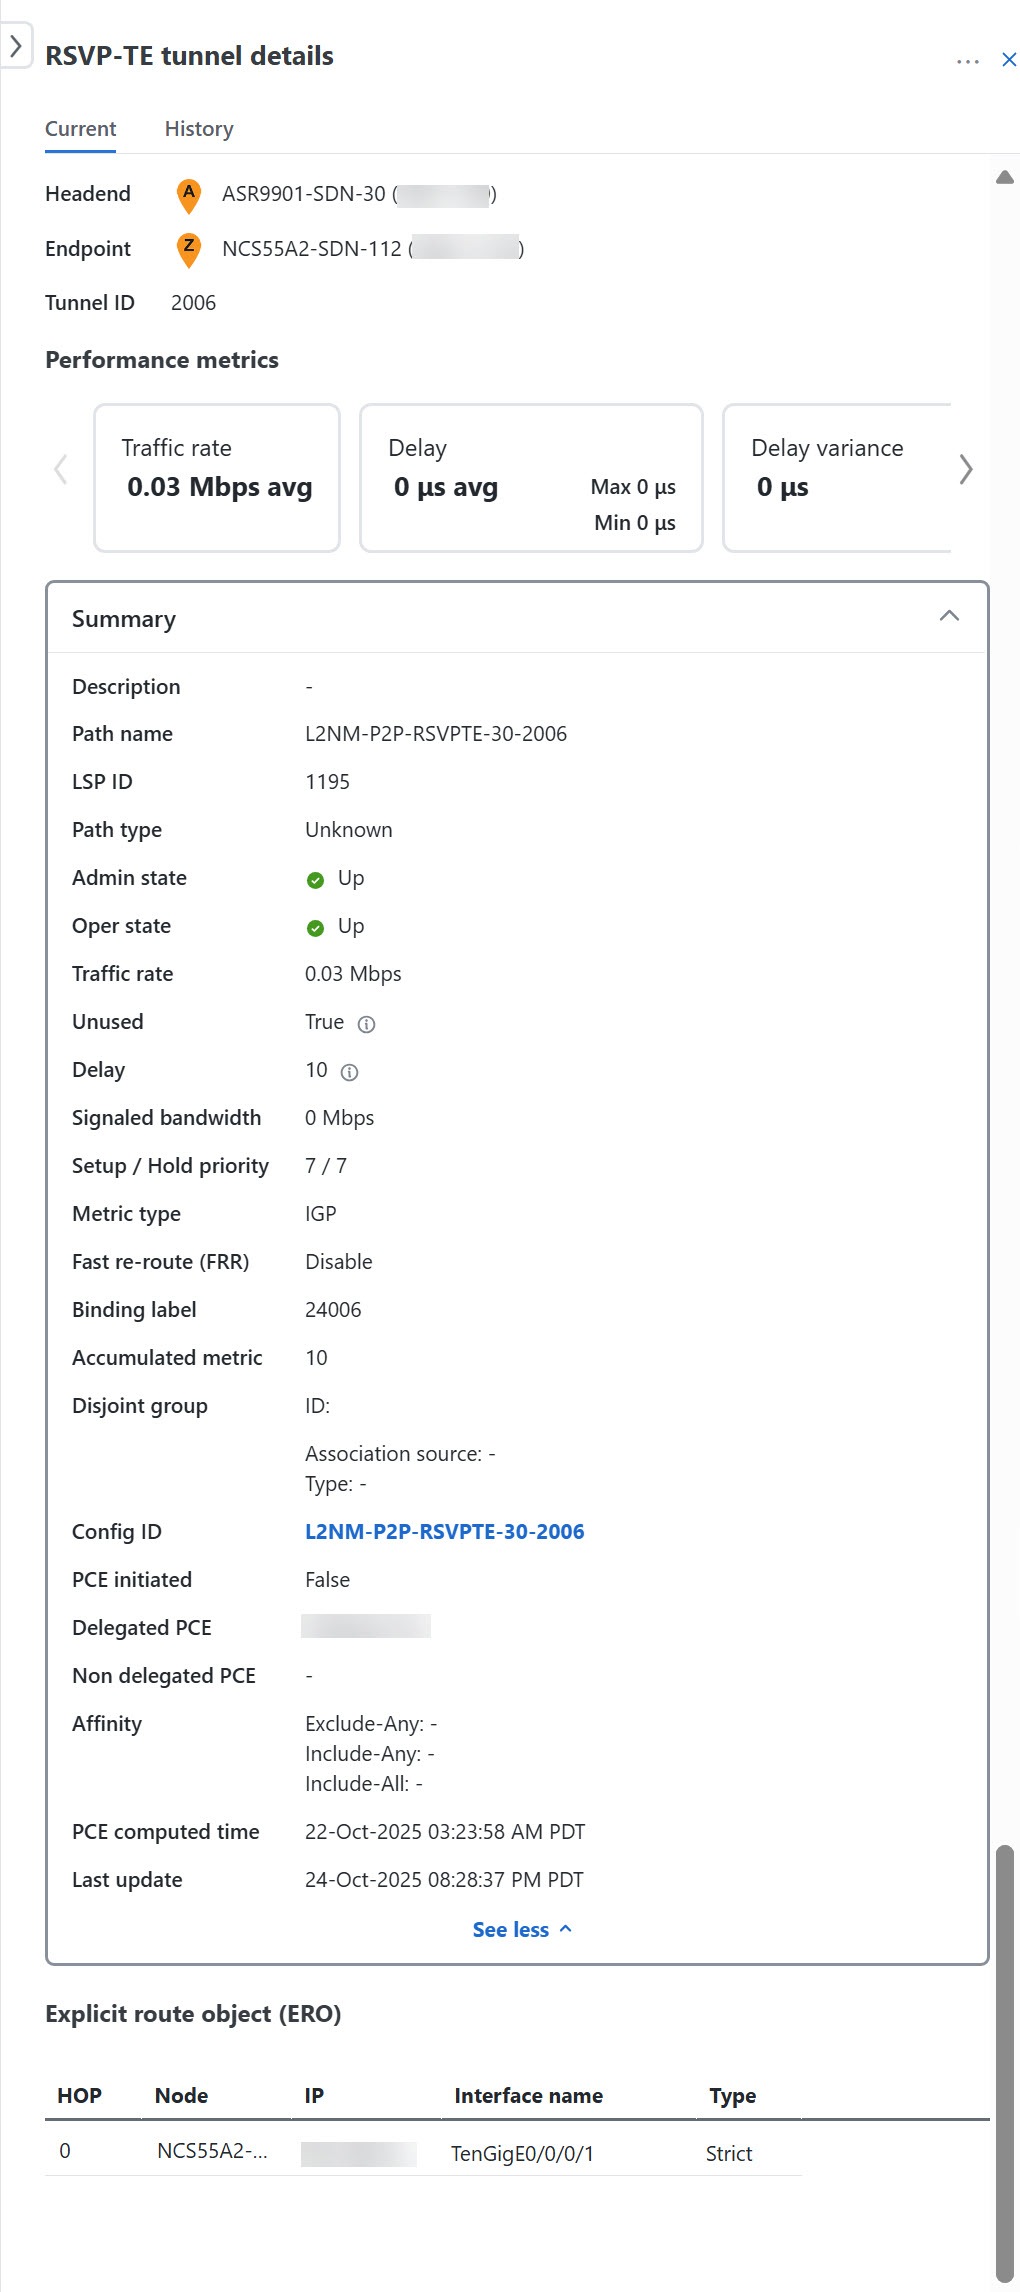
 icon next to the delay value to view the Last Update timestamp. Delay values are based on ON_CHANGE Performance Measurement (PM) notifications and represent the most recent value received from the device. If no newer PM notification is received because PM is disabled or notification delivery stops, the last received value can remain displayed. Verify the update time and PM collection status before treating the displayed value as current.
 .
. in the same row as the RSVP-TE tunnel, and select
  , enter a name for the tunnel, and click
  to import an existing RSVP-TE tunnel.