This section provides an overview of the Traffic Engineering user interface in Crosswork Network Controller, and how it enables viewing and managing SR-MPLS and SRv6 policies on the topology map.
The Traffic Engineering (TE) topology map in Crosswork Network Controller is a powerful visualization tool designed to empower network operators with deep insights into their network’s structure and active TE policies. By providing a clear and intuitive graphical representation of Segment Routing Traffic Engineering (SR-TE) policies and RSVP-TE tunnels, it significantly reduces the complexity of provisioning and managing these traffic engineering mechanisms. This visualization enhances operators’ understanding of traffic flows, resource utilization, and overall network performance, enabling more effective traffic management, optimization, and troubleshooting.
To open the Traffic Engineering topology map, choose .
From the Traffic engineering table, select the SR-MPLS or SRv6 policy you want to view on the map. You can select up to 10 policies that will appear as separate colored links.
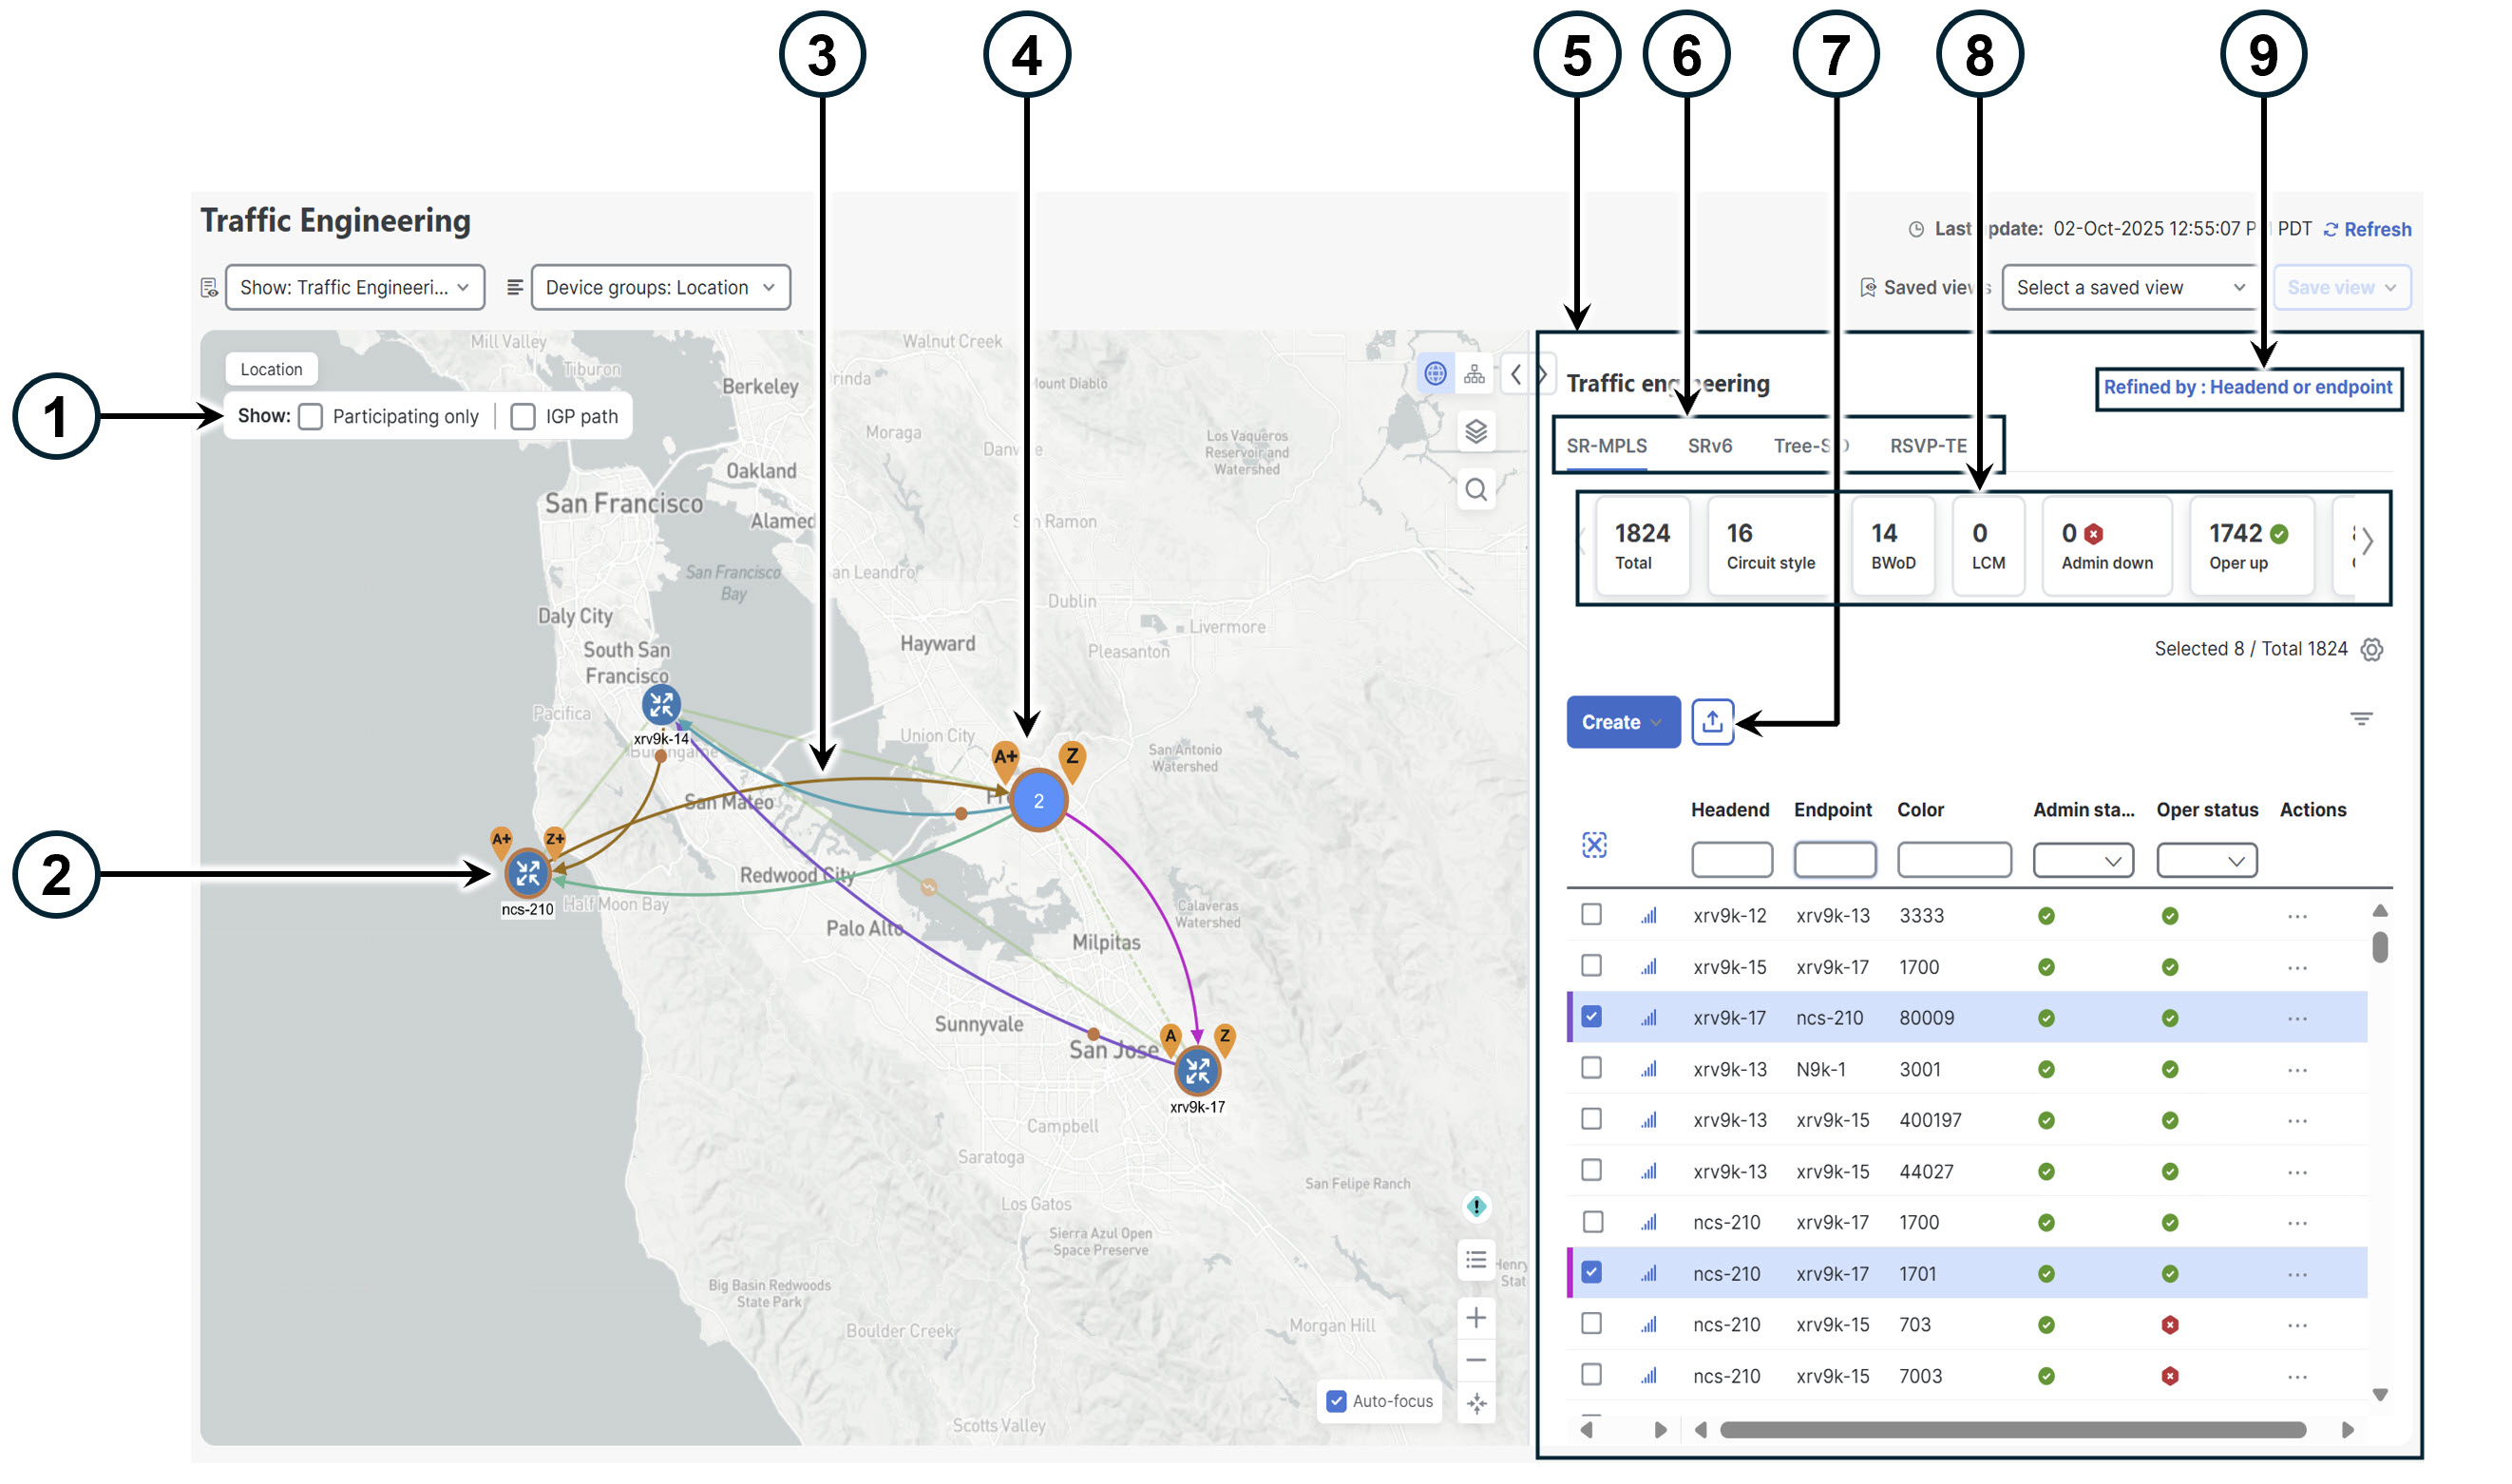
The table describes the callouts for the Traffic Engineering topology map for SR-MPLS and SRv6 policies.
| Callout no. | Description | |
|---|---|---|
| 1 |
Select the appropriate check box to enable these options:
|
|
| 2 |
Device outlines: A device with an orange ( |
|
| 3 |
When SR-TE policies are selected in the SR-MPLS or SRv6 tables, they show as colored directional lines on the map indicating source and destination. An adjacency segment ID (SID) is shown as an orange circle on a link along the path ( |
|
| 4 |
SR-MPLS and SRv6 policy origin and destination: If both A and Z are displayed in a device cluster, at least one node in the cluster is a source, and another is a destination.
|
|
| 5 |
Window content: The window content depends on the selected or filtered items. In this example, the SR-MPLS tab shows SR Policy table. Depending on the map selection, you can create, modify, or view policies. |
|
| 6 |
Tabs: Click the SR-MPLS or SRv6 tab to view the corresponding list of SR-TE policies. |
|
| 7 |
Export function: Exports all data into a CSV file. You cannot export selected or filtered data. |
|
| 8 |
Mini dashlets: Summarizes the operational SR-MPLS or SRv6 policy status and displays the number of PCC and PCE-initiated tunnels listed in the SR Policy table. When you select a dashlet, filters are applied and the policy table updates to display data corresponding to the filtered dashlet. |
|
| 9 |
Group filter: Controls how group filters apply to table data. For example, if Headend only is selected, the table only displays policies where the policy’s headend device is in the selected group. This filter helps you efficiently manage policies in large networks. Filter options:
|
|
 ) outline indicates there is a node SID associated with that device or a device in the cluster.
  ).
).