Cisco Crosswork Network Controller 7.2 Traffic Engineering and Optimization

PDF

Cisco Crosswork Network Controller 7.2 Traffic Engineering and Optimization

Manage demand matrix domains

Want to summarize with AI?

Log in

This section covers how to manage Demand Matrix domains in Crosswork Network Controller, including monitoring IGP domains, configuring global settings, and visualizing traffic demands on topology maps.


Use these dashboards to manage demand matrix domains and visualize the demands in detail by drilling down to specific locators and links:

  • Domain dashboard: Acts as the central hub for managing and monitoring all IGP domains. It displays all discovered domains and provides an overview of each domain's status and key metadata.

  • Global configurations: Allows you to define global settings that influence how DDM operates across all monitored IGP domains.

  • Demand matrix: Provides a detailed view of the computed demands for a selected domain and its visualization on the topology map.
Demand matrix domains dashboard

The Demand matrix domain dashboard (Services & Traffic Engineering > Demand Matrix) displays all the domains discovered by Crosswork Network Controller. A domain is an identifier assigned to an IGP process.

Note

The domains will begin displaying the updated info on active and total nodes, per the specified cadence set in the Global configuration settings. The default cadence is 15 minutes.

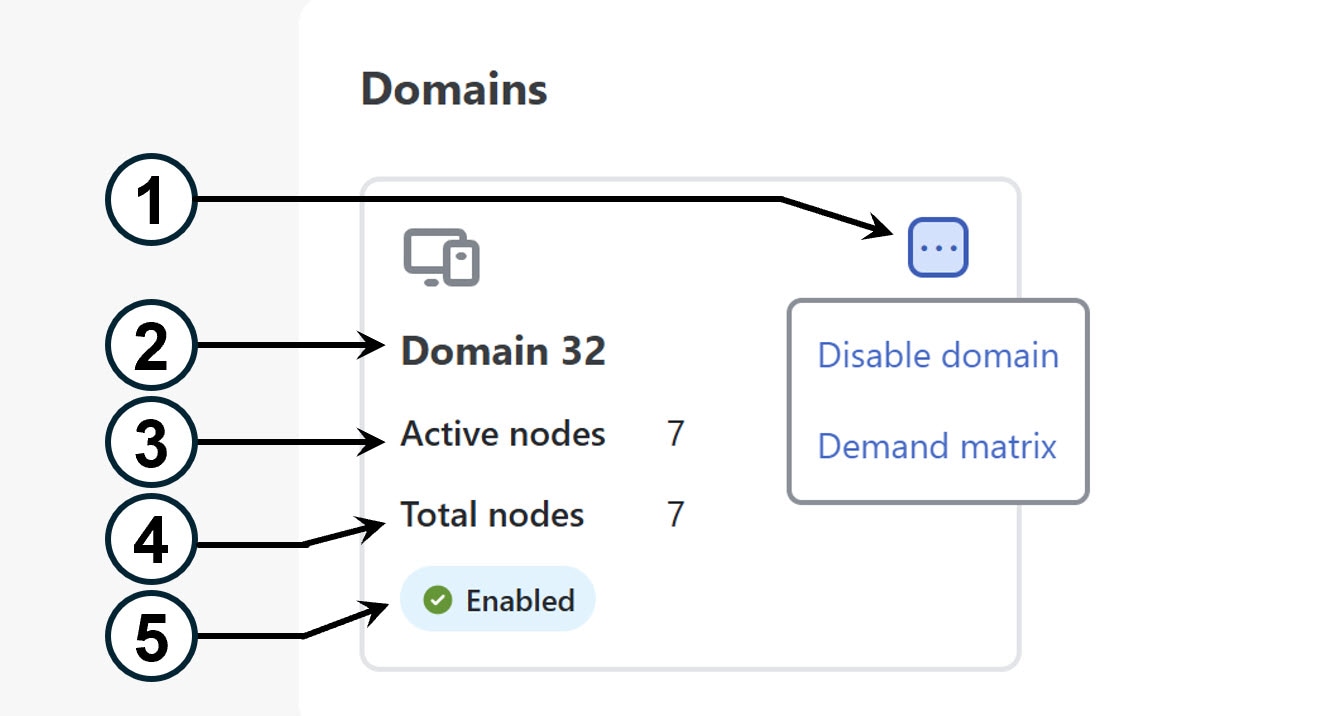
Figure 1. Demand matrix domains dashboard
Demand matrix domains dashboard
Callout No. Description

1

  • Enable domain: Enable the domain to start demand computation and visualization for that domain. By default, domains are in a disabled state.

  • Disable domain: Disable the domain to stop demand computation for that domain. You will not be able to see the demand matrix for this domain in a disabled state.

  • Demand matrix: View detailed traffic demand metrics for the domain on a topology map.

2

Domain identifier: The domain ID is taken from the router configuration (link-state instance-id) that is used to advertise IGP with BGP-LS.

3

Active nodes: Number of nodes in the domain that are actively sending SRv6 locator counter data to DDM.

4

Total nodes: Total nodes in the domain.

5

Status: Indicates whether DDM is enabled for the domain.


Configure global configurations

The Demand Matrix global configuration allows you to define system-wide settings that influence how the DDM operates across all monitored IGP domains. By adjusting these system-wide settings, you can influence the frequency of demand computations, filter out insignificant traffic, and manage debug logging as per your monitoring requirements. Configuration updates made here are also captured in the audit logs.

Procedure

1.

From the main menu, choose Services & Traffic Engineering > Demand matrix and click on the Global configuration tab.

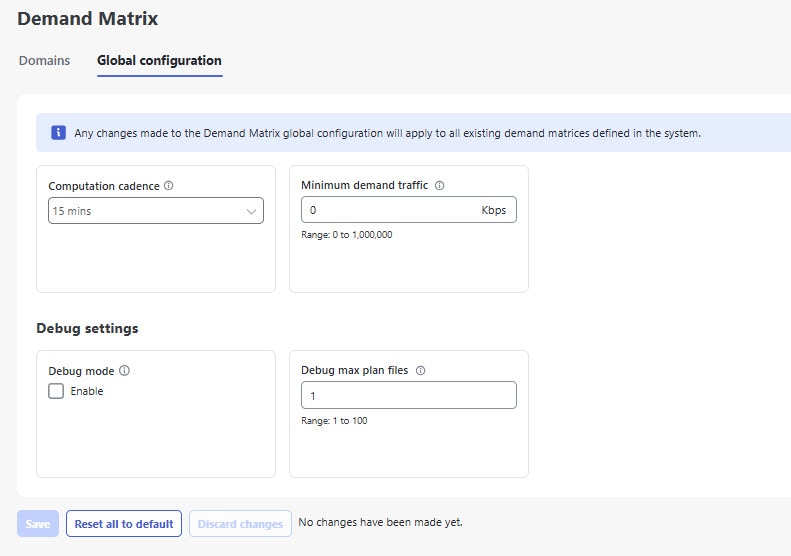
Figure 2. Demand Matrix global configuration
Demand Matrix global configuration
2.

Adjust the required settings.

Note

Any changes made to the Demand Matrix global configuration will apply to all existing demand matrices defined in the system.

  1. Computation Cadence: Select the frequency for demand matrix computation (15, 30, or 60 minutes). The default is 15 minutes. This cadence should be logically set to the same or a higher value than the polling frequency for the "SRv6 traffic accounting" performance policy.

  2. Minimum Demand Traffic: Set a minimum traffic threshold (default is 0 Kbps). Demands with traffic below this value will be excluded from visualization, allowing focus on significant traffic flows.

  3. Debug mode: Enable debug optimizer to log plan files to the Crosswork Network Controller file system. Files are saved to the maximum number of files you specify in Debug max plan files.

  4. Debug max plan files: Set the maximum number of debug plan files you would like to save. The default is 1.

3.

Click Save to save your configuration.


View demand matrix

The Demand Matrix interface is your primary tool for monitoring SRv6 traffic demands, offering both a comprehensive overview of domain-wide traffic, the ability to drill down into specific demand paths, and to view demands routed through a particular link.

Note

DDM operates strictly on a per-IGP domain basis. For traffic that crosses domain boundaries, it can accurately quantify the amount of traffic destined for an SRv6 locator in a neighboring domain. Within the current domain, you will see this traffic visualized as originating from the domain boundary router and extending to its destination within that domain. However, DDM cannot currently visualize the traffic's path beyond the current domain, meaning the full end-to-end path into the neighboring domain will not be displayed.

To view and monitor demand matrix, complete these steps:

Procedure

1.

From the main menu, choose Services & Traffic Engineering > Demand matrix > Enabled Domain-ID > More icon > Demand matrix.

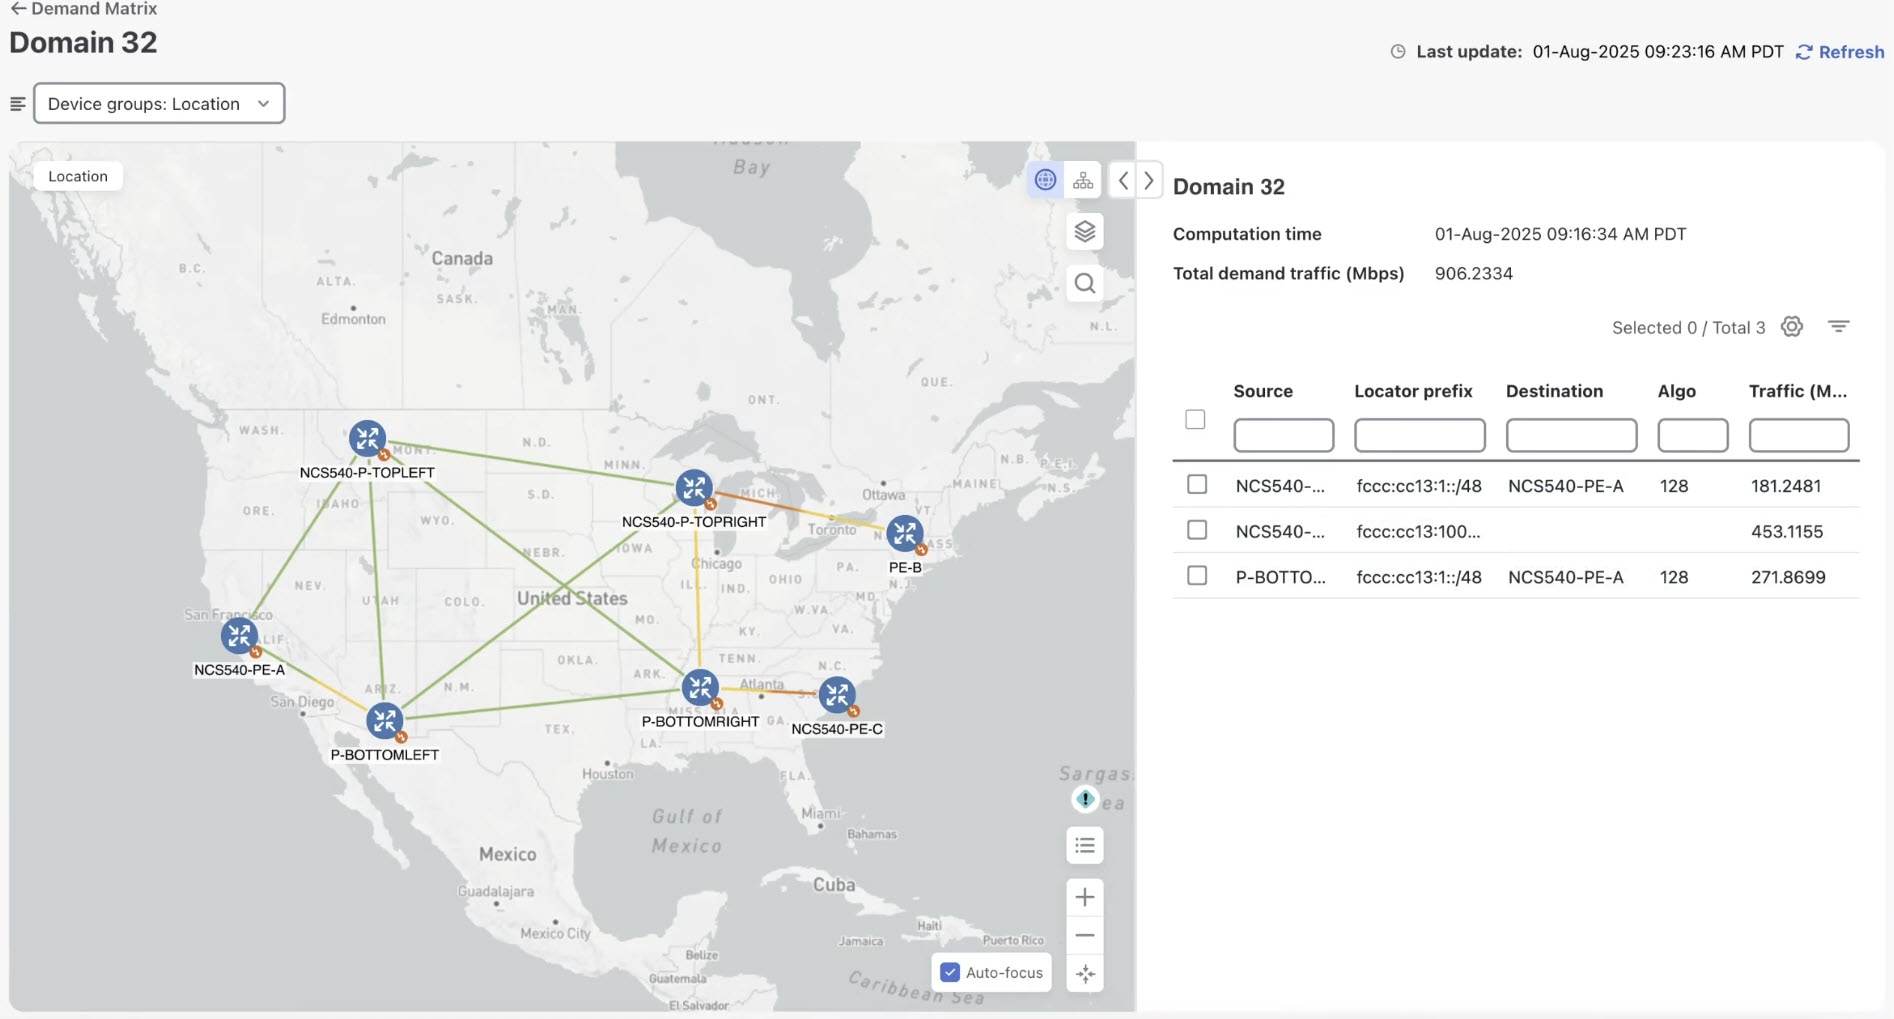
The Domain's demand matrix page is displayed with the different domain nodes in a topology map.

Figure 3. Demand matrix for a domain
Demand matrix for a domain

On the right-hand side, you can view the computation time (reflecting the configured cadence) and the total traffic volume across all demands in the domain. A table lists all individual demands, detailing their source, destination, locator prefixes, and traffic volume.

2.

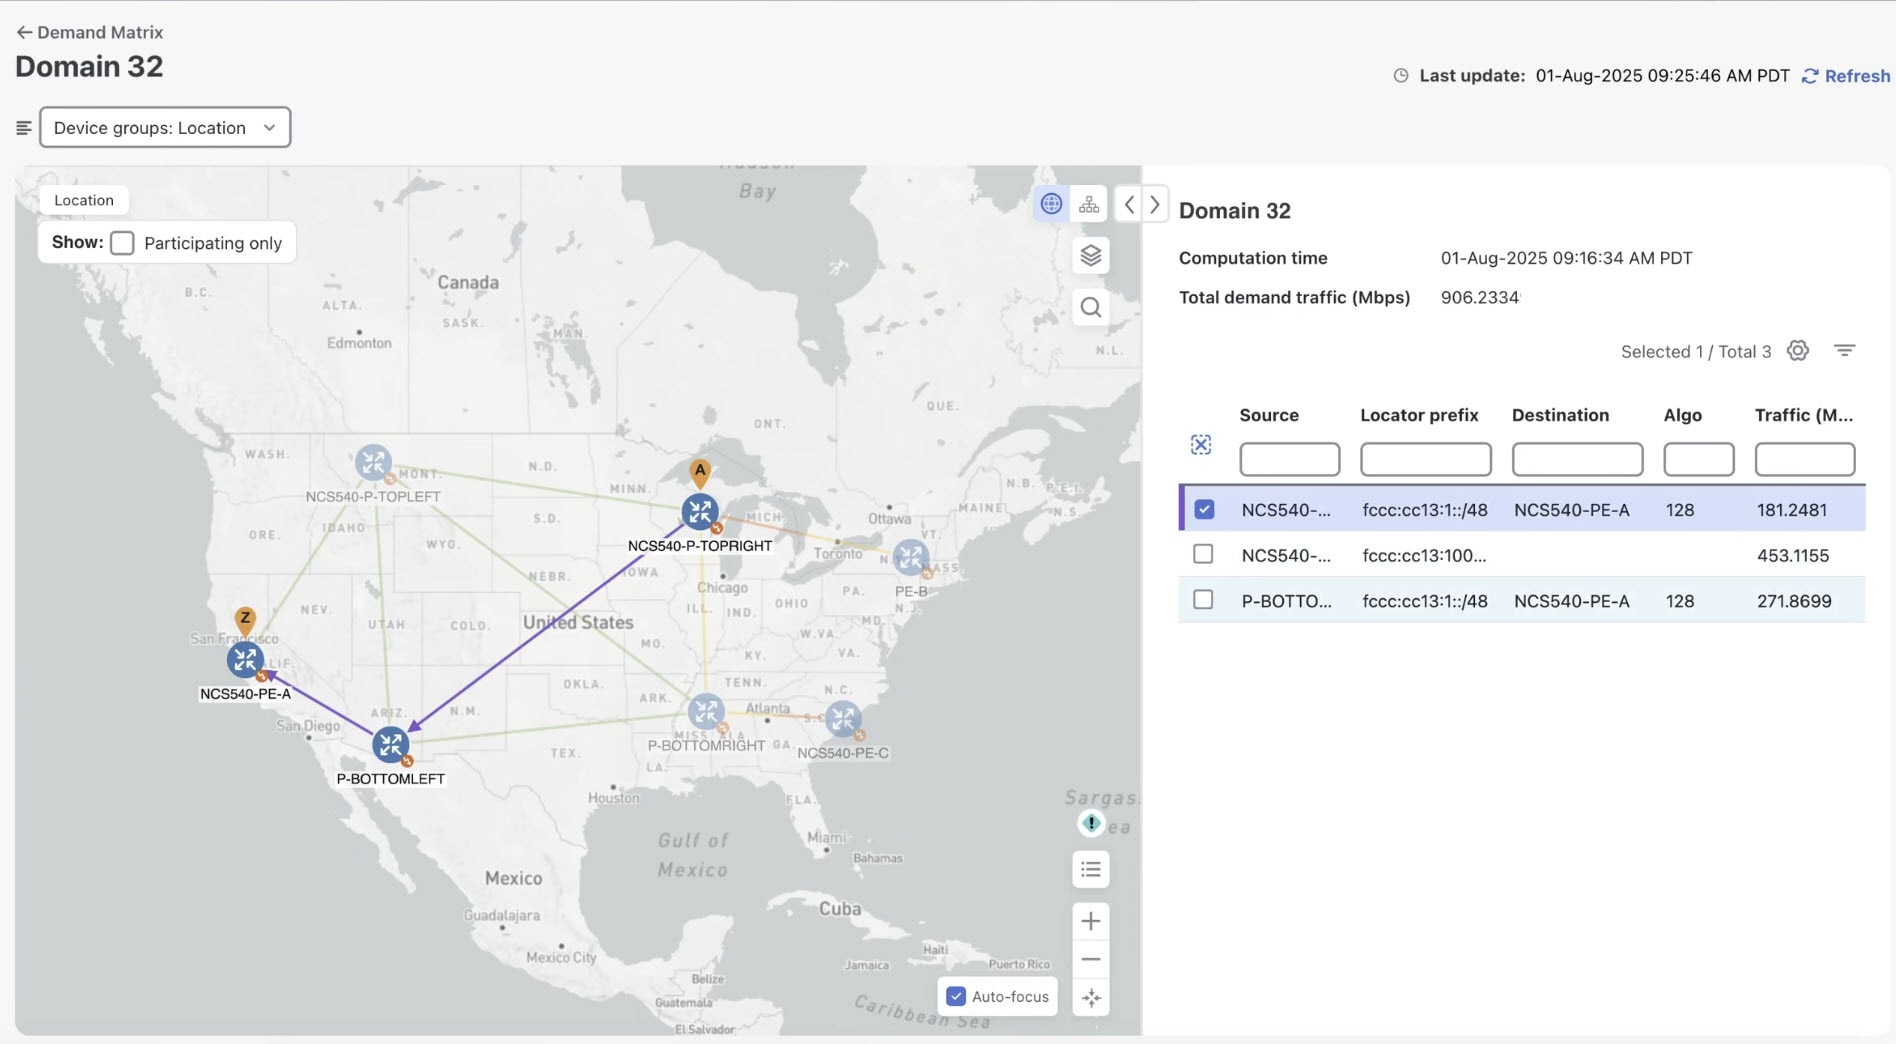
To visualize a specific demand's details, select it from the list. You can then see its IGP path from the source to the destination on the topology map, including details like the flexible algorithm used and traffic volume.

Figure 4. Visualize demand metric
Visualize demand metric
3.

You can filter metrics by Flex Algo. To visualize the flexible algorithm topology:

  1. On the topology map, click Display Preferences icon and then click Flex Algo.

  2. From the drop-down list, select the flexible algorithm ID (for example, 129) to filter.

  3. (Optional) Select Show selected Flex Algo topology only to isolate the flexible algorithms on the topology map.

  4. Click Apply to display the updated topology map.

    Figure 5. Flex algo in demand matrix
    Flex algo in demand matrix
4.

To view metrics for the IGP path:

  1. Select a demand metric from the table and click Display Preferences icon and then click Metrics.

  2. Toggle applicable metrics to On.

5.

To view demands routed through a particular link:

  1. On the topology map, click on a link.

  2. From the Links page, select View details for the link. This displays the Link details page.

  3. Click the Traffic engineering tab then click the Demands tab.

    All demands routed through this link are displayed. Along with other link details, the table also shows the ECMP split percentage between these demands and the flex algos using that link.