Cisco Routed Optical Networking Solution Guide, Release 4.0

PDF

Operate phase

Want to summarize with AI?

Log in

Overview

This section explains the operational monitoring activities for the sample deployment. It describes how to monitor ZR or ZR+ optics, NCS 1010 nodes, performance data, alarms, and service health after provisioning.

To monitor ZR or ZR+ optics, use EPNM and Crosswork Health Insights.

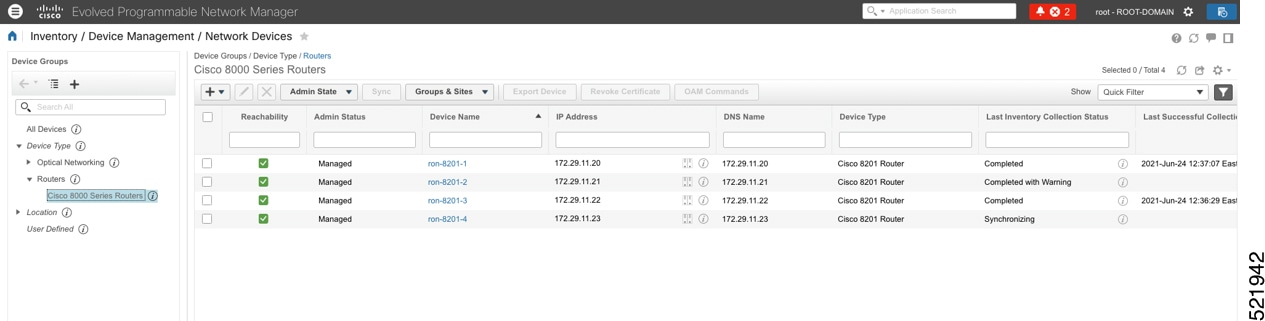
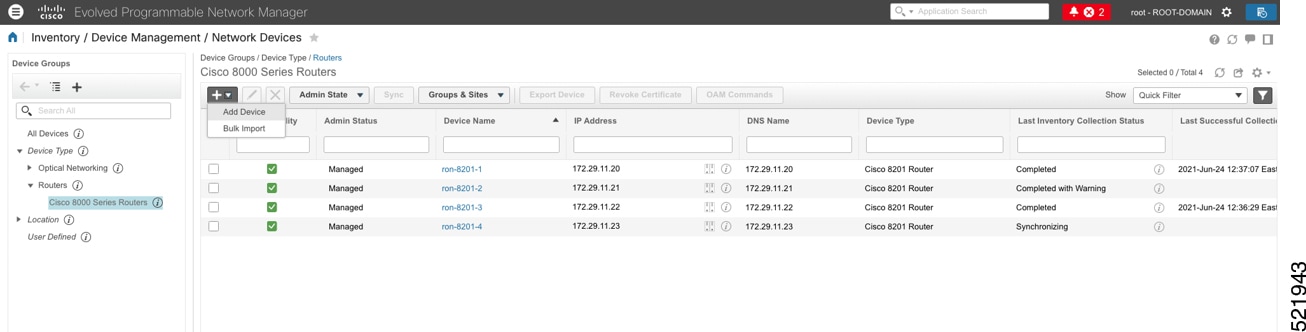
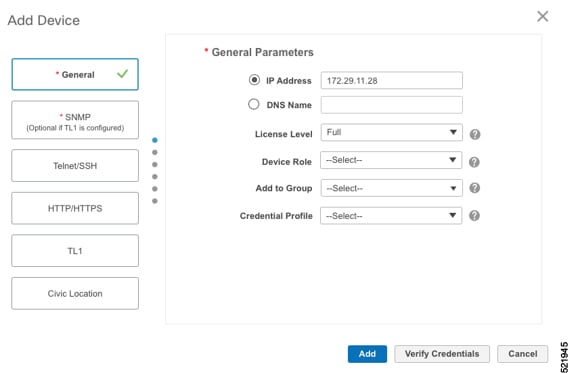
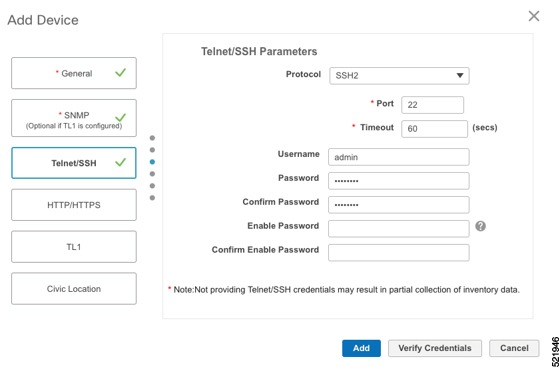
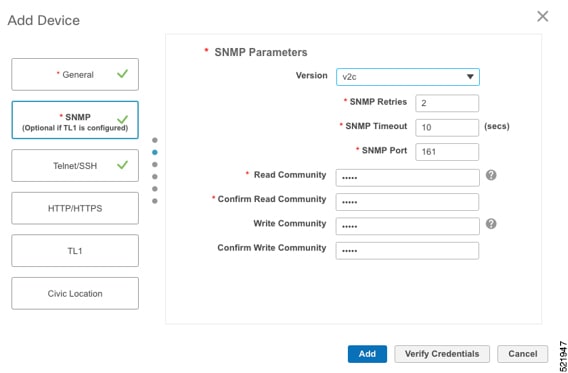
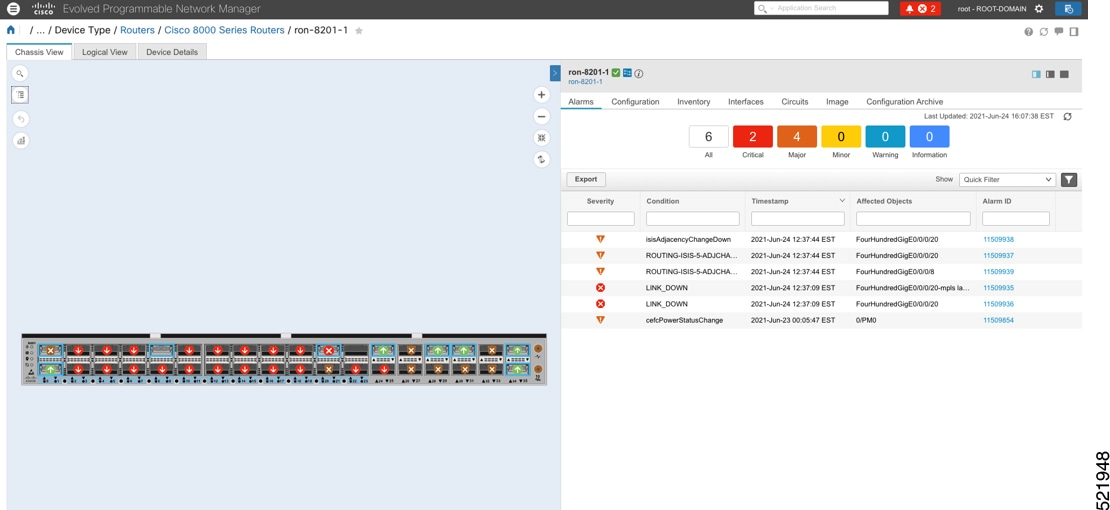
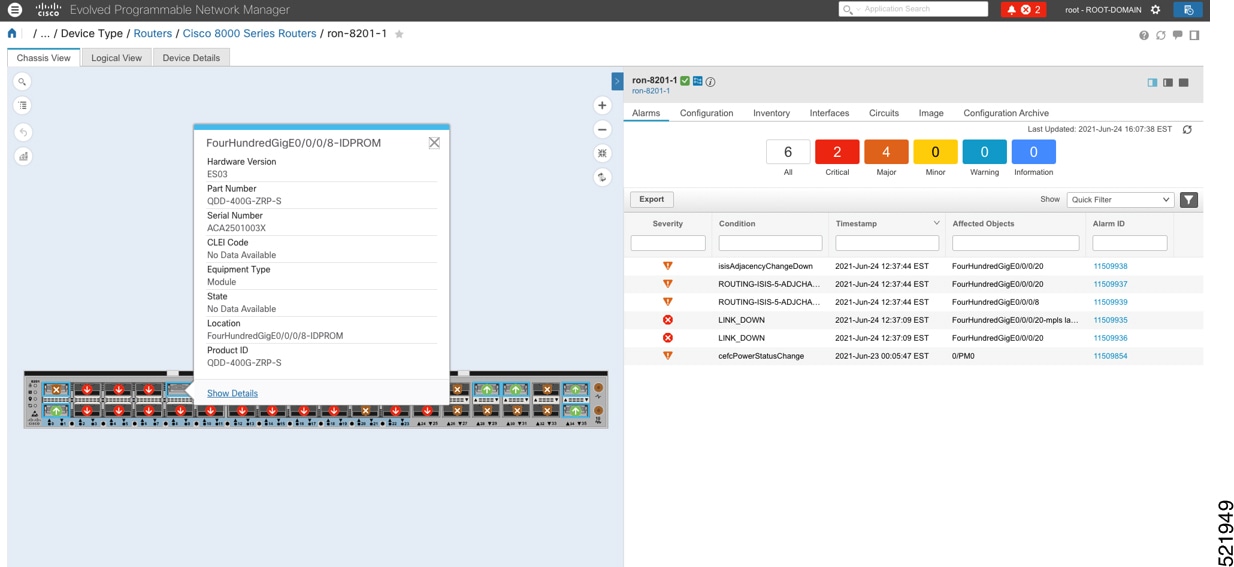
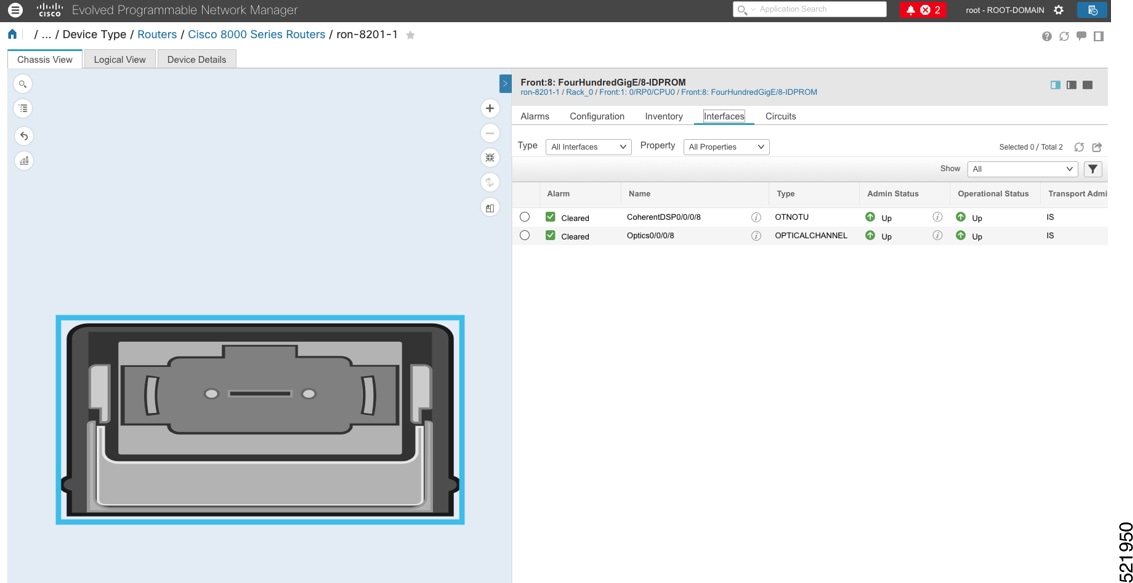
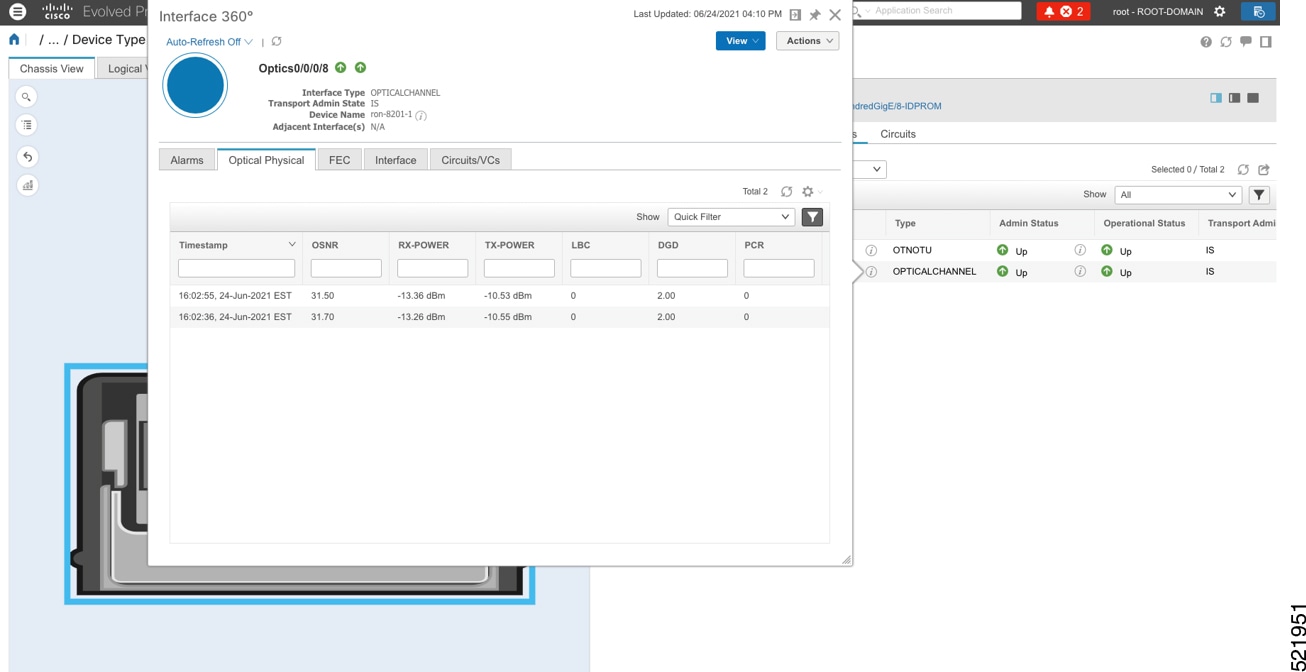
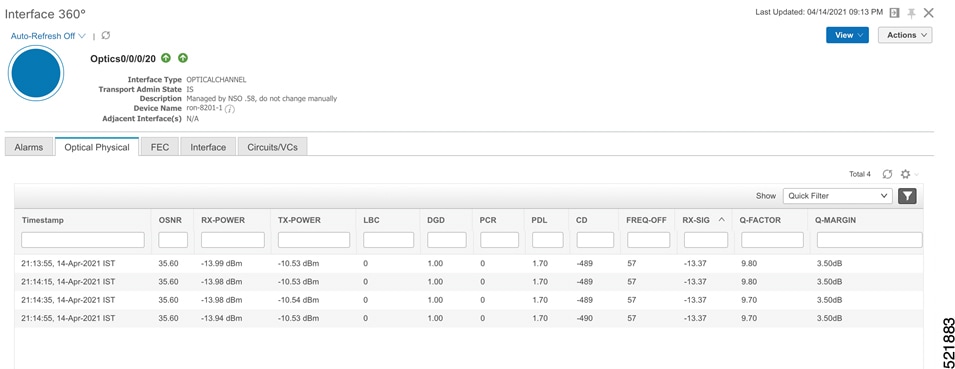
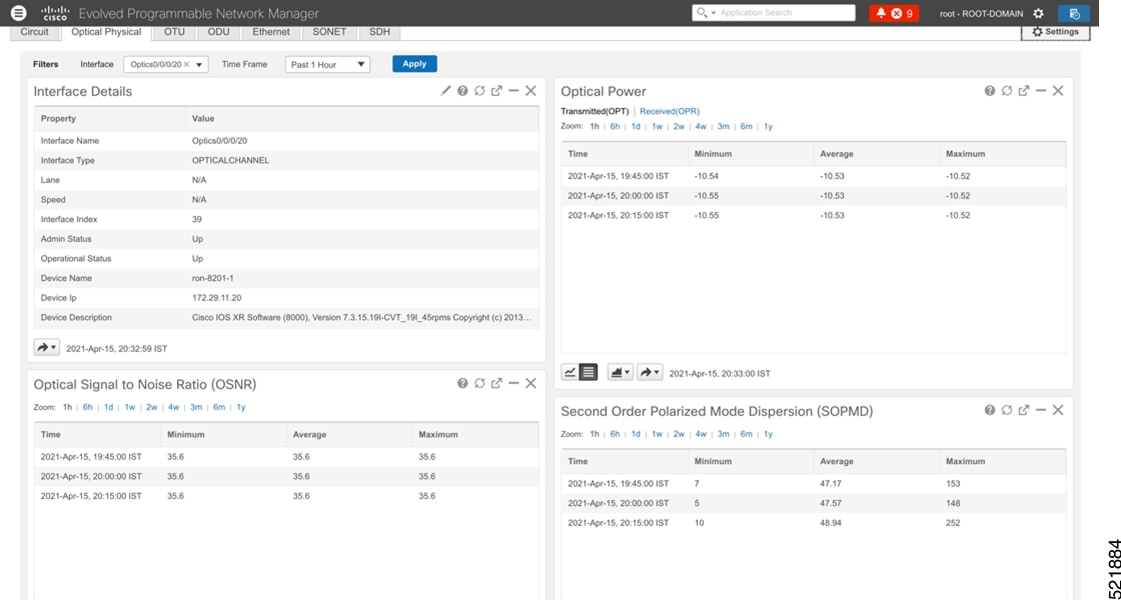
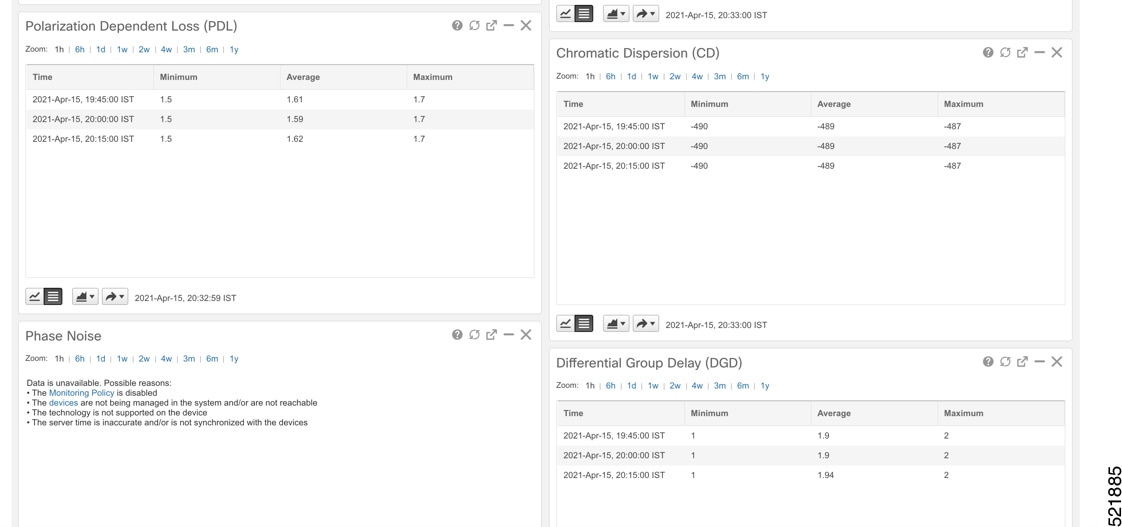
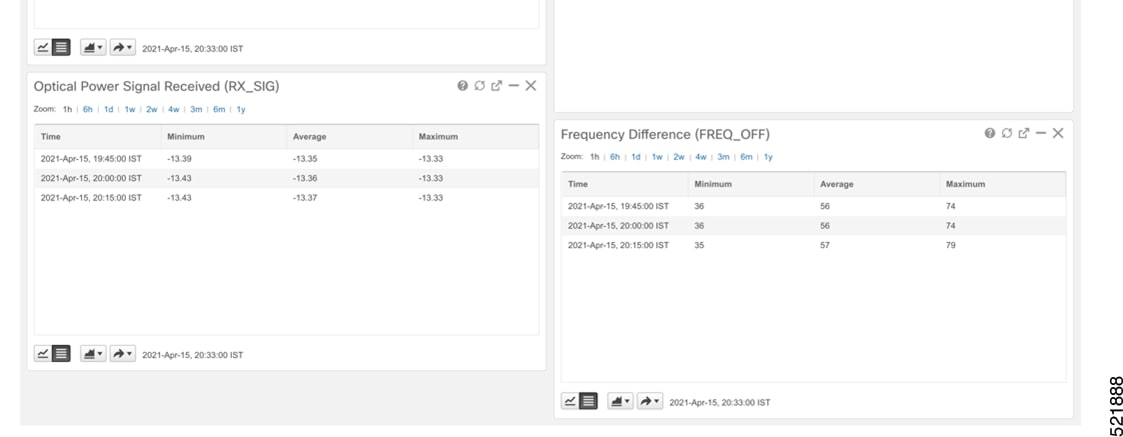
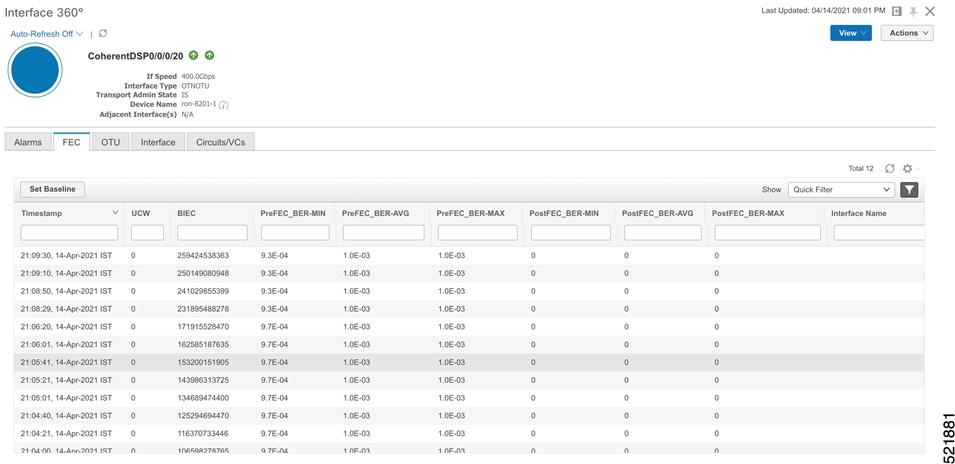
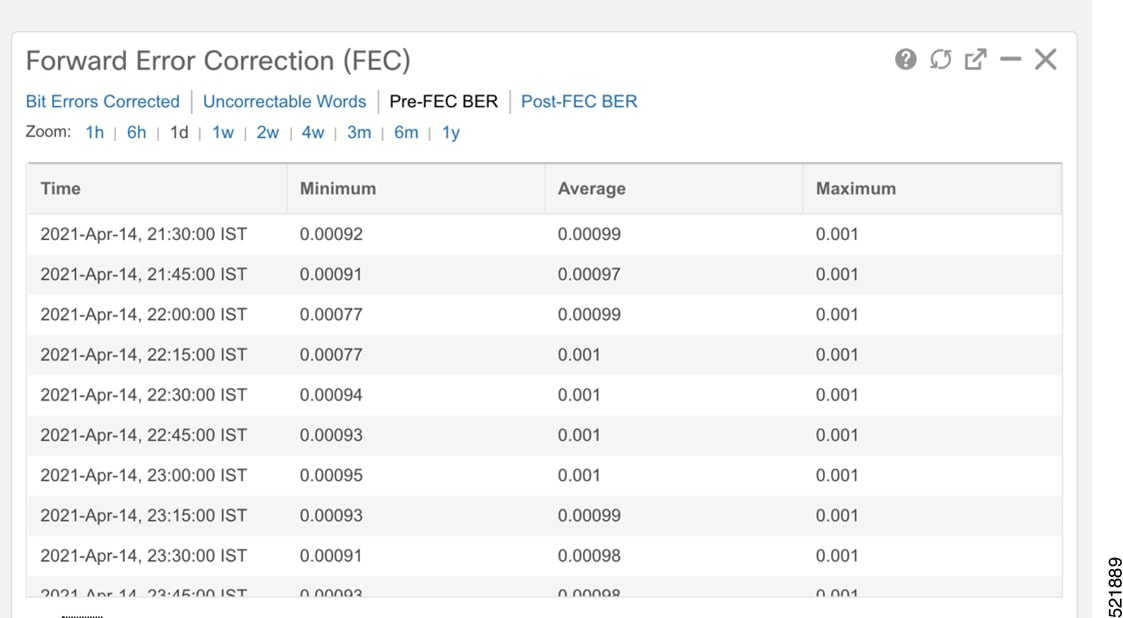
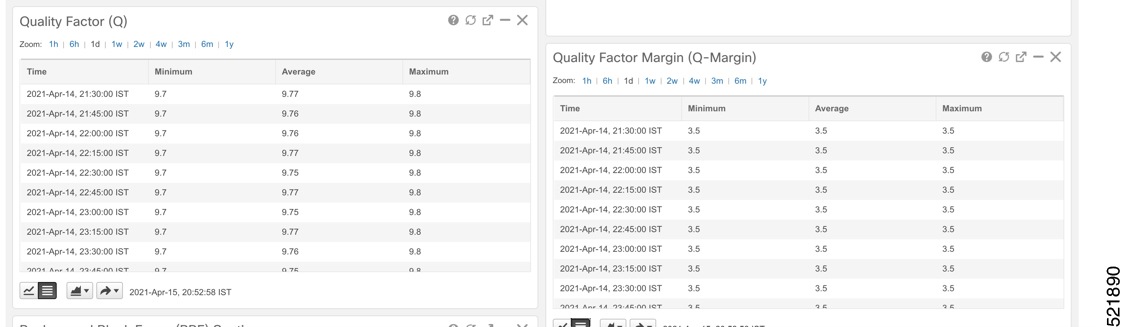
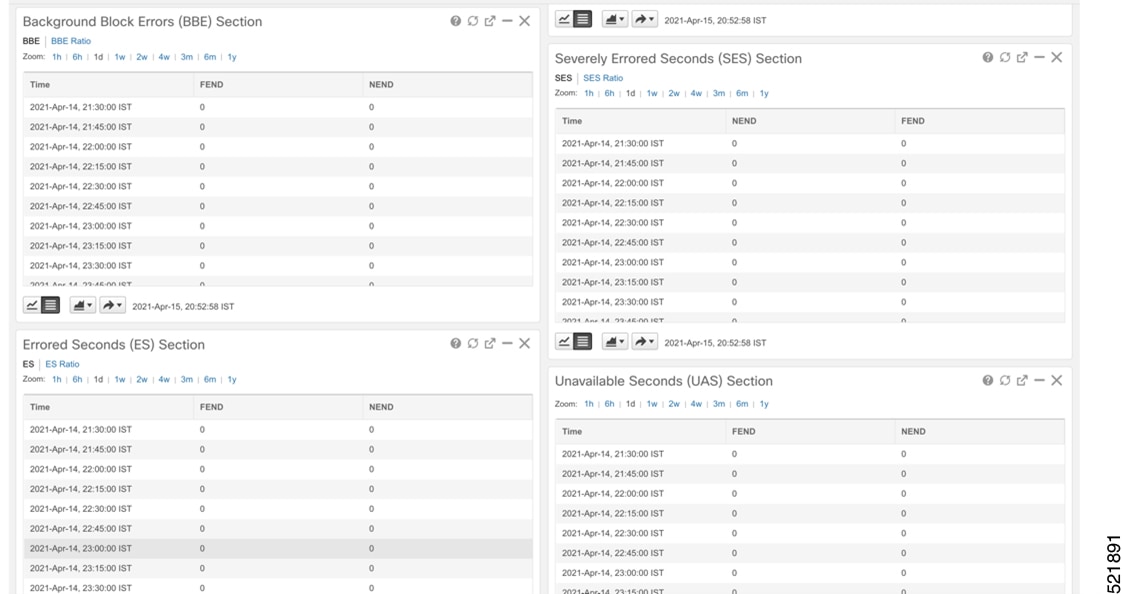
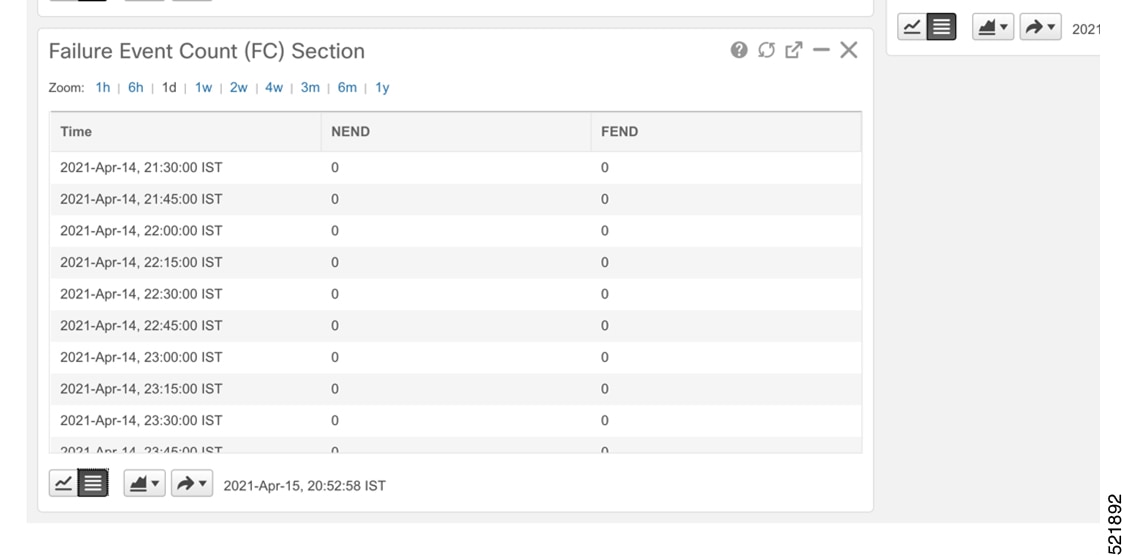
  1. Use either CLI commands or EPNM to monitor router ZR or ZR+ optics for proper operation. See Monitor ZR or ZR+ optics using EPNM.

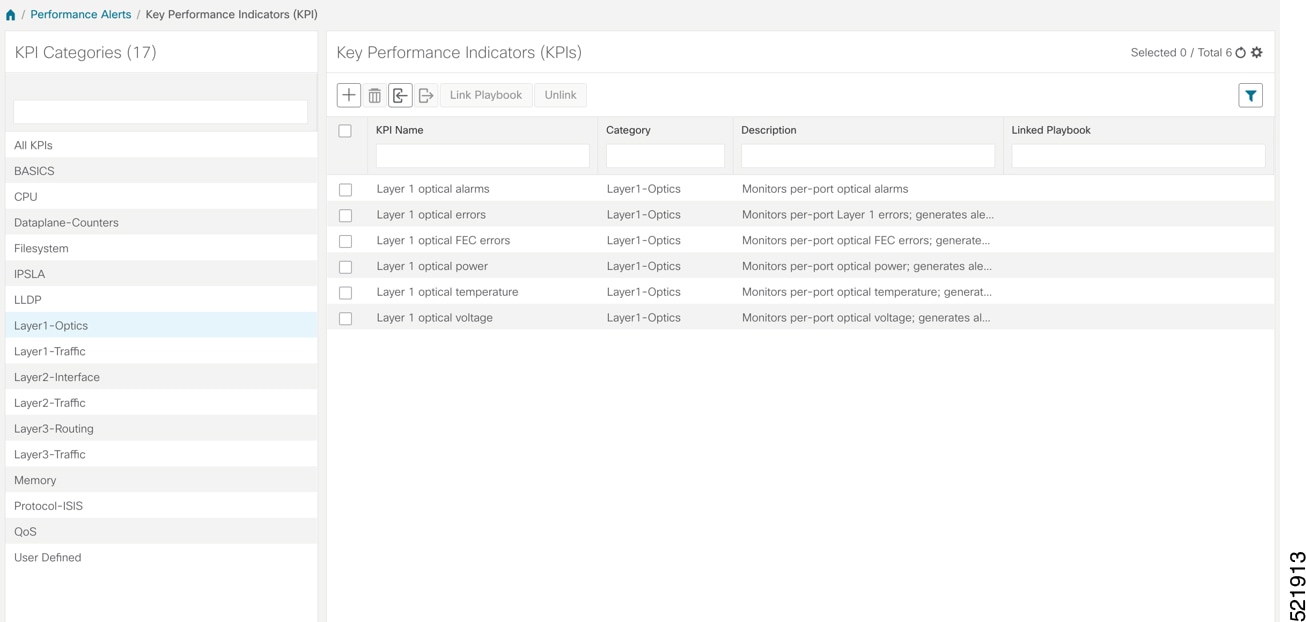
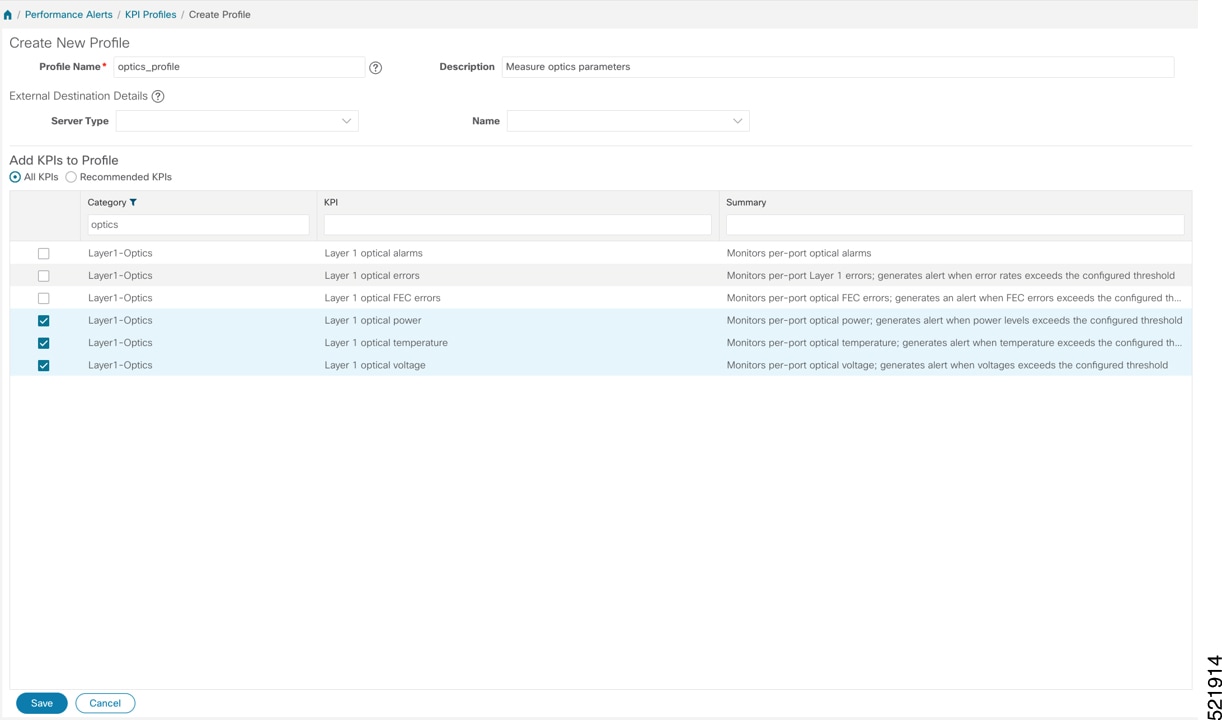
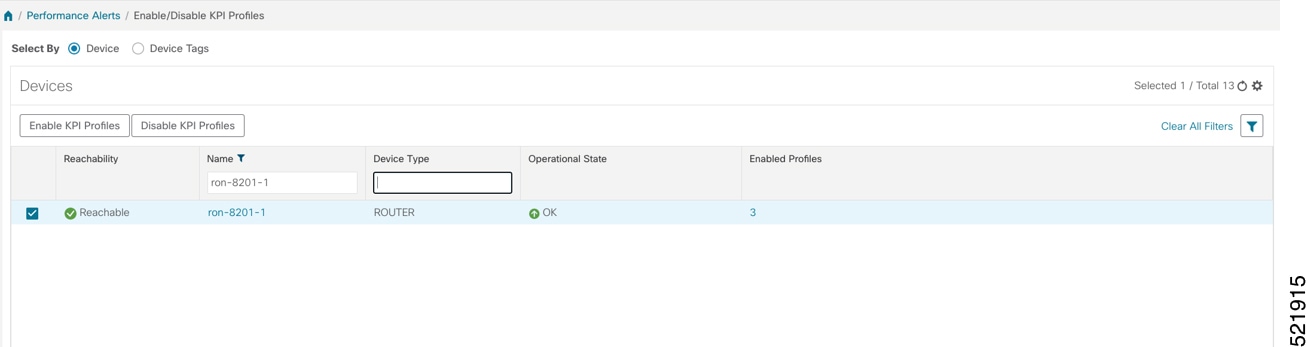
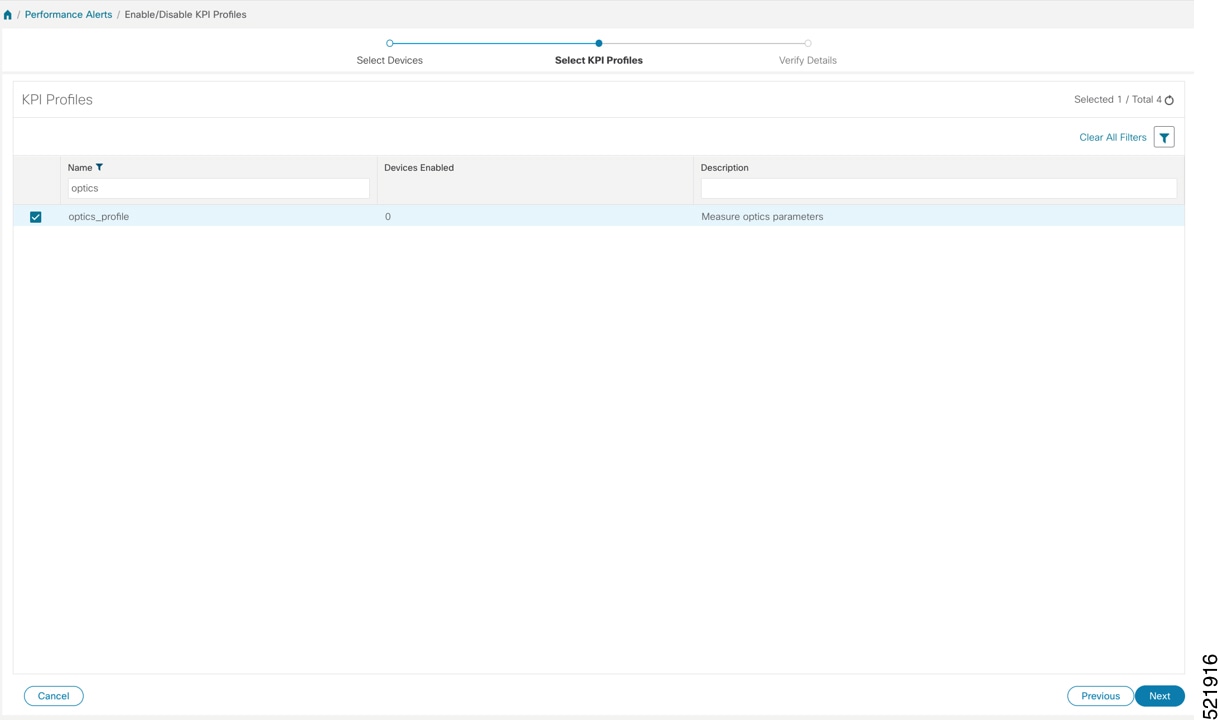
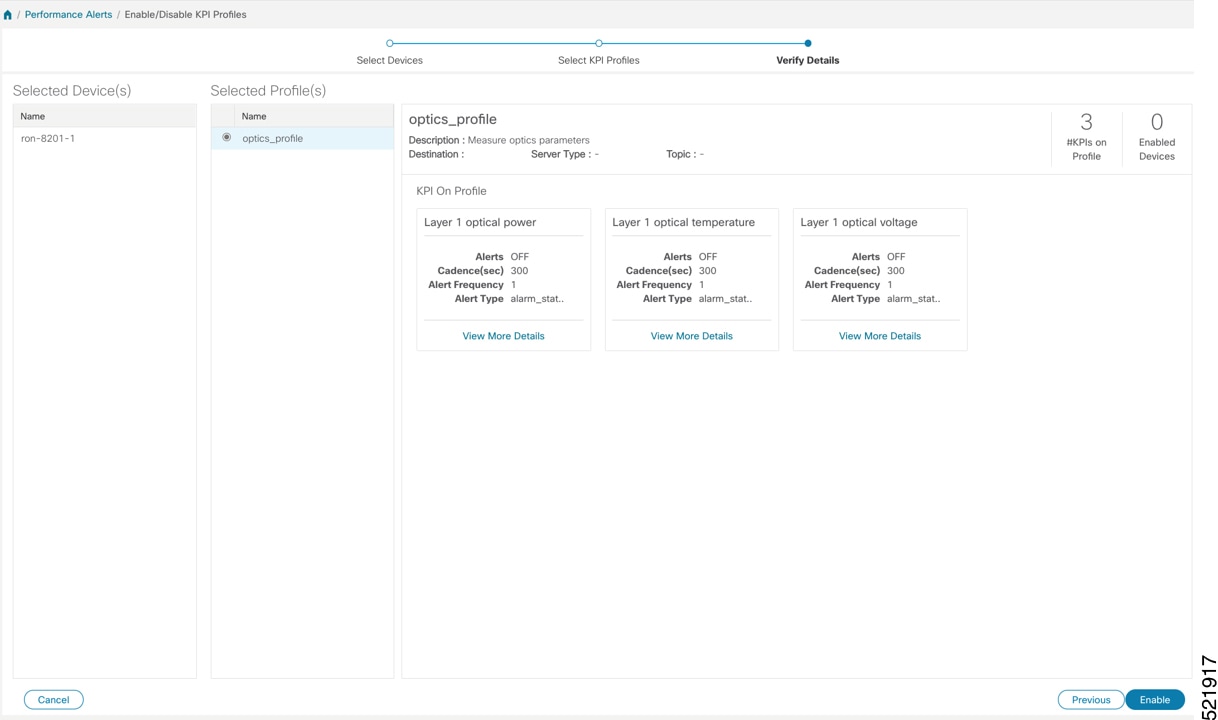
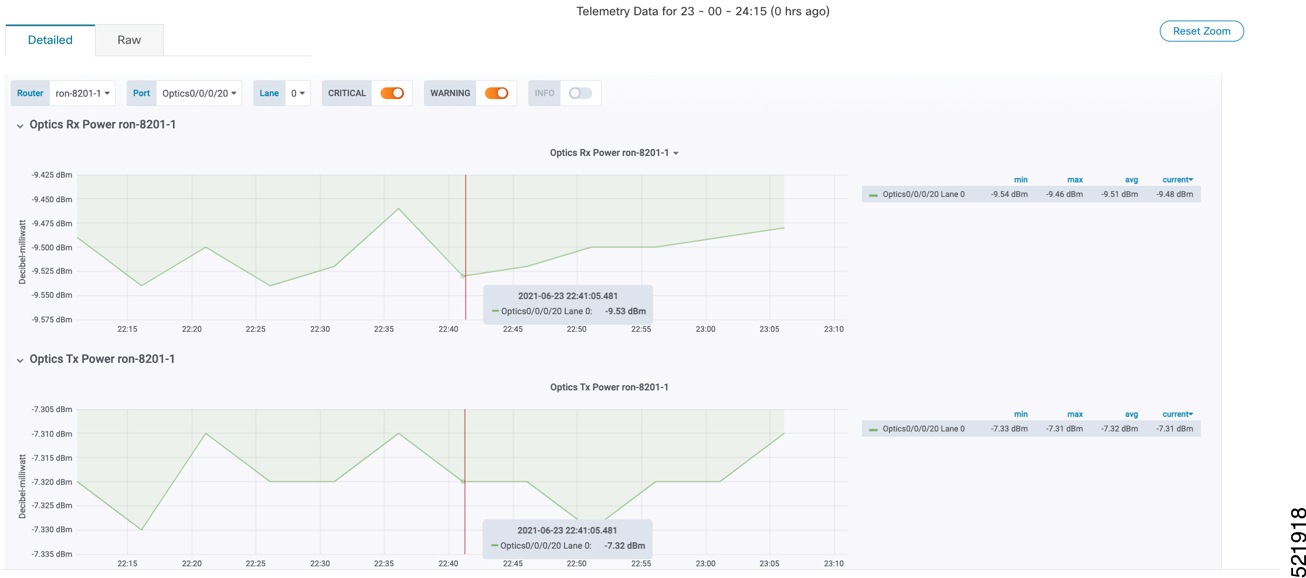
  2. (Optional) Setup router ZR or ZR+ optics data collection in Crosswork Health Insights. See Monitor ZR or ZR+ optics performance Using KPIs.

To monitor NCS 1010, use Cisco Optical Network Controller and Cisco Optical Site Manager.


Monitor ZR or ZR+ optics using EPNM

Follow these steps to add the 8201 router to EPNM for monitoring the PM parameters on the ZR or ZR+ optics.

Procedure

1.

Choose Inventory > Device Management > Network Devices to add a new device to EPNM. Click Routers or a subgroup if it is already defined in the left panel.

Network device pane
2.

Click the icon above the Network Devices table, then choose Add Device.

Add device
3.

Configure the General, SNMP, and SSH parameters as shown in the figures. Then click Verify Credentials to confirm that Cisco EPN Manager can reach the device. Click Add to add the device to EPNM.

General parameters
SNMP parameters
4.

Click the device name link in the Network Devices table to open the chassis view. This figure shows the chassis view of the 8201 router.

Chassis view
5.

Click the QSFP-DD ZR+ port to view details about that port.

Chassis view

Here, you can view the port, the specific optical channel, and the CoherentDSP entities.

QDD-400G-ZRP-S details
6.

Click the additional information icon for the optical channel. Then select the Optical Physical measurement tab to display relevant optical PM values such as RX/TX signal power and OSNR values.

Optical physical parameters
7.

Click the additional information icon for the coherent DSP. Then select the FEC measurement tab to display relevant coherent DSP FEC statistics such as PreFEC Bit Error Rate, Bit Error Rate Count (BIEC), and Uncorrected Words (UCW). The UCW value must remain 0.

FEC parameters

These figures display EPNM monitoring data relevant to ZR or ZR+ optics, including current and historical performance.

Figure 1. Optical physical parameters
Optical physical parameters
Figure 2. Historical optical physical parameters
Historical optical physical parameters
Figure 3. Historical optical physical parameters
Historical optical physical parameters
Figure 4. Historical optical physical parameters
Historical optical physical parameters
Figure 5. FEC parameters
FEC parameters
Figure 6. Historical FEC parameters
Historical FEC parameters
Figure 7. Historical FEC parameters
Historical FEC parameters
Figure 8. Historical OTN parameters
Historical OTN parameters
Figure 9. Historical OTN parameters
Historical OTN parameters

Monitor ZR or ZR+ optics performance Using KPIs

The purpose of the task is to enable KPI monitoring for ZR or ZR+ optics to track device health using Health Insights.

Use the KPIs supplied by Cisco to monitor specific network optics. Configure and enable KPI profiles on devices to start health monitoring.

Note

Decide which KPIs supplied by Cisco to use for each device based on its function and the performance characteristics you want to monitor. Review the KPIs supplied by Cisco documented in List of Health Insights KPIs. The image shows the available default L1 optics KPIs.

Key performance indicators

Procedure

1.

Group the relevant KPIs to create a KPI Profile focused on optics.

A KPI profile can have many different KPIs assigned. In this procedure, add only specific optics KPIs to the optics_profile KPI profile.

KPI profile

See Create a New KPI Profile.

2.

Enable the appropriate KPI Profile on target devices you want to monitor.

  1. From the main menu, choose Performance Alerts > Enable/Disable KPI Profiles.

  2. Check the checkboxes for all nodes where you want to apply the profile.

  3. Choose the KPI profile and click Enable KPI Profiles.

You can select multiple nodes. The image shows the KPI profile being applied to a single node.

KPI profile
3.

Select the optics_profile KPI profile and click Next to finalize enabling the KPI for the selected devices.

KPI profile
4.

Apply the configuration and click Enable to start streaming telemetry sensor data for optics KPIs.

5.

View alerts from network devices as the system begins monitoring.

See View Alerts for Network Devices

This image shows the RX and TX power of the QDD-400G-ZR-S transceiver.

RX and TX power of the QDD-400G-ZR-S

Devices begin streaming telemetry data for selected optics KPIs, and alerts become available in Health Insights.