Segment Routing v6 Configuration Guide for Cisco 8000 Series Routers, Cisco IOS XR Releases

PDF

Segment Routing v6 Configuration Guide for Cisco 8000 Series Routers, Cisco IOS XR Releases

Delay measurement

Want to summarize with AI?

Log in

Explains how one-way, two-way, loopback, and endpoint measurements use TWAMP-based probes to monitor delay, verify SLAs, and troubleshoot path-performance problems.


Delay measurement is a network performance monitoring method that

  • measures the latency or delay experienced by data packets when they traverse a network

  • uses the IP/UDP packet format defined in simple TWAMP using RFC8972 for probes, and

  • employs time stamps applied at the echo destination (reflector) to enable greater accuracy for two-way or round-trip measurement capabilities.

Table 1. Feature History Table

Feature Name

Release Information

Feature Description

Delay Measurement

Release 25.4.1

Introduced in this release on: Fixed Systems (8010 [ASIC: A100])(select variants only*)

*This feature is supported on:

  • 8011-32Y8L2H2FH

  • 8011-12G12X4Y-A/D

Delay Measurement

Release 25.1.1

Introduced in this release on: Fixed Systems (8010 [ASIC: A100])(select variants only*)

Delay measurement in SR networks involves monitoring the end-to-end delay experienced by traffic sent over an SR policy. Link delay metrics such as average, minimum, and maximum delay, and delay variance are used to determine network latency. You can ensure compliance with Service Level Agreements (SLAs) by monitoring the end-to-end delay experienced by traffic.

*This feature is now supported on Cisco 8011-4G24Y4H-I routers.

Two-Way Active Measurement Protocol

The Two-Way Active Measurement Protocol (TWAMP) is a network measurement protocol used for measuring two-way or round-trip IP performance metrics, such as latency (delay) and packet loss, between any two devices in a network. It adds two-way or round-trip measurement capabilities. In the case of TWAMP Light, the Session-Reflector doesn’t necessarily know about the session state. The Session-Reflector simply copies the Sequence Number of the received packet to the Sequence Number field of the reflected packet. The controller then receives the reflected test packets and collects two-way metrics. This architecture allows for the collection of two-way metrics.

Benefits of delay measurement

Delay measurement offers several key benefits for network management:

  • Network troubleshooting: You can quickly and easily identify areas in your network with high delay and resolve network problems using delay measurement.

  • Network planning and optimization: You can easily understand the performance of your network under various conditions and design a network that can handle expected traffic loads.

  • Quality of Service (QoS): You can ensure quality of service standards are being met by continuously monitoring the delay in your network.
Measurement modes

SRv6 performance measurement supports three distinct modes for measuring delay: One-way, Two-way, and Loopback.

Each mode offers different capabilities and hardware requirements to assess network latency.

Table 2. Measurement Mode Requirements

Measurement Mode

One-way

Two-way

Loopback

Description

One-way measurement mode is a delay measurement mode that offers the most precise form of one-way delay measurement.

Two-way measurement mode is a delay measurement mode that focuses on measuring round-trip network performance. It provides two-way delay measurements.

Loopback measurement mode is a delay measurement mode that utilizes a loopback mechanism for delay measurement. It provides both two-way and one-way delay measurements.

Formula used for calculation

Delay measurement in one-way mode is calculated as (T2 – T1).

Delay measurement in two-way mode is calculated as ((T4 – T1) – (T3 – T2))/2.

Delay measurements in Loopback mode are calculated as follows:

  • Round-Trip Delay = (T4 – T1)

  • One-Way Delay = Round-Trip Delay/2

Sender:

PTP-Capable HW and HW Timestamping

Required

Required

Required

Reflector:

PTP-Capable HW and HW Timestamping

Required

Required

Not Required

PTP Clock Synchronization between Sender and Reflector

Required

Not Required

Not Required


How one-way delay measurement works

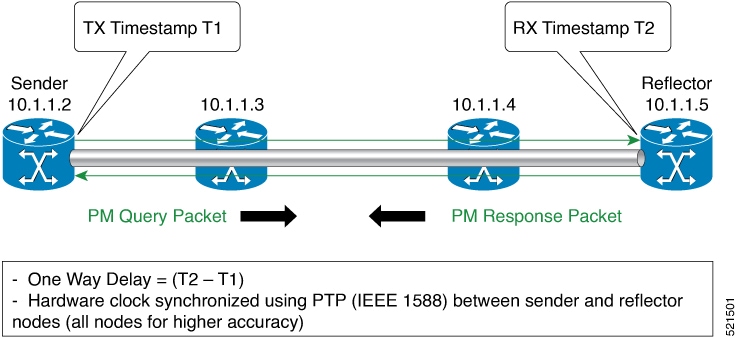
Delay measurement in one-way mode is calculated as (T2 – T1)

Summary

The one-way delay measurement process involves a local-end router and a remote-end router exchanging PM query and response packets with hardware timestamps to precisely calculate the one-way delay.

Workflow

Figure 1. One-Way

These stages describe how one-way delay measurement works:

  1. The local-end router sends PM query packets periodically to the remote side once the egress line card on the router applies timestamps on packets.

  2. The ingress line card on the remote-end router applies time-stamps on packets as soon as they are received.

  3. The remote-end router sends the PM packets containing time-stamps back to the local-end router.

  4. One-way delay is measured using the time-stamp values in the PM packet.


How loopback delay measurement works

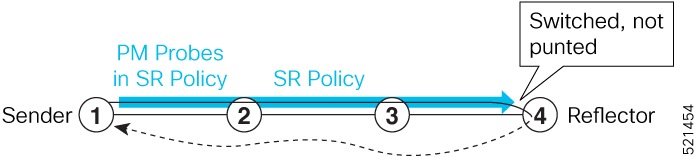
Loopback measurement mode provides both two-way and one-way delay measurements. PTP-capable hardware and hardware timestamping are required on the Sender, but are not required on the Reflector. Delay measurements in Loopback mode are calculated as follows:

Round-Trip Delay = (T4 – T1) and One-Way Delay = Round-Trip Delay/2.

Summary

The loopback delay measurement process involves a local-end router sending probe packets that are looped back by an endpoint node without timestamping, allowing the local-end router to calculate round-trip and one-way delays.

Workflow

Figure 2. Loopback

These stages describe how loopback delay measurement works:

  1. The local-end router sends PM probe packets periodically on the SR Policy.

  2. The egress line card on the local-end router applies timestamps (T1) on these packets.

  3. The probe packets are looped back on the endpoint node (not punted), with no timestamping performed on the endpoint node.

  4. The local-end router timestamps the looped-back packet (T4) as soon as it is received.

Delay measurement for IP Endpoint

Delay for an IP endpoint is the amount of time that

  • it takes for a data packet to travel from a source device to a specific IP endpoint within a network

  • is measured by sending a probe packet from a source device to the target IP endpoint and recording the time from departure to arrival, and

  • can be measured as one-way, two-way, roundtrip, or in loop-back mode.

Table 3. Feature History Table

Feature Name

Release Information

Feature Description

Delay Measurement for IP Endpoint over SRv6 Network

Release 25.4.1

Introduced in this release on: Fixed Systems (8010 [ASIC: A100])(select variants only*)

*This feature is supported on:

  • 8011-32Y8L2H2FH

  • 8011-12G12X4Y-A/D

Delay Measurement for IP Endpoint over SRv6 Network

Release 25.1.1

Introduced in this release on: Fixed Systems (8010 [ASIC: A100])(select variants only*)

*This feature is supported on Cisco 8011-4G24Y4H-I routers.

Delay Measurement for IP Endpoint over SRv6 Network

Release 24.4.1

Introduced in this release on: Fixed Systems (8200 [ASIC: P100], 8700 [ASIC: P100, K100])(select variants only*); Modular Systems (8800 [LC ASIC: P100])(select variants only*)

* This feature is supported on:

  • 8212-48FH-M

  • 8711-32FH-M

  • 8712-MOD-M

  • 88-LC1-36EH

  • 88-LC1-12TH24FH-E

  • 88-LC1-52Y8H-EM

Delay Measurement for IP Endpoint over SRv6 Network

Release 24.2.11

In Segment Routing over an IPv6 network (SRv6), you can measure packet delay from the source to a specific IP endpoint. You can use this information for troubleshooting, network maintenance, and optimizing network performance.

Additionally, you can use flow labels to verify the delay of each subsequent hop path towards the IP endpoint of that path. So that, when network traffic is distributed across multiple available paths towards an IP endpoint, delay measurement tracks the delay of each of these paths towards the IP endpoint.

The feature introduces these changes:

CLI:

YANG Data Model:

  • Cisco-IOS-XR-um-performance-measurement-cfg

  • Cisco-IOS-XR-perf-meas-oper.yang

(See GitHub, YANG Data Models Navigator)

Supported features for delay measurement for IP Endpoint

  • IPv6 Endpoint Delay in Default VRF (over SRv6)

  • SRv6 Endpoint Delay in Default VRF (Endpoint can be Node SID, Flex-Algo SID, Packed uSID carrier)

  • IPv6 Endpoint Delay in VRF (static uDT6)

  • IPv6 Endpoint Delay in VRF (dynamic uDT6 encap)

  • IPv4 Endpoint Delay in VRF or GRT (static uDT4)

  • IPv4 Endpoint Delay in VRF or GRT (dynamic uDT4 encap)

IP endpoint probe statistics collection

  • Statistics associated with the probe for delay metrics are available via Histogram and Streaming Telemetry.

  • Model Driven Telemetry (MDT) is supported for the following data:

    • Summary, endpoint, session, and counter show command bags.

    • History buffers data

  • Model Driven Telemetry (MDT) and Event Driven Telemetry (EDT) are supported for the following data:

    • Delay metrics computed in the last probe computation-interval (event: probe-completed)

    • Delay metrics computed in the last aggregation-interval; that is, end of the periodic advertisement-interval (event: advertisement-interval expired)

    • Delay metrics last notified (event: notification-triggered)

  • These xpaths for MDT/EDT is supported:

    • Cisco-IOS-XR-perf-meas-oper:performance-measurement/nodes/node/endpoints/ endpoint-delay/endpoint-last-probes

    • Cisco-IOS-XR-perf-meas-oper:performance-measurement/nodes/node/endpoints/ endpoint-delay/endpoint-last-aggregations

    • Cisco-IOS-XR-perf-meas-oper:performance-measurement/nodes/node/endpoints/ endpoint-delay/endpoint-last-advertisements


Usage guidelines for delay measurement for IP Endpoint

PTP-capable hardware

SR PM is supported only on hardware that supports Precision Time Protocol (PTP). This requirement applies to both one-way and two-way delay measurement.

Custom segment lists for delay measurement probes

You can specify a custom labeled path through one or more user-configured segment-lists. A user-configured segment-list defines the forwarding path from the sender to the reflector when the probe operates in delay-measurement mode. Examples of such custom segment lists include:

  • A segment-list that includes a Flex-Algo prefix SID of the endpoint.

  • A segment-list that includes a SID-list with labels to reach the endpoint or the sender (forward direction).

  • A segment-list that includes a BSID associated with an SR policy to reach the endpoint.

Unsupported features

These features are not supported for delay measurement for IP Endpoint:

  • Endpoint segment list configuration under a nondefault VRF.

  • Liveness sessions without a segment list for an endpoint in a non-default VRF.

  • SR Performance Measurement endpoint sessions over a BVI interface.


Configure IP Endpoint delay measurement over SRv6 network

Procedure

  1. Configure the IP Endpoint delay measurement.

    Example:

    
    RP/0/RSP0/CPU0:ios#configure
    RP/0/RSP0/CPU0:ios(config)#performance-measurement
    RP/0/RSP0/CPU0:ios(config-perf-meas)#endpoint ipv6 FCBB:0:1::
    RP/0/RSP0/CPU0:ios(config-pm-ep)#delay-measurement
    RP/0/RSP0/CPU0:ios(config-pm-ep-dm)#delay-profile name test
    RP/0/RSP0/CPU0:ios(config-pm-ep-dm)#exit
    RP/0/RSP0/CPU0:ios(config-pm-ep)#exit
    RP/0/RSP0/CPU0:ios(config-perf-meas)#liveness-profile name test
    RP/0/RSP0/CPU0:ios(config-pm-ld-profile)#probe
    RP/0/RSP0/CPU0:ios(config-pm-ld-probe)#flow-label explicit 100 200 300
    RP/0/RSP0/CPU0:ios(config-pm-ld-probe)#

    The following example shows how to use flow label for delay profile for a default endpoint:

    
    RP/0/RSP0/CPU0:ios#configure
    RP/0/RSP0/CPU0:ios(config)#performance-measurement
    RP/0/RSP0/CPU0:ios(config-perf-meas)#delay-profile endpoint default          
    RP/0/RSP0/CPU0:ios(config-pm-dm-ep)#probe 
    RP/0/RSP0/CPU0:ios(config-pm-dm-ep-probe)#flow-label explicit 100 200 300
  2. Verify the show running configuration.

    Example:

    performance-measurement
     endpoint ipv6 FCBB:0:1::
      delay-measurement
       delay-profile name test
      !
     !
     liveness-profile name test
      probe
       flow-label explicit 100 200 300
      !
     !
    !
    
  3. Verify the delay information for the endpoint.

    Example:

    Router# show performance-measurement endpoint detail
    Endpoint name: IPv6-FCBB:0:1::-vrf-default
      Source address              : 192::2
      VRF name                    : default
      Liveness Detection          : Enabled
      Profile Keys:
        Profile name              : default
        Profile type              : Endpoint Liveness Detection
      Segment-list                : None
      Liveness Detection session:
        Session ID                : 4109
        Flow-label                : 1000
        Session State: Up
        Last State Change Timestamp: Jan 23 2024 16:06:01.214
        Missed count: 0
    
      Liveness Detection session:
        Session ID                : 4110
        Flow-label                : 2000
        Session State: Up
        Last State Change Timestamp: Jan 23 2024 16:06:01.214
        Missed count: 0
    
      Segment-list                : test-dm-two-carrier-sl2
        FCBB:0:1:2:e004::/64
          Format: f3216
        FCBB:0:1:3:e000::/64
          Format: f3216
        FCBB:0:1:2:e004::/64
          Format: f3216
        FCBB:0:1:2:e000::/64
          Format: f3216
        FCBB:0:1:1:e000::/64
          Format: f3216
        FCBB:0:1:1:e004::/64
          Format: f3216
        FCBB:0:1:4:e000::/64
          Format: f3216
        FCBB:0:1:4::/48
          Format: f3216
      Liveness Detection session:
        Session ID                : 4111
        Flow-label                : 1000
        Session State: Up
        Last State Change Timestamp: Jan 23 2024 16:06:01.217
        Missed count: 0
    
      Liveness Detection session:
        Session ID                : 4112
        Flow-label                : 2000
        Session State: Up
        Last State Change Timestamp: Jan 23 2024 16:06:01.217
        Missed count: 0