
Cisco Secure Firewall 3100/4200 のクラスタリングについて
ここでは、クラスタリング アーキテクチャとその動作について説明します。
How the Cluster Fits into Your Network
The cluster consists of multiple firewalls acting as a single unit. To act as a cluster, the firewalls need the following infrastructure:
-
Isolated, high-speed backplane network for intra-cluster communication, known as the cluster control link.
-
Management access to each firewall for configuration and monitoring.
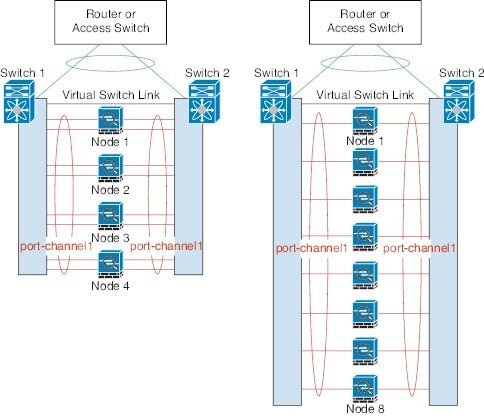
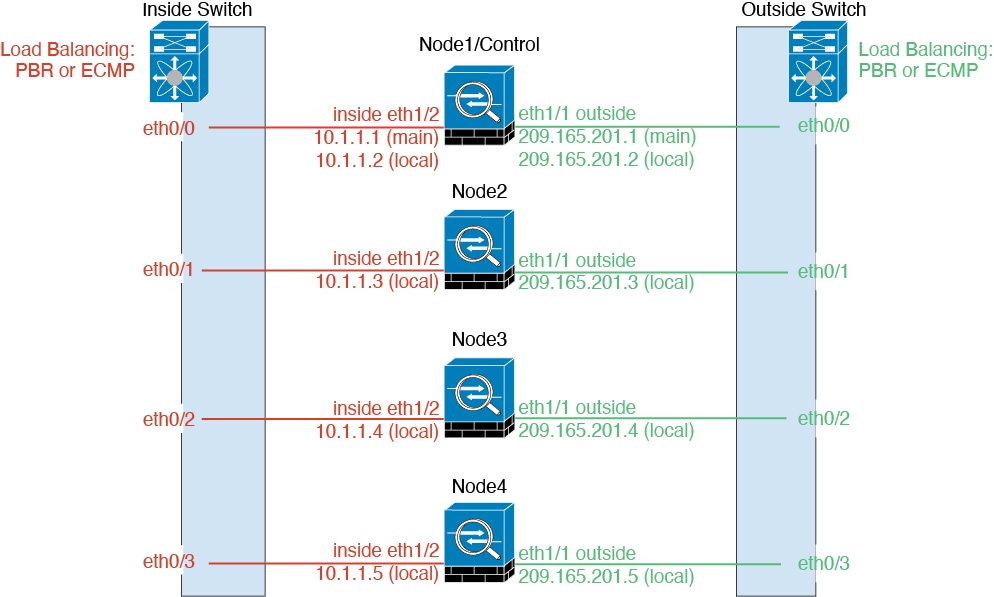
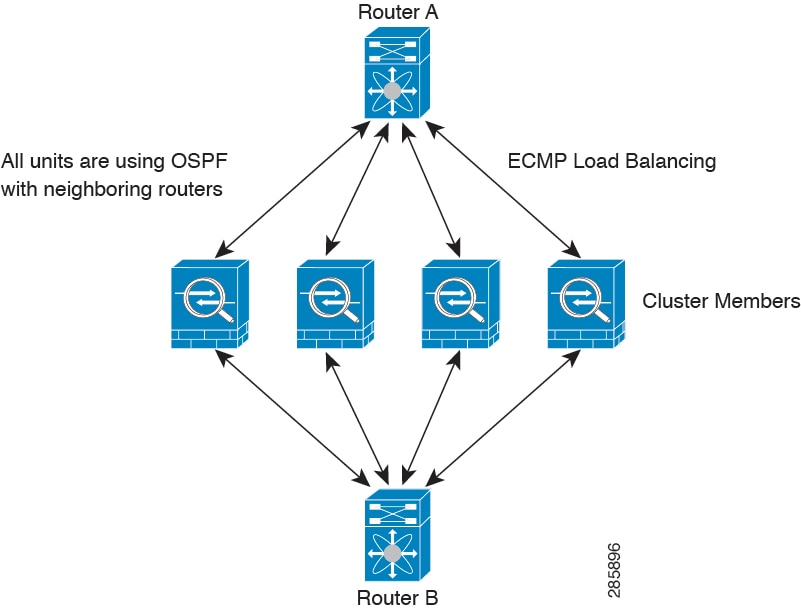
When you place the cluster in your network, the upstream and downstream routers need to be able to load-balance the data coming to and from the cluster using one of the following methods:
-
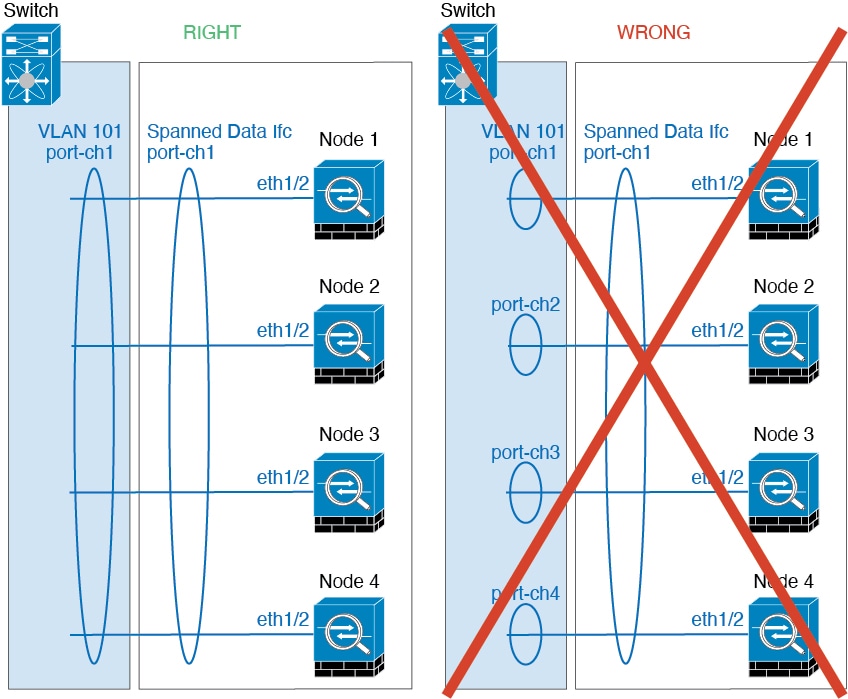
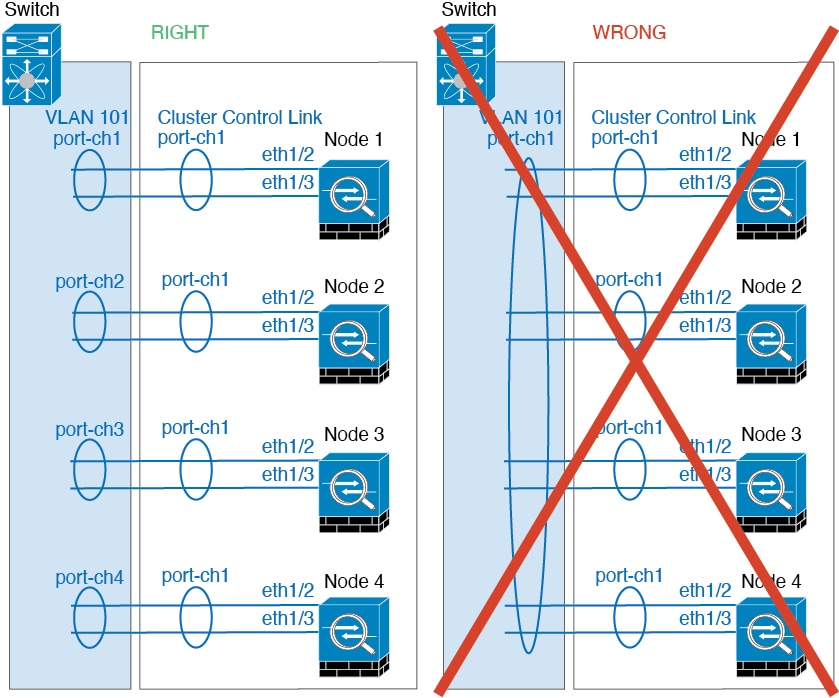
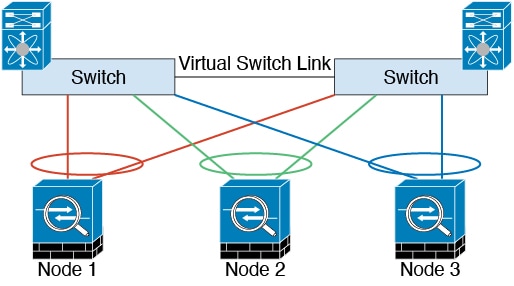
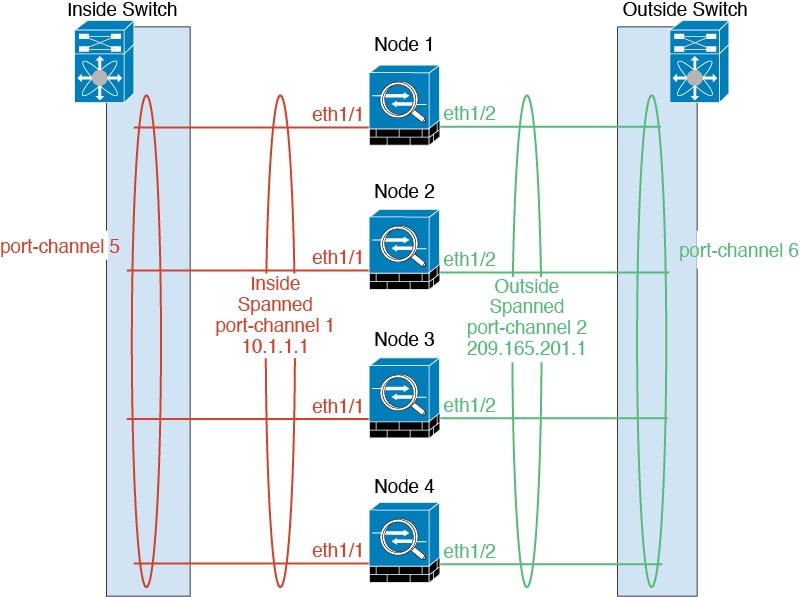
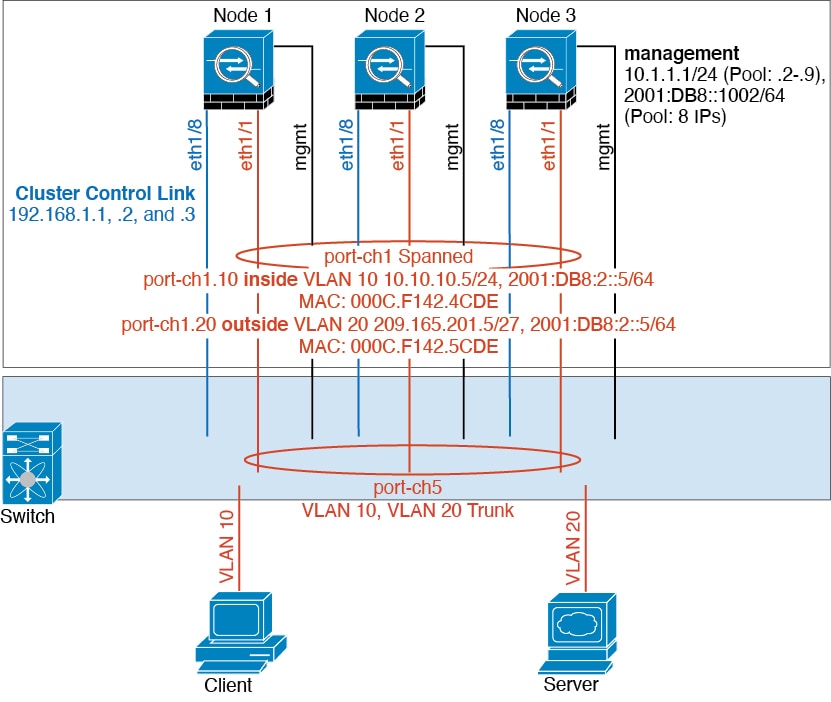
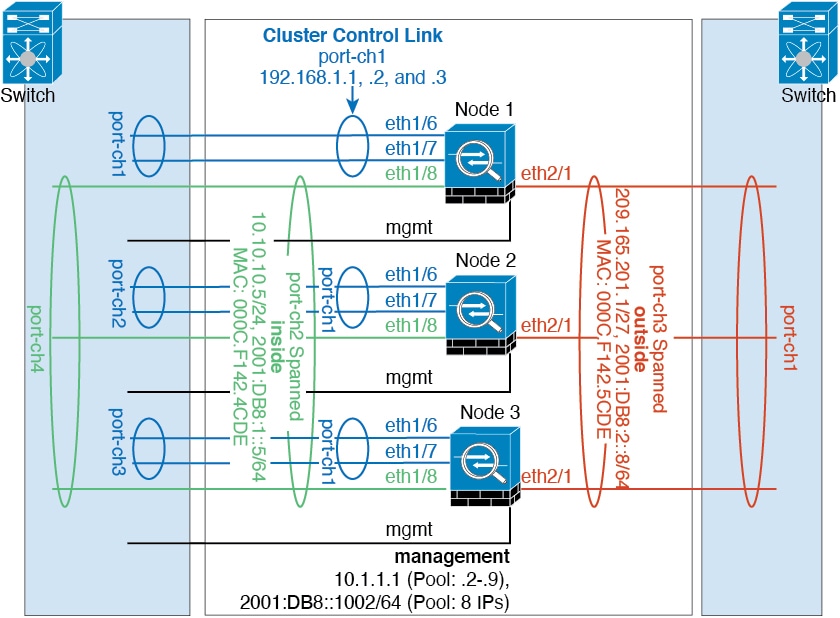
Spanned EtherChannel (Recommended)—Interfaces on multiple members of the cluster are grouped into a single EtherChannel; the EtherChannel performs load balancing between units.
-
Policy-Based Routing (Routed firewall mode only)—The upstream and downstream routers perform load balancing between units using route maps and ACLs.
-
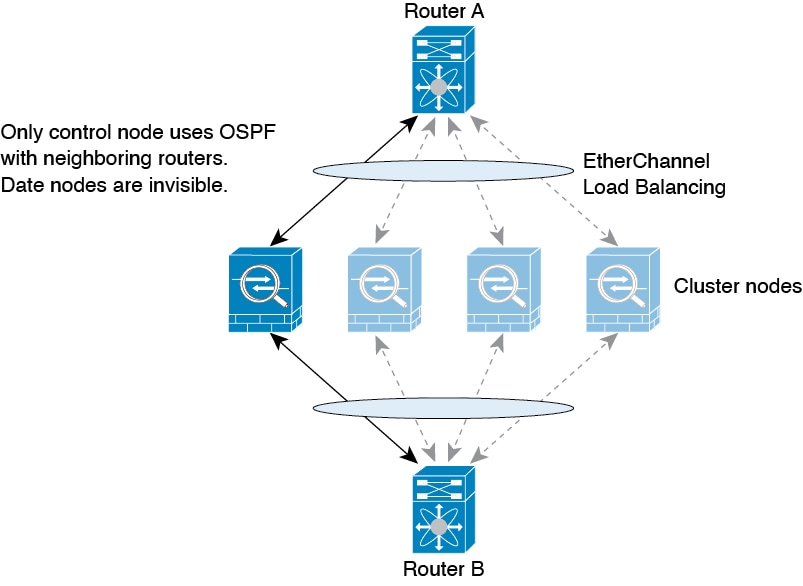
Equal-Cost Multi-Path Routing (Routed firewall mode only)—The upstream and downstream routers perform load balancing between units using equal cost static or dynamic routes.
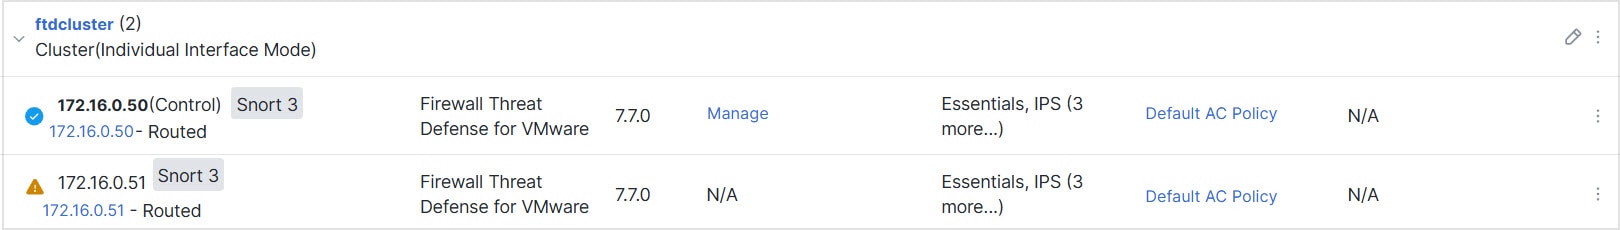
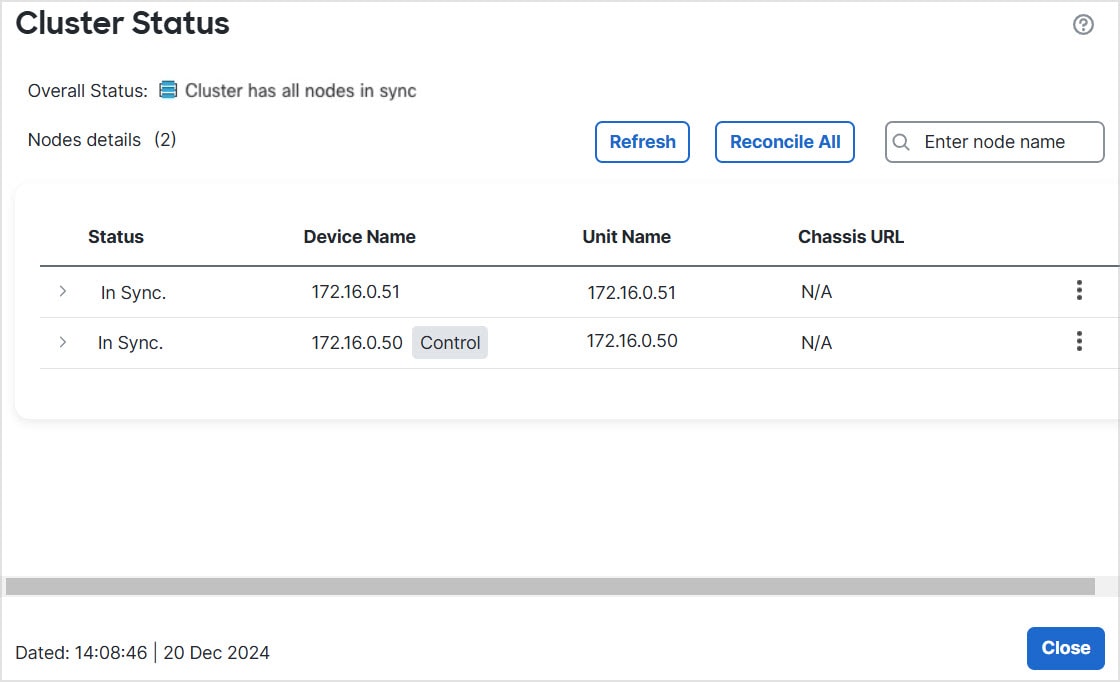
Control and Data Node Roles
One member of the cluster is the control node. If multiple cluster nodes come online at the same time, the control node is determined by the priority setting; the priority is set between 1 and 100, where 1 is the highest priority. All other members are data nodes. When you first create the cluster, you specify which node you want to be the control node, and it will become the control node simply because it is the first node added to the cluster.
All nodes in the cluster share the same configuration. The node that you initially specify as the control node will overwrite the configuration on the data nodes when they join the cluster, so you only need to perform initial configuration on the control node before you form the cluster.
Some features do not scale in a cluster, and the control node handles all traffic for those features.
Cluster Interfaces
You can configure data interfaces as either Spanned EtherChannels or as Individual interfaces. All data interfaces in the cluster must be one type only. See About Cluster Interfaces for more information.
For Spanned EtherChannels: You can use regular firewall interfaces or IPS-only interfaces (inline sets or passive interfaces). For Individual interfaces: IPS-only interfaces are not supported.
Cluster Control Link
Each unit must dedicate at least one hardware interface as the cluster control link. See Cluster Control Link for more information.
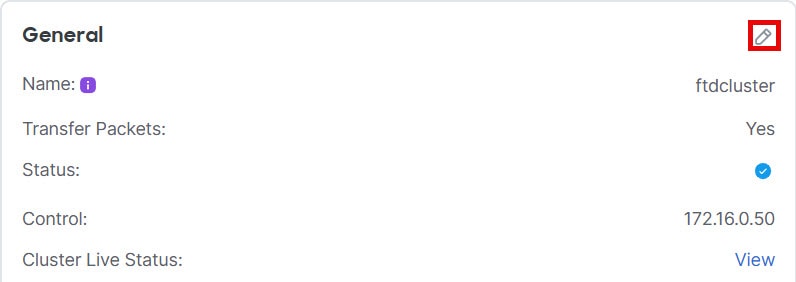
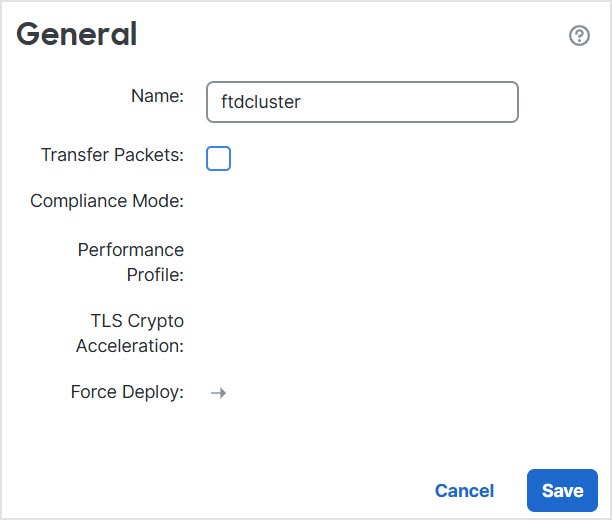
Configuration Replication
All nodes in the cluster share a single configuration. You can only make configuration changes on the control node (with the exception of the bootstrap configuration), and changes are automatically synced to all other nodes in the cluster.
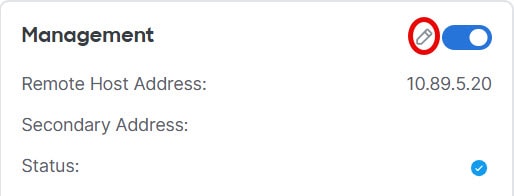
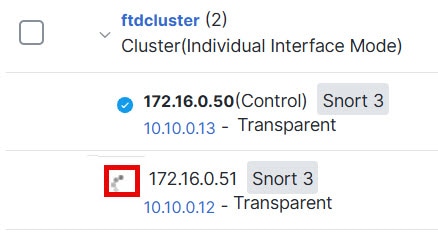
管理ネットワーク
管理インターフェイスを使用して各ノードを管理する必要があります。クラスタリングでは、データインターフェイスからの管理はサポートされていません。

![[クラスタの追加(Add Cluster)] ウィザード](/c/dam/en/us/td/i/400001-500000/480001-490000/488001-489000/488266.jpg)

![[IPv4] ページ](/c/dam/en/us/td/i/400001-500000/470001-480000/479001-480000/479211.jpg)

![[クラスタの管理(Manage Cluster)] ウィザード](/c/dam/en/us/td/i/400001-500000/480001-490000/487001-488000/487956.jpg)

![[クラスタの管理(Manage Cluster)] ウィザード](/c/dam/en/us/td/i/400001-500000/480001-490000/488001-489000/488040.jpg)
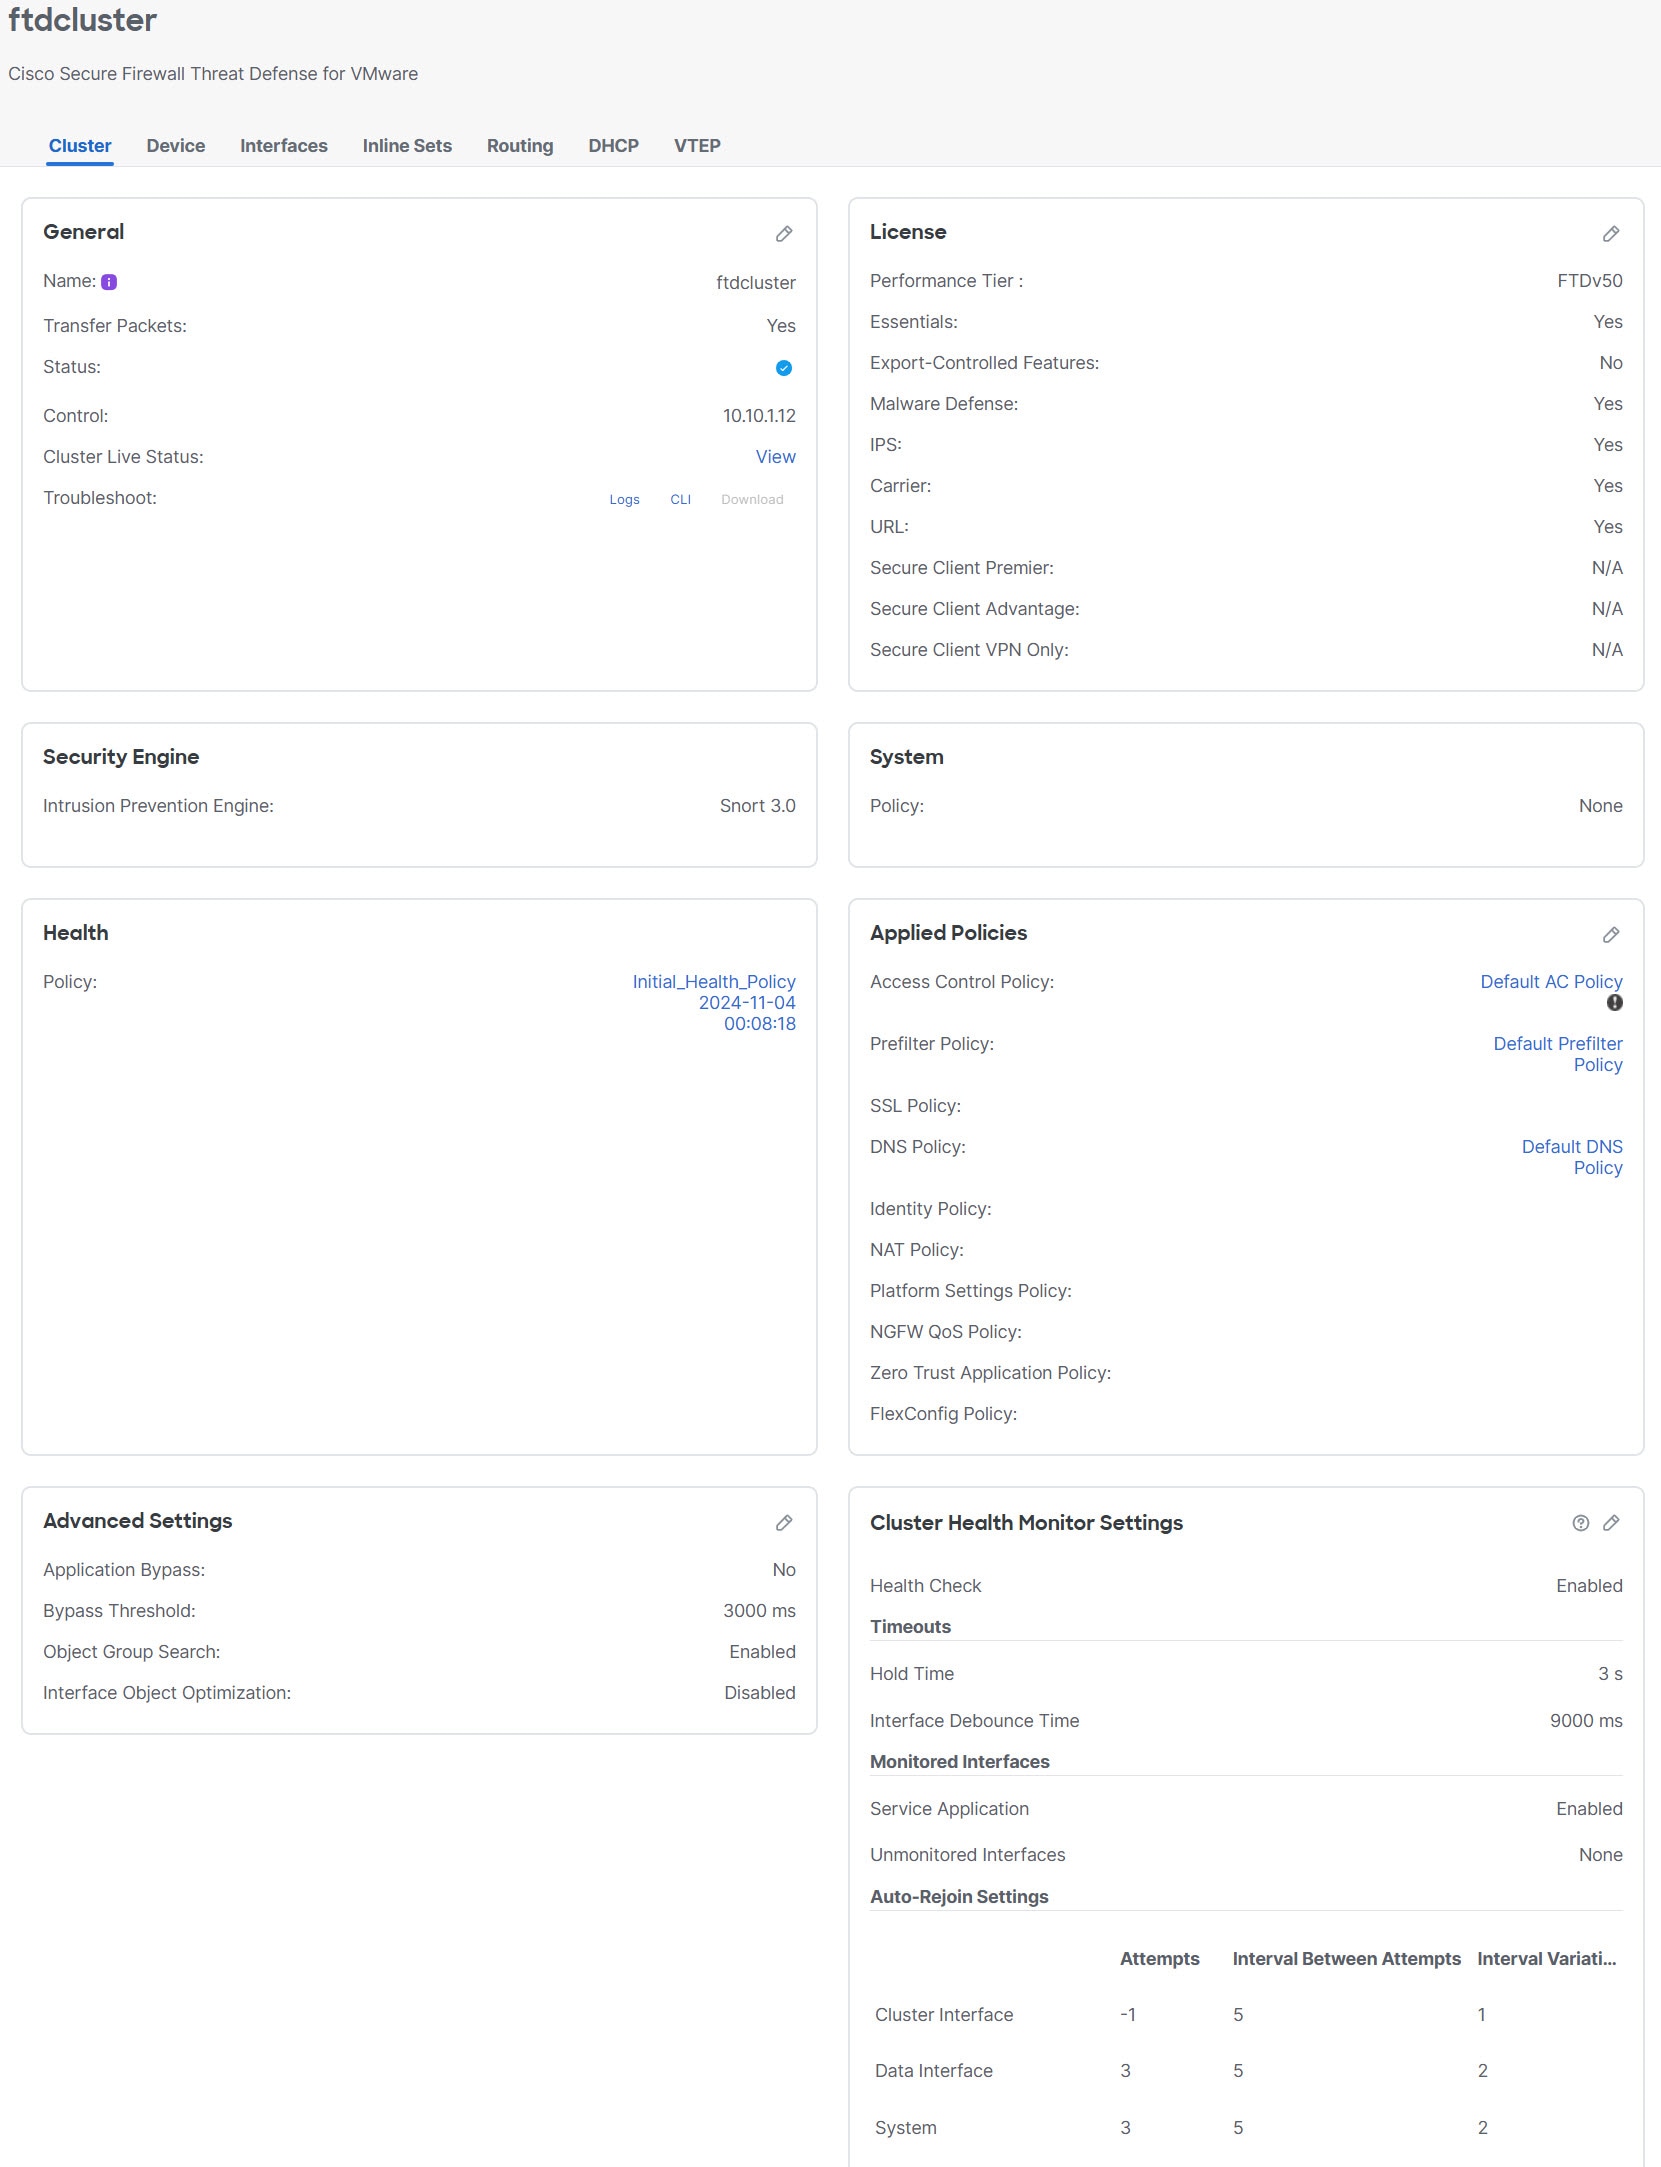
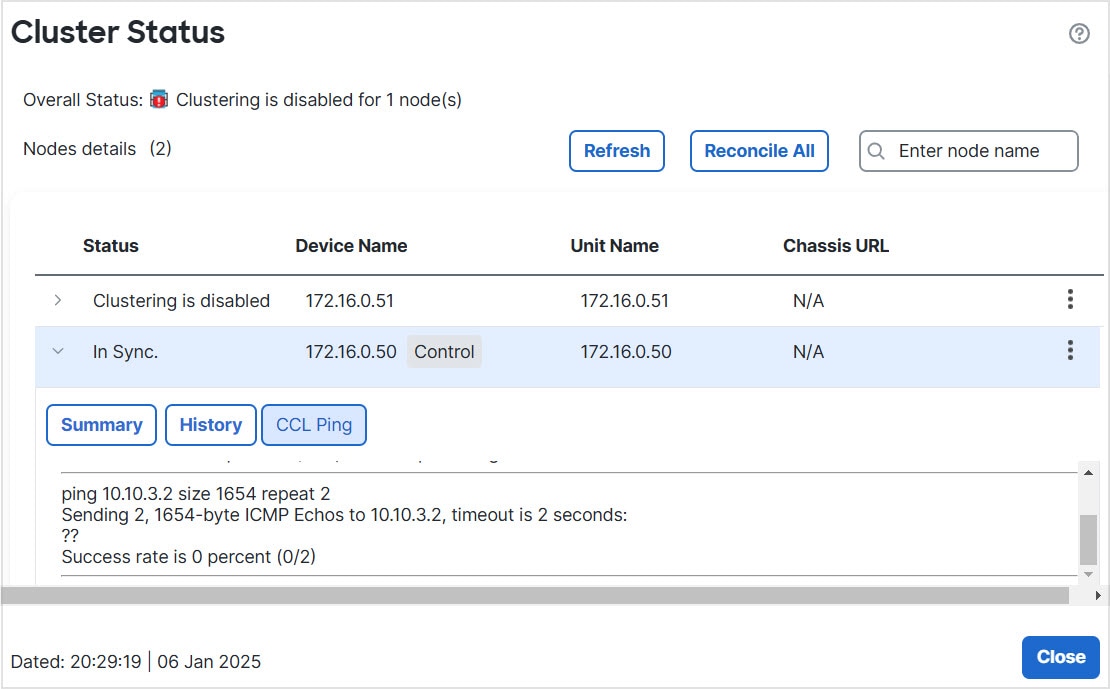
![ノードの [概要(Summary)]](/c/dam/en/us/td/i/400001-500000/480001-490000/488001-489000/488046.jpg)
![ノードの [履歴(History)]](/c/dam/en/us/td/i/400001-500000/480001-490000/488001-489000/488047.jpg)


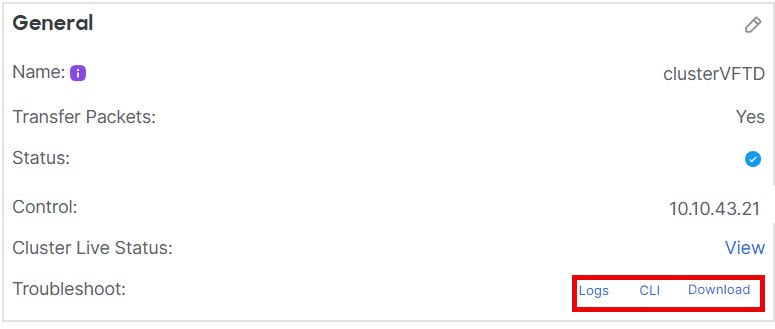
 フィードバック