- About This Book
-
- Getting Started
- Setting Up the Prime Fulfillment Services for L2VPN
- Creating a FlexUNI/EVC Ethernet Policy
- Creating a FlexUNI/EVC Ethernet Service Request
- Creating a FlexUNI/EVC ATM-Ethernet Interworking Policy
- Creating a FlexUNI/EVC ATM-Ethernet Interworking Service Request
- Creating an L2VPN Policy
- Creating an L2VPN Service Request
- Creating a VPLS Policy
- Creating a VPLS Service Request
- Deploying, Monitoring, and Auditing Service Requests
- Using Auto Discovery for L2 Services
- Sample Configlets
- Setting Up VLAN Translation
-
- Getting Started with MPLS VPN
- Setting Up the Prime Fulfillment Services
- Independent VRF Management
- IPv6 and 6VPE Support in MPLS VPN
- MPLS VPN Service Policies
- MPLS VPN Service Requests
- Provisioning Regular PE-CE Links
- Provisioning Multi-VRFCE PE-CE Links
- Provisioning Management VPN
- Provisioning Cable Services
- Provisioning Carrier Supporting Carrier
- Provisioning Multiple Devices
- Spanning Multiple Autonomous Systems
- Sample Configlets
- Troubleshooting MPLS VPNs
Cisco Prime Fulfillment User Guide 6.1
Bias-Free Language
The documentation set for this product strives to use bias-free language. For the purposes of this documentation set, bias-free is defined as language that does not imply discrimination based on age, disability, gender, racial identity, ethnic identity, sexual orientation, socioeconomic status, and intersectionality. Exceptions may be present in the documentation due to language that is hardcoded in the user interfaces of the product software, language used based on RFP documentation, or language that is used by a referenced third-party product. Learn more about how Cisco is using Inclusive Language.
- Updated:
- March 20, 2015
Chapter: Monitoring SLA
SLA
A service-level agreement (SLA) defines a level of service provided by a service provider to any customer. Performance is monitored through the SLA server. Cisco Prime Fulfillment monitors the service-related performance criteria by provisioning, collecting, and monitoring SLAs on Cisco IOS routers that support the Service Assurance Agent (SA Agent) devices. To provision the SLAs and to collect statistics for each SLA, the data collection task requires minimal user input.

Note ![]() SLA features are not supported on devices running IOS XR.
SLA features are not supported on devices running IOS XR.
The SLA collection task collects the relevant performance data, stores it persistently, aggregates it, and presents useful reports. The SLA collection task collects from the SA Agent MIB on devices. Prime Fulfillment leverages the SA Agent MIB to monitor SLA performance on a 24 x 7 basis. Using the MIB, you can monitor network traffic for the popular protocols:
•![]() Dynamic Host Configuration Protocol (DHCP)
Dynamic Host Configuration Protocol (DHCP)
•![]() Domain Name System (DNS)
Domain Name System (DNS)
•![]() File Transfer Protocol (FTP)
File Transfer Protocol (FTP)
•![]() Hyper text Transfer Protocol (HTTP)
Hyper text Transfer Protocol (HTTP)
•![]() Internet Control Message Protocol Echo (ICMP Echo)
Internet Control Message Protocol Echo (ICMP Echo)
•![]() Jitter (voice jitter)
Jitter (voice jitter)
•![]() Transmission Control Protocol Connect (TCP Connect)
Transmission Control Protocol Connect (TCP Connect)
•![]() User Datagram Protocol Echo (UDP Echo).
User Datagram Protocol Echo (UDP Echo).

Note ![]() SLA uses the embedded Sybase database, independent of whether you choose Oracle as your database.
SLA uses the embedded Sybase database, independent of whether you choose Oracle as your database.

Note ![]() The SLA operations Create, Delete, Enable Probes, Disable Probes, Enable Traps, and Disable Traps automatically result in the creation of a task, which executes the actual operation. You can view the status of the task by navigating Inventory > Task Manager > Logs.
The SLA operations Create, Delete, Enable Probes, Disable Probes, Enable Traps, and Disable Traps automatically result in the creation of a task, which executes the actual operation. You can view the status of the task by navigating Inventory > Task Manager > Logs.
This section explains how to configure SLA probes, collect SLA data, and view SLA reports about these SLA probes.
Before you choose Inventory > Device Tools > SLA, implement the setup procedures in the "Setup Prior to Using SLA" section."
Then choose Inventory > Device Tools > SLA and you can select one of the following:
•![]() Probes is the default selection.
Probes is the default selection.
Setup Prior to Using SLA
SLA is an SNMP activity. Be sure SNMP is enabled and the SNMP settings on the router match the settings in the repository.
When creating an SLA From MPLS CPE or From MPLS PE or MVRF-CE, the service requests associated with the devices must be in the Deployed state.
Probes
When you choose Inventory > Device Tools > SLA, you receive a window as shown in Figure 51-1.
Figure 51-1 SLA Probes

The default button that is enabled is Create and from the Create drop-down list, you can choose to create SLA probes From Any SA Agent Device(s); From MPLS CPE; or From MPLS PE or MVRF-CE. However, if you select one or more existing probes by clicking the row(s) of existing probe(s), then you have access to the other buttons, Details, Delete, Enable, and Disable. For Enable and Disable, the drop-down list contains options to enable or disable SLA Probes and SLA Traps.
The explanations of the buttons and subsequent drop-down lists is given as follows:
•![]() Create Common Parameters—This section explains the SLA common parameters for all of the probe creation types: From Any SA Agent Device(s); From MPLS CPE; or From MPLS PE or MVRF-CE.
Create Common Parameters—This section explains the SLA common parameters for all of the probe creation types: From Any SA Agent Device(s); From MPLS CPE; or From MPLS PE or MVRF-CE.
•![]() Create From Any SA Agent Device(s)—This section explains how to create probes from any SA Agent device(s) and begins after creating common parameters.
Create From Any SA Agent Device(s)—This section explains how to create probes from any SA Agent device(s) and begins after creating common parameters.
•![]() Create from MPLS CPE—This section explains how to create probes from an MPLS CPE and begins after creating common parameters.
Create from MPLS CPE—This section explains how to create probes from an MPLS CPE and begins after creating common parameters.
•![]() Create From MPLS PE or MVRF-CE—This section explains how to create probes from an MPLS PE or MVRF-CE and begins after creating common parameters.
Create From MPLS PE or MVRF-CE—This section explains how to create probes from an MPLS PE or MVRF-CE and begins after creating common parameters.
•![]() Protocols—This section is common Probes information for each of the Create paths.
Protocols—This section is common Probes information for each of the Create paths.
•![]() Details—This section gives details about a specified probe.
Details—This section gives details about a specified probe.
•![]() Delete—This section explains how to delete a probe.
Delete—This section explains how to delete a probe.
•![]() Enable Probes—This section explains how to enable the Probe and change its status from Created to Active state.
Enable Probes—This section explains how to enable the Probe and change its status from Created to Active state.
•![]() Enable Traps—This section explains how to enable traps.
Enable Traps—This section explains how to enable traps.
•![]() Disable Probes—This section explains how to disable the Probe and change its status from Active to Disabled.
Disable Probes—This section explains how to disable the Probe and change its status from Active to Disabled.
•![]() Disable Traps—This sections explains how to disable traps.
Disable Traps—This sections explains how to disable traps.
Create Common Parameters
When you choose Inventory > Device Tools > SLA, the default is the Probes page with only the Create button enabled, as shown in Figure 51-1. From the Create drop-down list, you can choose From Any SA Agent Device(s), From MPLS CPE, or From MPLS PE or MVRF-CE. The first window to appear in all ways of creation is specified here. Then you proceed to the specific creation type you have chosen.
Follow these steps:
Step 1 ![]() Choose Create, and the window to appear is as shown in Figure 51-2.
Choose Create, and the window to appear is as shown in Figure 51-2.
Figure 51-2 SLA Common Parameters
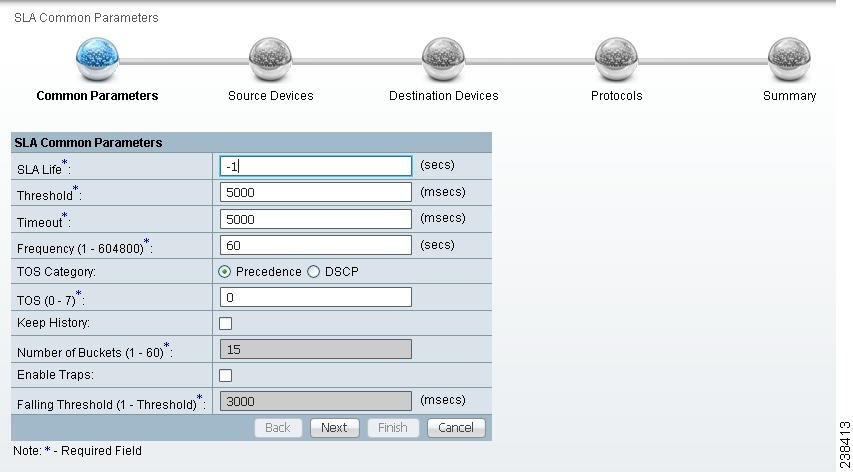
Accept the defaults or change the information in the fields of the common SLA parameters, as follows, and then click Next:
•![]() SLA Life (required)—The number of seconds that the probe is active (with the maximum value of a 32-bit integer in seconds). If the value is set to -1, the typical and default value, the probe is active forever.
SLA Life (required)—The number of seconds that the probe is active (with the maximum value of a 32-bit integer in seconds). If the value is set to -1, the typical and default value, the probe is active forever.
•![]() Threshold (required)—An integer that defines the threshold limit in milliseconds. When this threshold is exceeded and traps are enabled, a trap is sent. The maximum value is the maximum value of a 32-bit integer. If the service affecting agent (SA Agent) operation time exceeds this limit, the threshold violation is recorded by the SA Agent. The value for Threshold must not exceed the value for Timeout. The default value is 5000.
Threshold (required)—An integer that defines the threshold limit in milliseconds. When this threshold is exceeded and traps are enabled, a trap is sent. The maximum value is the maximum value of a 32-bit integer. If the service affecting agent (SA Agent) operation time exceeds this limit, the threshold violation is recorded by the SA Agent. The value for Threshold must not exceed the value for Timeout. The default value is 5000.
•![]() Timeout (required)—Duration in milliseconds to wait for an SA Agent operation completion. The value for Timeout must be less than or equal to the value for Frequency and greater than or equal to the value for Threshold. The default value is 5000
Timeout (required)—Duration in milliseconds to wait for an SA Agent operation completion. The value for Timeout must be less than or equal to the value for Frequency and greater than or equal to the value for Threshold. The default value is 5000
•![]() Frequency (0 - 604800) (required)—Duration in seconds between initiating each SA Agent operation. The value for Frequency must be greater than or equal to the value for Timeout. The default value is 60.
Frequency (0 - 604800) (required)—Duration in seconds between initiating each SA Agent operation. The value for Frequency must be greater than or equal to the value for Timeout. The default value is 60.
•![]() TOS Category (default: Precedence)—If you choose the Precedence radio button for TOS Category, you have one set of type of service (TOS) values. If you choose the DSCP radio button for TOS Category, you have a different set of TOS values.
TOS Category (default: Precedence)—If you choose the Precedence radio button for TOS Category, you have one set of type of service (TOS) values. If you choose the DSCP radio button for TOS Category, you have a different set of TOS values.
•![]() TOS (required)—An integer. The range and meanings of the values depend on whether the radio button in the TOS Category is set to Precedence (values: 0 to 7) or DSCP (values: 0 to 63).
TOS (required)—An integer. The range and meanings of the values depend on whether the radio button in the TOS Category is set to Precedence (values: 0 to 7) or DSCP (values: 0 to 63).
–![]() When the TOS Category is set to Precedence, the valid values are 0 to 7. These values represent the three most significant bits of the ToS field in an IP header. The default value is 0. The meanings of the Precedence values are specified in Table 51-1.
When the TOS Category is set to Precedence, the valid values are 0 to 7. These values represent the three most significant bits of the ToS field in an IP header. The default value is 0. The meanings of the Precedence values are specified in Table 51-1.

Note ![]() Type of Service does not apply to the DNS and DHCP types of SLA probes. Prime Fulfillment ignores any ToS value set for these two types of SLA probes. For example, if you first choose a ToS value of 5, then choose the DNS, DHCP, and ICMP Echo protocols for an SLA probe, Prime Fulfillment applies the selected ToS value to the ICMP Echo probe only.
Type of Service does not apply to the DNS and DHCP types of SLA probes. Prime Fulfillment ignores any ToS value set for these two types of SLA probes. For example, if you first choose a ToS value of 5, then choose the DNS, DHCP, and ICMP Echo protocols for an SLA probe, Prime Fulfillment applies the selected ToS value to the ICMP Echo probe only.
–![]() When the TOS Category is set to DSCP, the valid values are 0 to 63. These values represent the six most significant bits of this ToS field in an IP header. The default value is 0. The interpretation of these TOS values is user specified.
When the TOS Category is set to DSCP, the valid values are 0 to 63. These values represent the six most significant bits of this ToS field in an IP header. The default value is 0. The interpretation of these TOS values is user specified.

Note ![]() Prime Fulfillment maps the 0 - 7 PRECEDENCE values to the three most significant ToS bits by left-shifting the value by five positions. Similarly, the 0 - 63 DSCP values are left-shifted by two positions.
Prime Fulfillment maps the 0 - 7 PRECEDENCE values to the three most significant ToS bits by left-shifting the value by five positions. Similarly, the 0 - 63 DSCP values are left-shifted by two positions.
•![]() Keep History (default: unchecked)—If you check the Keep History check box, you indicate to keep the recent History Table on the router. Specifically, it is kept in the SA Agent MIB that keeps the raw round-trip time (RTT) SLA measurement. This selection also enables you to indicate the Number of Buckets of raw history data to keep. If you leave the default of an unchecked check box for Keep History, no raw history data is kept. Keep History is not supported for HTTP and Jitter.
Keep History (default: unchecked)—If you check the Keep History check box, you indicate to keep the recent History Table on the router. Specifically, it is kept in the SA Agent MIB that keeps the raw round-trip time (RTT) SLA measurement. This selection also enables you to indicate the Number of Buckets of raw history data to keep. If you leave the default of an unchecked check box for Keep History, no raw history data is kept. Keep History is not supported for HTTP and Jitter.
•![]() Number of Buckets (1 - 60) (required)—The default is 15 when the Keep History check box is checked. The range is 1 to 60 and indicates the number of most recent raw data entries to be kept in the raw history data. When the specified Number of Buckets is surpassed, removal of buckets starts with the oldest bucket to keep only the number of raw data entries specified.
Number of Buckets (1 - 60) (required)—The default is 15 when the Keep History check box is checked. The range is 1 to 60 and indicates the number of most recent raw data entries to be kept in the raw history data. When the specified Number of Buckets is surpassed, removal of buckets starts with the oldest bucket to keep only the number of raw data entries specified.
•![]() Enable Traps (default: unchecked, which means No)—If you check the Enable Traps check box, the created SLA is configured to send three types of traps. This selection also enables you to indicate the Falling Threshold. If you leave the Enable Traps check box unchecked, the traps are disabled on the SLAs created in this task.
Enable Traps (default: unchecked, which means No)—If you check the Enable Traps check box, the created SLA is configured to send three types of traps. This selection also enables you to indicate the Falling Threshold. If you leave the Enable Traps check box unchecked, the traps are disabled on the SLAs created in this task.
•![]() Falling Threshold (1 - Threshold) (required)—The default is 3000 in milliseconds when the Enable Traps check box is checked. The range is 1 to the Threshold value in milliseconds. When traps are enabled and the delay meets the specified number of milliseconds, a trap is sent.
Falling Threshold (1 - Threshold) (required)—The default is 3000 in milliseconds when the Enable Traps check box is checked. The range is 1 to the Threshold value in milliseconds. When traps are enabled and the delay meets the specified number of milliseconds, a trap is sent.
Step 2 ![]() Next you proceed to Create From Any SA Agent Device(s), Create from MPLS CPE, or Create From MPLS PE or MVRF-CE.
Next you proceed to Create From Any SA Agent Device(s), Create from MPLS CPE, or Create From MPLS PE or MVRF-CE.
Create From Any SA Agent Device(s)
After you have completed the steps in Create Common Parameters, follow these steps:

Note ![]() IP connectivity must be available between the SA Agent devices.
IP connectivity must be available between the SA Agent devices.
Step 1 ![]() The next window to appear is as shown in Figure 51-3.
The next window to appear is as shown in Figure 51-3.
Figure 51-3 SLA Source Devices

Step 2 ![]() Click the Add button and a window appears as shown in Figure 51-4, which lists all the devices in the database that have a minimum of one interface. Check the check box next to each row for the device you want to select, then click Select.
Click the Add button and a window appears as shown in Figure 51-4, which lists all the devices in the database that have a minimum of one interface. Check the check box next to each row for the device you want to select, then click Select.
Figure 51-4 SLA Devices > Add

You return to Figure 51-3 and the newly added source device(s) appear. The information about this source device is specified in the following columns:
•![]() Device Name—You can click this heading and the device names are organized alphabetically.
Device Name—You can click this heading and the device names are organized alphabetically.
•![]() Interface—You can click Select and from the resulting window, you can update the IP address. Select one radio button for an interface and click Select and the IP address changes in Figure 51-3.
Interface—You can click Select and from the resulting window, you can update the IP address. Select one radio button for an interface and click Select and the IP address changes in Figure 51-3.
•![]() Type—Gives you the type of the source device.
Type—Gives you the type of the source device.
Step 3 ![]() You can repeat Step 2 to to add more devices, or you can delete any of the currently selected source devices. To delete, check the check box next to each row for the device you want to delete and then click Delete.
You can repeat Step 2 to to add more devices, or you can delete any of the currently selected source devices. To delete, check the check box next to each row for the device you want to delete and then click Delete.

Note ![]() There is no second chance for deleting source devices. There is no confirm window.
There is no second chance for deleting source devices. There is no confirm window.
Step 4 ![]() Click Next.
Click Next.
The next window to appear is as shown in Figure 51-5.
Figure 51-5 SLA Destination Devices

Step 5 ![]() Click the Add button and a window appears as shown in Figure 51-4. Check the check box next to each row for the device you want to select. Then click Select.
Click the Add button and a window appears as shown in Figure 51-4. Check the check box next to each row for the device you want to select. Then click Select.
Step 6 ![]() You return to Figure 51-5 and the newly added destination device(s) appear. The information about this destination device is specified in the following columns:
You return to Figure 51-5 and the newly added destination device(s) appear. The information about this destination device is specified in the following columns:
•![]() Device Name—You can click this heading and the device names are organized alphabetically.
Device Name—You can click this heading and the device names are organized alphabetically.
•![]() Interface—You can click Select and from the resulting window, you can update the IP address. Select one radio button for an interface and click Select and the IP address changes in Figure 51-5.
Interface—You can click Select and from the resulting window, you can update the IP address. Select one radio button for an interface and click Select and the IP address changes in Figure 51-5.
•![]() Type—Gives you the type of the source device.
Type—Gives you the type of the source device.
Step 7 ![]() You can repeat Step 5 to Step 6 to add more devices, or you can delete any of the currently selected destination devices. To delete, check the check box next to each row for the device you want to delete and then click Delete.
You can repeat Step 5 to Step 6 to add more devices, or you can delete any of the currently selected destination devices. To delete, check the check box next to each row for the device you want to delete and then click Delete.

Note ![]() There is no second chance for deleting destination devices. There is no confirm window.
There is no second chance for deleting destination devices. There is no confirm window.
Step 8 ![]() Click Next. Proceed to the "Protocols" section."
Click Next. Proceed to the "Protocols" section."
Create from MPLS CPE
After you have completed the steps in Create Common Parameters, follow these steps:
Step 1 ![]() Complete the steps in the "Create Common Parameters" section and the next window to appear is as shown in Figure 51-6.
Complete the steps in the "Create Common Parameters" section and the next window to appear is as shown in Figure 51-6.
Figure 51-6 SLA CPE Parameters
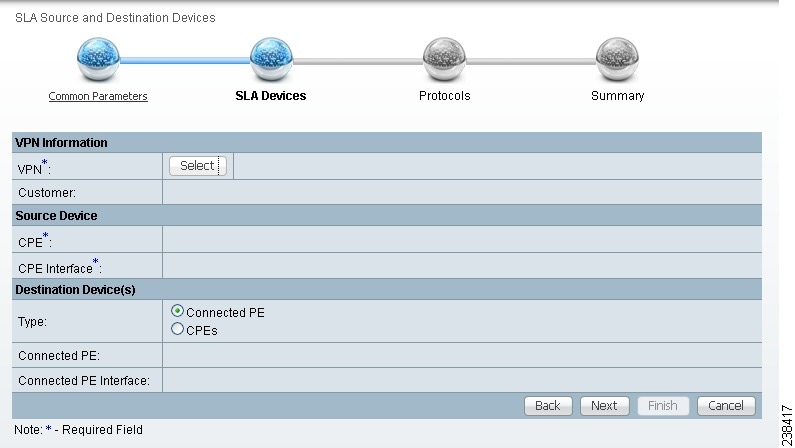
Step 2 ![]() Click the Select button for VPN and a window appears, which lists all the VPNs in the database.
Click the Select button for VPN and a window appears, which lists all the VPNs in the database.
Step 3 ![]() Click the radio button for the VPN you want to select. Then click Select. You return to Figure 51-6 and the newly added VPN and Customer information appear and a Select button appears for CPE. You can change the VPN by repeating Step 2.
Click the radio button for the VPN you want to select. Then click Select. You return to Figure 51-6 and the newly added VPN and Customer information appear and a Select button appears for CPE. You can change the VPN by repeating Step 2.
Step 4 ![]() Click the Select button for CPE and a window appears which lists the CPEs associated with the selected VPN. Click the radio button for the CPE you want to select. Then click Select.
Click the Select button for CPE and a window appears which lists the CPEs associated with the selected VPN. Click the radio button for the CPE you want to select. Then click Select.
Step 5 ![]() You return to Figure 51-6 and the newly added CPE and its first interface appear and a Select button appears for CPE Interface. You can change the CPE by repeating Step 4.
You return to Figure 51-6 and the newly added CPE and its first interface appear and a Select button appears for CPE Interface. You can change the CPE by repeating Step 4.
Step 6 ![]() If you want to change the default CPE Interface information that appears, click Select and you receive a window appears.
If you want to change the default CPE Interface information that appears, click Select and you receive a window appears.
Step 7 ![]() Click the radio button next to the row for the interface you want to select. Then click Select. You return to Figure 51-6 and the newly added CPE Interface appears.
Click the radio button next to the row for the interface you want to select. Then click Select. You return to Figure 51-6 and the newly added CPE Interface appears.
Step 8 ![]() You can change the CPE Interface by repeating Step 6.
You can change the CPE Interface by repeating Step 6.
Step 9 ![]() You can keep the default Type, by leaving the radio button for Connected PE chosen, which creates an SLA between the CPE and its directly connected PE, or you can select the radio button for CPEs in the same VPN. If you keep the default of Connected PE, proceed to Step 10. If you click the CPEs radio button, proceed to Step 14.
You can keep the default Type, by leaving the radio button for Connected PE chosen, which creates an SLA between the CPE and its directly connected PE, or you can select the radio button for CPEs in the same VPN. If you keep the default of Connected PE, proceed to Step 10. If you click the CPEs radio button, proceed to Step 14.
Step 10 ![]() Click Select for Connected PE Interface and a window appears.
Click Select for Connected PE Interface and a window appears.
Step 11 ![]() Click the radio button next to the row for the interface you want to select. Then click Select.
Click the radio button next to the row for the interface you want to select. Then click Select.
Step 12 ![]() You return to Figure 51-6 and the newly added Connected PE Interface appears. You can change the Connected PE Interface by repeating Step 10.
You return to Figure 51-6 and the newly added Connected PE Interface appears. You can change the Connected PE Interface by repeating Step 10.
Step 13 ![]() Click Next and proceed to the "Protocols" section.
Click Next and proceed to the "Protocols" section.
Step 14 ![]() When you click CPEs, the window is as shown in Figure 51-7, "CPEs."
When you click CPEs, the window is as shown in Figure 51-7, "CPEs."
Figure 51-7 CPEs
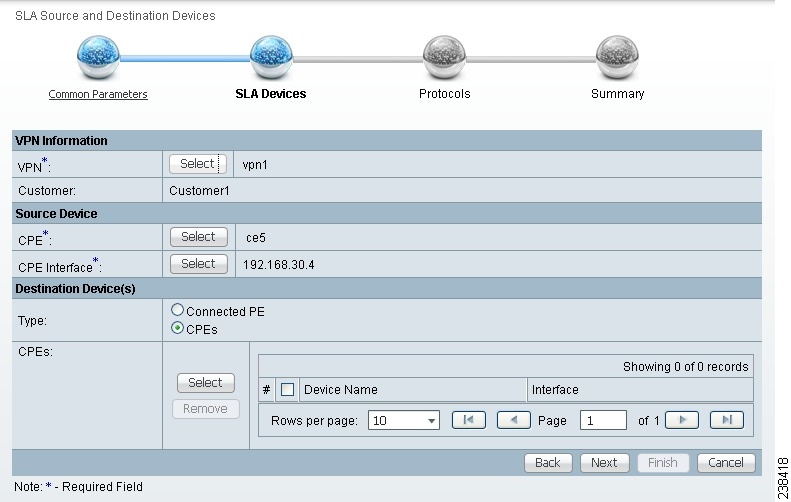
Step 15 ![]() Click the Select button for CPEs and a window appears which lists all the CPEs associated with the specified VPN in the database.
Click the Select button for CPEs and a window appears which lists all the CPEs associated with the specified VPN in the database.
Step 16 ![]() Check the check box next to the row(s) for the CPE(s) you want to select. Then click Select.
Check the check box next to the row(s) for the CPE(s) you want to select. Then click Select.

Note ![]() Do not add a device chosen as a Source Device to Destination Device(s).
Do not add a device chosen as a Source Device to Destination Device(s).
You return to Figure 51-7 and the newly added Device Name appears.
Step 17 ![]() Click Select in the Interface column and a window appears.
Click Select in the Interface column and a window appears.
Step 18 ![]() Click the radio button next to the row for the CPE you want to select. Then click Select.
Click the radio button next to the row for the CPE you want to select. Then click Select.
Step 19 ![]() You return to Figure 51-7 and the newly added CPE Interface appears. You can change the CPE Interface by repeating Step 17.
You return to Figure 51-7 and the newly added CPE Interface appears. You can change the CPE Interface by repeating Step 17.
Step 20 ![]() Check the check box next to each row for the Devices you want to remove. Then click the Remove button and a window as shown in Figure 51-7 appears without the removed Device(s).
Check the check box next to each row for the Devices you want to remove. Then click the Remove button and a window as shown in Figure 51-7 appears without the removed Device(s).
Step 21 ![]() When Figure 51-7 reflects what you want, click Next and proceed to the "Protocols" section.
When Figure 51-7 reflects what you want, click Next and proceed to the "Protocols" section.
Create From MPLS PE or MVRF-CE
After you have completed the steps in Create Common Parameters, follow these steps:
Step 1 ![]() Complete the steps in the "Create Common Parameters" section and the next window to appear is as shown in Figure 51-8, "SLA Source and Destination Devices."
Complete the steps in the "Create Common Parameters" section and the next window to appear is as shown in Figure 51-8, "SLA Source and Destination Devices."
Figure 51-8 SLA Source and Destination Devices
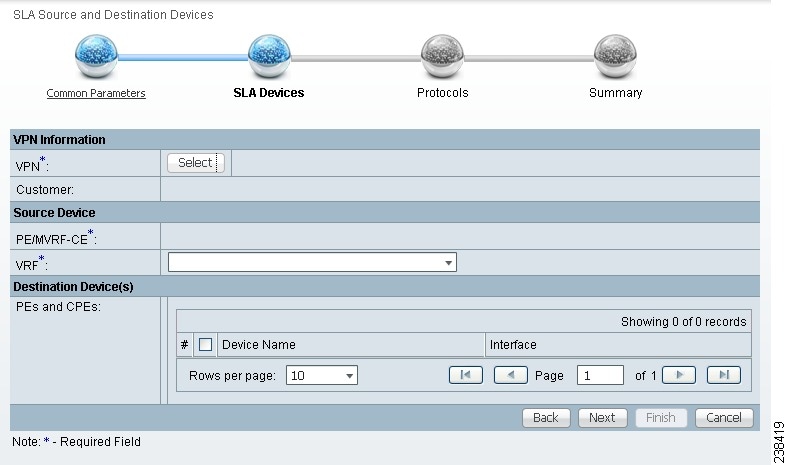
Step 2 ![]() Click the Select button for VPN and a window appears which lists all the VPNs in the database. Click the radio button next to the row for the VPN you want to select.
Click the Select button for VPN and a window appears which lists all the VPNs in the database. Click the radio button next to the row for the VPN you want to select.
Step 3 ![]() Then click Select.
Then click Select.
Step 4 ![]() You return to Figure 51-8 and the newly added VPN and Customer information appears. You can change the VPN and Customer by repeating Step 2.
You return to Figure 51-8 and the newly added VPN and Customer information appears. You can change the VPN and Customer by repeating Step 2.
Step 5 ![]() Click the new Select button for PE/MVRF-CE and you receive a drop-down list from which you can choose PE or MVRF-CE. If you choose PE, a window appears, which lists all the PEs associated with the selected VPN. If you choose MVRF-CE, a window appears, which lists all the MVRF-CEs associated with the selected VPN. Click the radio button next to the row for the PE or MVRF-CE you want to select. Then click Select or OK.
Click the new Select button for PE/MVRF-CE and you receive a drop-down list from which you can choose PE or MVRF-CE. If you choose PE, a window appears, which lists all the PEs associated with the selected VPN. If you choose MVRF-CE, a window appears, which lists all the MVRF-CEs associated with the selected VPN. Click the radio button next to the row for the PE or MVRF-CE you want to select. Then click Select or OK.
Step 6 ![]() You return to Figure 51-8 and the newly added PE or MVRF-CE information appears. You can change this selection by repeating Step 5.
You return to Figure 51-8 and the newly added PE or MVRF-CE information appears. You can change this selection by repeating Step 5.
Step 7 ![]() If in Step 5 you chose MVRF-CE information, you can click the VRF drop-down list.
If in Step 5 you chose MVRF-CE information, you can click the VRF drop-down list.
Step 8 ![]() Click the new Select button for Destination Device(s)—PEs and CPEs and from a drop-down list, choose PEs or CPEs. If you choose PEs, a window appears, which lists all the PE Interfaces in the database. If you choose CPEs, a window appears, which lists all the CPE Interfaces in the database. Click the radio button next to the row for the Device Interface you want to select. Then click Select.
Click the new Select button for Destination Device(s)—PEs and CPEs and from a drop-down list, choose PEs or CPEs. If you choose PEs, a window appears, which lists all the PE Interfaces in the database. If you choose CPEs, a window appears, which lists all the CPE Interfaces in the database. Click the radio button next to the row for the Device Interface you want to select. Then click Select.

Note ![]() Do not add a device chosen as a Source Device to Destination Device(s).
Do not add a device chosen as a Source Device to Destination Device(s).
Step 9 ![]() You return to Figure 51-8 and you receive interface information. Click Select and you get a window from which you can click a radio button next to a different interface. Click Select and the new interface replaces the old interface. You can change the Interface by repeating this step.
You return to Figure 51-8 and you receive interface information. Click Select and you get a window from which you can click a radio button next to a different interface. Click Select and the new interface replaces the old interface. You can change the Interface by repeating this step.
Step 10 ![]() Click Next and proceed to the "Protocols" section.
Click Next and proceed to the "Protocols" section.
Protocols
You choose this location after you have completed all the steps in one of the Create functions: Create Common Parameters; Create from MPLS CPE; or Create From MPLS PE or MVRF-CE. Follow these steps:
Step 1 ![]() Complete the steps in the "Create Common Parameters" section and the next window to appear is as shown in Figure 51-9.
Complete the steps in the "Create Common Parameters" section and the next window to appear is as shown in Figure 51-9.
Figure 51-9 Protocols

Step 2 ![]() Click the Add drop-down list and select:
Click the Add drop-down list and select:
•![]() ICMP Echo (only available if destination devices are available)—Proceed to Step 3.
ICMP Echo (only available if destination devices are available)—Proceed to Step 3.
•![]() TCP Connect (not available for Create From MPLS PE or MVRF-CE; for all the other Creates, TCP Connect is only available if destination devices are available)—Proceed to Step 4.
TCP Connect (not available for Create From MPLS PE or MVRF-CE; for all the other Creates, TCP Connect is only available if destination devices are available)—Proceed to Step 4.
•![]() UDP Echo (only available if destination devices are available)—Proceed to Step 5.
UDP Echo (only available if destination devices are available)—Proceed to Step 5.
•![]() Jitter (only available if destination devices are available)—Proceed to Step 6.
Jitter (only available if destination devices are available)—Proceed to Step 6.
•![]() FTP (not available for Create from MPLS PE or MVRF-CE)—Proceed to Step 7.
FTP (not available for Create from MPLS PE or MVRF-CE)—Proceed to Step 7.
•![]() DNS (not available for Create from MPLS PE or MVRF-CE)—Proceed to Step 8.
DNS (not available for Create from MPLS PE or MVRF-CE)—Proceed to Step 8.
•![]() HTTP (not available for Create from MPLS PE or MVRF-CE)—Proceed to Step 9.
HTTP (not available for Create from MPLS PE or MVRF-CE)—Proceed to Step 9.
•![]() DHCP (not available for Create from MPLS PE or MVRF-CE)—Proceed to Step 10.
DHCP (not available for Create from MPLS PE or MVRF-CE)—Proceed to Step 10.
Step 3 ![]() From Step 2, if you chose ICMP Echo, you receive a window as shown in Figure 51-10.
From Step 2, if you chose ICMP Echo, you receive a window as shown in Figure 51-10.
Figure 51-10 Protocol ICMP Echo

Enter the required information as follows, click OK, and then proceed to Step 11.
•![]() Request Size (0 - 16384) (required)—Number that represents the number of octets (in bytes) to be placed into the data portion of the packet. The default is 28.
Request Size (0 - 16384) (required)—Number that represents the number of octets (in bytes) to be placed into the data portion of the packet. The default is 28.
Step 4 ![]() From Step 2, if you chose TCP Connect, you receive a window as shown in Figure 51-11.
From Step 2, if you chose TCP Connect, you receive a window as shown in Figure 51-11.
Figure 51-11 Protocol TCP Connect
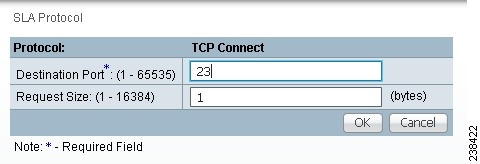
Enter the required and optional information as follows, click OK, and then proceed to Step 11.
•![]() Destination Port (1 - 65535) (required)—Port number on the target where the monitoring packets is sent. If you do not specify a specific port, port 23 is used.
Destination Port (1 - 65535) (required)—Port number on the target where the monitoring packets is sent. If you do not specify a specific port, port 23 is used.
•![]() Request Size (1 - 16384) (optional)—Number that represents the number of octets (in bytes) to be placed into the data portion of the packet. The default is 1.
Request Size (1 - 16384) (optional)—Number that represents the number of octets (in bytes) to be placed into the data portion of the packet. The default is 1.
Step 5 ![]() From Step 2, if you chose UDP Echo, you receive a window as shown in Figure 51-12.
From Step 2, if you chose UDP Echo, you receive a window as shown in Figure 51-12.
Figure 51-12 Protocol UDP Echo
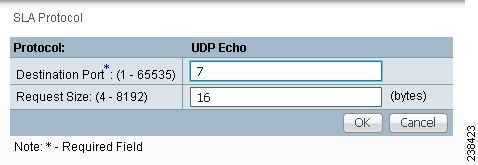
Enter the required and optional information as follows, click OK, and then proceed to Step 11.
•![]() Destination Port (1 - 65535) (required)—Port number on the target to where the monitoring packets are sent. If you do not specify a specific port, port 7 is used.
Destination Port (1 - 65535) (required)—Port number on the target to where the monitoring packets are sent. If you do not specify a specific port, port 7 is used.
•![]() Request Size (4 - 8192) (optional)—Number that represents the number of octets (in bytes) to be placed into the data portion of the packet. The default is 16.
Request Size (4 - 8192) (optional)—Number that represents the number of octets (in bytes) to be placed into the data portion of the packet. The default is 16.
Step 6 ![]() From Step 2, if you chose Jitter, you receive a window as shown in Figure 51-13.
From Step 2, if you chose Jitter, you receive a window as shown in Figure 51-13.
Figure 51-13 Protocol Jitter
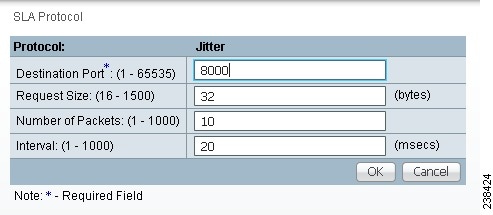
Enter the required and optional information as follows, click OK, and then proceed to Step 11.
•![]() Destination Port (1 - 65535) (required)—Port number on the target where the monitoring packets are sent. If you do not specify a specific port, port 8000 is used.
Destination Port (1 - 65535) (required)—Port number on the target where the monitoring packets are sent. If you do not specify a specific port, port 8000 is used.
•![]() Request Size (16 - 1500) (optional)—Number that represents the number of octets (in bytes) to be placed into the data portion of the packet. The default is 32.
Request Size (16 - 1500) (optional)—Number that represents the number of octets (in bytes) to be placed into the data portion of the packet. The default is 32.
•![]() Number of Packets (1 - 1000) (optional)—Integer that represents the number of packets that must be transmitted. The default value is 10.
Number of Packets (1 - 1000) (optional)—Integer that represents the number of packets that must be transmitted. The default value is 10.
•![]() Interval (1 - 1000) (optional)—Integer, 1 to 1,000, that represents the inter-packet delay between packets in milliseconds.The default value is 20.
Interval (1 - 1000) (optional)—Integer, 1 to 1,000, that represents the inter-packet delay between packets in milliseconds.The default value is 20.
Step 7 ![]() From Step 2, if you chose FTP, you receive a window as shown in Figure 51-14.
From Step 2, if you chose FTP, you receive a window as shown in Figure 51-14.
Figure 51-14 Protocol FTP
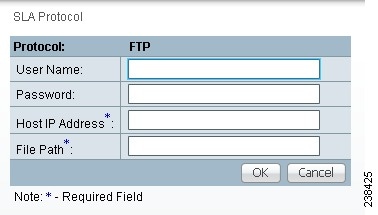
Enter the required and optional information as follows, click OK, and then proceed to Step 11.
•![]() User Name (optional)—If blank, anonymous is used.
User Name (optional)—If blank, anonymous is used.
•![]() Password (optional)—If blank, test is used.
Password (optional)—If blank, test is used.
•![]() Host IP Address (required)—Enter the IP address for File Transfer Protocol (FTP).
Host IP Address (required)—Enter the IP address for File Transfer Protocol (FTP).
•![]() File Path (required)—Enter the path of the file you want to FTP on the FTP server.
File Path (required)—Enter the path of the file you want to FTP on the FTP server.
Step 8 ![]() From Step 2, if you chose DNS, you receive a window as shown in Figure 51-15.
From Step 2, if you chose DNS, you receive a window as shown in Figure 51-15.
Figure 51-15 Protocol DNS
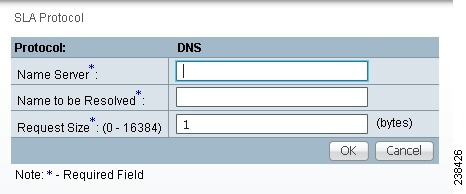
Enter the required information as follows, click OK, and then proceed to Step 11.
•![]() Name Server (required)—String that specifies the IP address of the name server. The address is in dotted IP address format.
Name Server (required)—String that specifies the IP address of the name server. The address is in dotted IP address format.
•![]() Name to be Resolved (required)—String that is either the name or the IP address that is to be resolved by the DNS server. If the string is a name, the length is 255 characters. If the string is an IP address, it is in dotted IP address format.
Name to be Resolved (required)—String that is either the name or the IP address that is to be resolved by the DNS server. If the string is a name, the length is 255 characters. If the string is an IP address, it is in dotted IP address format.
•![]() Request Size (0 - 16384) (required)—Number that represents the number of octets (in bytes) to be placed into the data portion of the packet. The default is 1.
Request Size (0 - 16384) (required)—Number that represents the number of octets (in bytes) to be placed into the data portion of the packet. The default is 1.
Step 9 ![]() From Step 2, if you chose HTTP, you receive a window as shown in Figure 51-16.
From Step 2, if you chose HTTP, you receive a window as shown in Figure 51-16.
Figure 51-16 Protocol HTTP
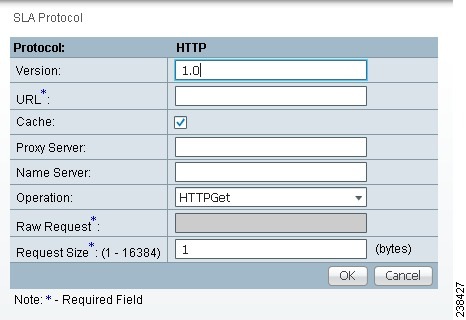
Enter the optional and required information as follows, click OK, and then proceed to Step 11.
•![]() Version (default: 1.0)—String that specifies the version of the HTTP server. Do not change this. Prime Fulfillment only supports version 1.0.
Version (default: 1.0)—String that specifies the version of the HTTP server. Do not change this. Prime Fulfillment only supports version 1.0.
•![]() URL (required)—String that represents the URL to which an HTTP probe should communicate, HTTPServerName[/directory]/filename or HTTPServerAddress[/directory]/filename (for example: http://www.cisco.com/index.html or http://209.165.201.22/index.html). If you specify the HTTPServerName, the Name Server is required. If you specify the HTTPServerAddress, the Name Server is not required.
URL (required)—String that represents the URL to which an HTTP probe should communicate, HTTPServerName[/directory]/filename or HTTPServerAddress[/directory]/filename (for example: http://www.cisco.com/index.html or http://209.165.201.22/index.html). If you specify the HTTPServerName, the Name Server is required. If you specify the HTTPServerAddress, the Name Server is not required.
•![]() Cache (default: selected, which means Yes)—For an unchecked check box, the HTTP request should not download cached pages. For a checked check box, the HTTP request downloads cached pages if available, otherwise the request is forwarded to the HTTP server.
Cache (default: selected, which means Yes)—For an unchecked check box, the HTTP request should not download cached pages. For a checked check box, the HTTP request downloads cached pages if available, otherwise the request is forwarded to the HTTP server.
•![]() Proxy Server (optional)—String that represents the proxy server information (with a maximum of 255 characters). The default is the null string.
Proxy Server (optional)—String that represents the proxy server information (with a maximum of 255 characters). The default is the null string.
•![]() Name Server (optional, dependent on the URL setting)—String that specifies the IP address of the name server. The address is in dotted IP address format.
Name Server (optional, dependent on the URL setting)—String that specifies the IP address of the name server. The address is in dotted IP address format.
•![]() Operation (default: HTTPGet)—If you want HTTPRaw, which represents the HTTP request with user defined payload, instead of the default HTTPGet which represents the HTTP get request, use the drop-down list and make that choice.
Operation (default: HTTPGet)—If you want HTTPRaw, which represents the HTTP request with user defined payload, instead of the default HTTPGet which represents the HTTP get request, use the drop-down list and make that choice.
•![]() Raw Request (required if the Operation is HTTPRaw; not available if the Operation is HTTPGet)—String that is only needed if the Operation is HTTPRaw. It allows you to invoke other types of HTTP operations other than the simple GET operation.
Raw Request (required if the Operation is HTTPRaw; not available if the Operation is HTTPGet)—String that is only needed if the Operation is HTTPRaw. It allows you to invoke other types of HTTP operations other than the simple GET operation.
•![]() Request Size (1 - 16384) (required)—Number that represents the number of octets (in bytes) to be placed into the data portion of the packet. The default is 28.
Request Size (1 - 16384) (required)—Number that represents the number of octets (in bytes) to be placed into the data portion of the packet. The default is 28.
Step 10 ![]() From Step 2, if you chose DHCP, you receive a window as shown in Figure 51-17.
From Step 2, if you chose DHCP, you receive a window as shown in Figure 51-17.
Figure 51-17 Protocol DHCP
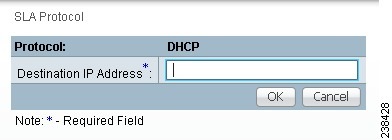
Enter the required information as follows, click OK, and then proceed to Step 11.
•![]() Destination IP Address (required)
Destination IP Address (required)
Step 11 ![]() You return to Figure 51-9 and additional columns of information now appear based on the Protocol information you provided. Before you click Next to proceed, determine if you want to Add more protocols, in which case repeat Step 2 to Step 10, or Delete any of the currently selected protocols, in which case, click Delete and proceed much as in Step 2 to Step 10 to now delete protocols.
You return to Figure 51-9 and additional columns of information now appear based on the Protocol information you provided. Before you click Next to proceed, determine if you want to Add more protocols, in which case repeat Step 2 to Step 10, or Delete any of the currently selected protocols, in which case, click Delete and proceed much as in Step 2 to Step 10 to now delete protocols.

Note ![]() There is no second chance for deleting destination devices. There is no confirm window.
There is no second chance for deleting destination devices. There is no confirm window.
Step 12 ![]() The next window to appear is a Probe Creation Task Summary window that shows the Description (date and time created), Common Parameters, Source Devices, Destination Devices, and Protocols that you have defined. If all exists the way you want it, click Finish. Otherwise, click Back and make corrections.
The next window to appear is a Probe Creation Task Summary window that shows the Description (date and time created), Common Parameters, Source Devices, Destination Devices, and Protocols that you have defined. If all exists the way you want it, click Finish. Otherwise, click Back and make corrections.
Details
When you choose Inventory > Device Tools > SLA, you can get details by following these steps:
Step 1 ![]() Select an existing probe by checking the corresponding check box for which you want details. Then you have access to the Details button, as shown in Figure 51-18.
Select an existing probe by checking the corresponding check box for which you want details. Then you have access to the Details button, as shown in Figure 51-18.
Figure 51-18 SLA Probes > Details

Step 2 ![]() After you click the Details button, you receive a window as shown in Figure 51-19. This includes the Common Attributes information defined when you first Create and the Protocol Specific Attributes information defined in the section Protocols.
After you click the Details button, you receive a window as shown in Figure 51-19. This includes the Common Attributes information defined when you first Create and the Protocol Specific Attributes information defined in the section Protocols.
Figure 51-19 SLA Probes Details
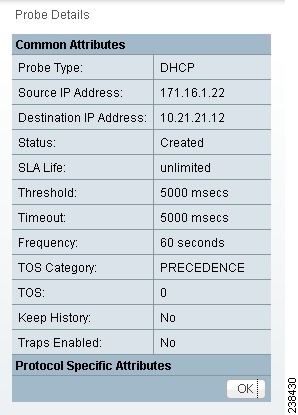
Step 3 ![]() Click OK to return to a window as shown in Figure 51-18. You can continue to select more Details or complete another function.
Click OK to return to a window as shown in Figure 51-18. You can continue to select more Details or complete another function.
Delete
When you choose Inventory > Device Tools > SLA, you can delete probes from the list by following these steps:
Step 1 ![]() Select one or more existing probes by checking the check box(es) for the row(s) of existing probe(s). Then you have access to the Delete button.
Select one or more existing probes by checking the check box(es) for the row(s) of existing probe(s). Then you have access to the Delete button.
Step 2 ![]() After you click the Delete button, a confirmation window appears.
After you click the Delete button, a confirmation window appears.
Step 3 ![]() Click OK if it reflects what you want to delete or click Cancel if it does not.
Click OK if it reflects what you want to delete or click Cancel if it does not.

Note ![]() After the probe is deleted, it is deleted from the probe list page but still remains in the database.
After the probe is deleted, it is deleted from the probe list page but still remains in the database.
You return to window with updated information.
Enable Probes
When you choose Inventory > Device Tools > SLA, you can enable probes by following these steps:
Step 1 ![]() Select one or more existing probes by checking the check box(es) for the row(s) of existing probe(s). Then you have access to the Enable button. From the Enable drop-down list, you have access to Probes, as shown in Figure 51-20.
Select one or more existing probes by checking the check box(es) for the row(s) of existing probe(s). Then you have access to the Enable button. From the Enable drop-down list, you have access to Probes, as shown in Figure 51-20.
Figure 51-20 SLA Probes > Enable > Probes

Step 2 ![]() After you choose Enable > Probes, a confirm enable probes window appears.
After you choose Enable > Probes, a confirm enable probes window appears.
Step 3 ![]() Click OK if it reflects the probes you want to enable or click Cancel if it does not.
Click OK if it reflects the probes you want to enable or click Cancel if it does not.
In both cases, you return to Figure 51-20. If this was successful, you receive a Status window with a green check mark for Succeeded. The Status column is set to Active when the probe is created successfully on the router.
Enable Traps
When you choose Inventory > Device Tools > SLA, you can enable traps by following these steps:
Step 1 ![]() Select one or more existing probes by checking the check box(es) for the row(s) of existing probe(s). Then you have access to the Enable button. From the Enable drop-down list, you have access to Traps, as shown in Figure 51-21.
Select one or more existing probes by checking the check box(es) for the row(s) of existing probe(s). Then you have access to the Enable button. From the Enable drop-down list, you have access to Traps, as shown in Figure 51-21.
Figure 51-21 SLA Probes > Enable > Traps

Step 2 ![]() After you choose Enable > Traps, a confirm enable traps window appears. All the traps have 3000 ms as the falling threshold set automatically
After you choose Enable > Traps, a confirm enable traps window appears. All the traps have 3000 ms as the falling threshold set automatically
Step 3 ![]() Click OK if it reflects the traps you want to enable or click Cancel if it does not.
Click OK if it reflects the traps you want to enable or click Cancel if it does not.
In both cases you return to Figure 51-21. If this was successful, you receive a Status window with a green check mark for Succeeded. The Traps Enabled column is set to yes when the probes on the router are successfully changed.
Disable Probes
When you choose Inventory > Device Tools > SLA, you can use Disable Probes to delete probes on the devices. Follow these steps:
Step 1 ![]() Select one or more enabled probes by checking the check box(es) for the row(s) of existing probe(s). Then you have access to the Disable button. From the Disable drop-down list, you have access to Probes, as shown in Figure 51-22.
Select one or more enabled probes by checking the check box(es) for the row(s) of existing probe(s). Then you have access to the Disable button. From the Disable drop-down list, you have access to Probes, as shown in Figure 51-22.
Figure 51-22 SLA Probes > Disable > Probes

Step 2 ![]() After you choose Disable > Probes, a confirm disable probes window appears.
After you choose Disable > Probes, a confirm disable probes window appears.
Step 3 ![]() Click OK if it reflects the probes you want to disable or click Cancel if it does not.
Click OK if it reflects the probes you want to disable or click Cancel if it does not.
In both cases you return to Figure 51-22. If this was successful, you receive a Status window with a green check mark for Succeeded, and the probe's status becomes Disabled when the probe on the router is successfully removed.
Disable Traps
When you choose Inventory > Device Tools > SLA, you can disable traps by following these steps:
Step 1 ![]() Select one or more existing probes by checking the check box(es) for the row(s) of existing probe(s). Then you have access to the Disable button. From the Disable drop-down list, you have access to Traps, as shown in Figure 51-23.
Select one or more existing probes by checking the check box(es) for the row(s) of existing probe(s). Then you have access to the Disable button. From the Disable drop-down list, you have access to Traps, as shown in Figure 51-23.
Figure 51-23 SLA Probes > Disable > Traps

Step 2 ![]() After you choose Disable > Traps, a confirm disable traps window appears.
After you choose Disable > Traps, a confirm disable traps window appears.
Step 3 ![]() Click OK if it reflects the traps you want to disable or click Cancel if it does not.
Click OK if it reflects the traps you want to disable or click Cancel if it does not.
In both cases you return to Figure 51-23. If this was successful, you receive a Status window with a green check mark for Succeeded. The traps are disabled when the probes on the router are successfully changed.
Reports
When you choose Inventory > Device Tools > SLA, you receive a window as shown in Figure 51-24.
Figure 51-24 SLA Reports

You can then click on any of the following choices and receive that report
•![]() Summary Report—This report summarizes all the information other than for HTTP and Jitter (ICMP Echo, TCP Connect, UDP Echo, FTP, DNS, and DHCP).
Summary Report—This report summarizes all the information other than for HTTP and Jitter (ICMP Echo, TCP Connect, UDP Echo, FTP, DNS, and DHCP).
•![]() HTTP Report—This is a summary report for HTTP information.
HTTP Report—This is a summary report for HTTP information.
•![]() Jitter Report—This is a summary report for Jitter information.
Jitter Report—This is a summary report for Jitter information.
•![]() Summary CoS Report—This report a summary report for Class of Service (CoS) other than for HTTP and Jitter (ICMP Echo, TCP Connect, UDP Echo, FTP, DNS, and DHCP).
Summary CoS Report—This report a summary report for Class of Service (CoS) other than for HTTP and Jitter (ICMP Echo, TCP Connect, UDP Echo, FTP, DNS, and DHCP).
•![]() HTTP CoS Report—This report is for HTTP CoS information.
HTTP CoS Report—This report is for HTTP CoS information.
•![]() Jitter CoS Report—This report is for Jitter CoS information.
Jitter CoS Report—This report is for Jitter CoS information.
Summary Report
From Figure 51-24, choose Summary Report and follow these steps:
Step 1 ![]() Choose Summary Report, and the resulting window is shown in Figure 51-25.
Choose Summary Report, and the resulting window is shown in Figure 51-25.
Figure 51-25 Parameters of Summary Report
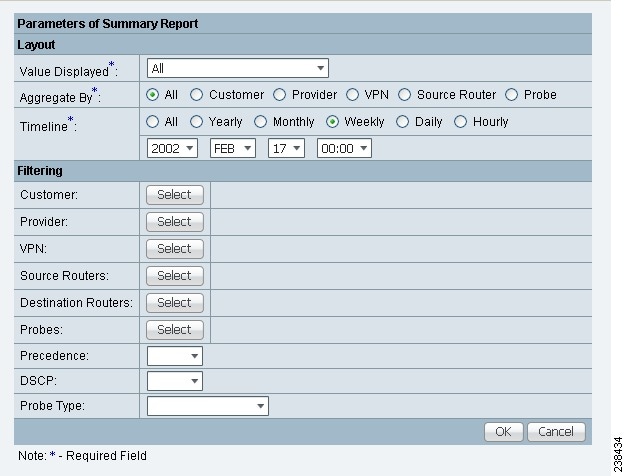
Step 2 ![]() For Figure 51-25, fill in the Layout fields, as follows:
For Figure 51-25, fill in the Layout fields, as follows:
•![]() Value Displayed (required) (default: All) Click the drop-down list and choose one of the following:
Value Displayed (required) (default: All) Click the drop-down list and choose one of the following:
–![]() All—To display all the values.
All—To display all the values.
–![]() Connections (#)—To display the number of connections.
Connections (#)—To display the number of connections.
–![]() Timeouts (#)—To display the number of timeouts.
Timeouts (#)—To display the number of timeouts.
–![]() Connectivity (%)—To display connectivity as a percentage.
Connectivity (%)—To display connectivity as a percentage.
–![]() Threshold Violations (%)—To display threshold violations as a percentage.
Threshold Violations (%)—To display threshold violations as a percentage.
–![]() Max Delay (ms)—To display the maximum delay in milliseconds.
Max Delay (ms)—To display the maximum delay in milliseconds.
–![]() Min Delay (ms)—To display the minimum delay in milliseconds.
Min Delay (ms)—To display the minimum delay in milliseconds.
–![]() Avg Delay (ms)—To display the average delay in milliseconds.
Avg Delay (ms)—To display the average delay in milliseconds.
•![]() Aggregate By (required) (default: All) Click the radio button for how you want to aggregate the data, by All, Customer, Provider, VPN, Source Router, or Probe.
Aggregate By (required) (default: All) Click the radio button for how you want to aggregate the data, by All, Customer, Provider, VPN, Source Router, or Probe.
•![]() Timeline (required) (default: Weekly; starting with midnight of the first day of the selected week) Click the radio button for the report data that you want to display, All data; Yearly data; Monthly data; Weekly data; Daily data; or Hourly data. Also click the drop-down lists for the year, month, day of the month, and time of day for which to start the report.
Timeline (required) (default: Weekly; starting with midnight of the first day of the selected week) Click the radio button for the report data that you want to display, All data; Yearly data; Monthly data; Weekly data; Daily data; or Hourly data. Also click the drop-down lists for the year, month, day of the month, and time of day for which to start the report.
Step 3 ![]() For Figure 51-25, fill in the Filtering fields, as follows.
For Figure 51-25, fill in the Filtering fields, as follows.

Note ![]() The report contains only the data that fulfills all the conditions in the filtering fields (all the conditions are ANDed together).
The report contains only the data that fulfills all the conditions in the filtering fields (all the conditions are ANDed together).
•![]() Customer (optional)—Click the Select button and from the resulting list of Customers, filter the list if you choose. From the listed Customers, click the radio button for the Customer for which you want this SLA report. Then click Select. The result is that you return to Figure 51-25 and the selected customer is listed for Customer. You can repeat this process if you want to change your selection.
Customer (optional)—Click the Select button and from the resulting list of Customers, filter the list if you choose. From the listed Customers, click the radio button for the Customer for which you want this SLA report. Then click Select. The result is that you return to Figure 51-25 and the selected customer is listed for Customer. You can repeat this process if you want to change your selection.
•![]() Provider (optional)—Click the Select button and from the resulting list of Providers, filter the list if you choose. From the listed Providers, click the radio button for the Provider for which you want this SLA report. Then click Select. The result is that you return to Figure 51-25 and the selected provider is listed for Provider. You can repeat this process if you want to change your selection.
Provider (optional)—Click the Select button and from the resulting list of Providers, filter the list if you choose. From the listed Providers, click the radio button for the Provider for which you want this SLA report. Then click Select. The result is that you return to Figure 51-25 and the selected provider is listed for Provider. You can repeat this process if you want to change your selection.
•![]() VPN (optional)—Click the Select button and from the resulting list of VPNs, filter the list if you choose. From the listed VPNs, click the radio button for the VPN for which you want this SLA report. Then click Select. The result is that you return to Figure 51-25 and the selected VPN is listed for VPN. You can repeat this process if you want to change your selection.
VPN (optional)—Click the Select button and from the resulting list of VPNs, filter the list if you choose. From the listed VPNs, click the radio button for the VPN for which you want this SLA report. Then click Select. The result is that you return to Figure 51-25 and the selected VPN is listed for VPN. You can repeat this process if you want to change your selection.
•![]() Source Routers (optional)—Click the Select button and from the resulting list of devices, filter the list if you choose. From the listed devices, check the check box(es) for device(s). Then click Select. The result is that you return to Figure 51-25 and Source Routers contains the selected device(s). You can repeat this process if you want to change your selection.
Source Routers (optional)—Click the Select button and from the resulting list of devices, filter the list if you choose. From the listed devices, check the check box(es) for device(s). Then click Select. The result is that you return to Figure 51-25 and Source Routers contains the selected device(s). You can repeat this process if you want to change your selection.
•![]() Destination Routers (optional)—Click the Select button and from the resulting list of devices, filter the list if you choose. From the listed devices, check the check box(es) for device(s). Then click Select. The result is that you return to Figure 51-25 and Destination Routers contains the selected device(s). You can repeat this process if you want to change your selection.
Destination Routers (optional)—Click the Select button and from the resulting list of devices, filter the list if you choose. From the listed devices, check the check box(es) for device(s). Then click Select. The result is that you return to Figure 51-25 and Destination Routers contains the selected device(s). You can repeat this process if you want to change your selection.
•![]() Probes (optional)—Click the Select button and from the resulting list of source probes, filter the list if you choose. From the listed source probes, check the check box(es) for source probe(s). Then click Select. The result is that you return to Figure 51-25 and Probes contains the selected source probe(s). You can repeat this process if you want to change your selection.
Probes (optional)—Click the Select button and from the resulting list of source probes, filter the list if you choose. From the listed source probes, check the check box(es) for source probe(s). Then click Select. The result is that you return to Figure 51-25 and Probes contains the selected source probe(s). You can repeat this process if you want to change your selection.
•![]() Precedence (default: All)—Click the drop-down list to select the other Precedence TOS choices, 0 to 7. These values represent the three most significant bits of the ToS field in an IP header. The meanings of the Precedence values are specified in Table 51-1.
Precedence (default: All)—Click the drop-down list to select the other Precedence TOS choices, 0 to 7. These values represent the three most significant bits of the ToS field in an IP header. The meanings of the Precedence values are specified in Table 51-1.

Note ![]() Prime Fulfillment maps the 0 - 7 PRECEDENCE values to the three most significant ToS bits by left-shifting the value by five positions.
Prime Fulfillment maps the 0 - 7 PRECEDENCE values to the three most significant ToS bits by left-shifting the value by five positions.

Note ![]() Type of Service does not apply to the DNS and DHCP types of SLA probes. Prime Fulfillment ignores any ToS value set for these two types of SLA probes. For example, if you first choose a ToS value of 5, then choose the DNS, DHCP, and ICMP Echo protocols for an SLA probe, Prime Fulfillment applies the selected ToS value to the ICMP Echo probe only.
Type of Service does not apply to the DNS and DHCP types of SLA probes. Prime Fulfillment ignores any ToS value set for these two types of SLA probes. For example, if you first choose a ToS value of 5, then choose the DNS, DHCP, and ICMP Echo protocols for an SLA probe, Prime Fulfillment applies the selected ToS value to the ICMP Echo probe only.
•![]() DSCP (default: All)—Click the drop-down list to select the other DSCP TOS choices, 0 to 63. These values represent the six most significant bits of this ToS field in an IP header. The interpretation of these TOS values is user specified.
DSCP (default: All)—Click the drop-down list to select the other DSCP TOS choices, 0 to 63. These values represent the six most significant bits of this ToS field in an IP header. The interpretation of these TOS values is user specified.

Note ![]() Prime Fulfillment maps the 0 - 63 DSCP values to the six most significant ToS bits by left-shifting the values by two positions.
Prime Fulfillment maps the 0 - 63 DSCP values to the six most significant ToS bits by left-shifting the values by two positions.
•![]() Probe Type (default: All)—Click the drop-down list to select from the following types of probes: ICMP Echo; UDP Echo; TCP Connect; HTTP; DNS; Jitter; DHCP; FTP.
Probe Type (default: All)—Click the drop-down list to select from the following types of probes: ICMP Echo; UDP Echo; TCP Connect; HTTP; DNS; Jitter; DHCP; FTP.

Note ![]() These probe types are explained in detail in the "Protocols" section.
These probe types are explained in detail in the "Protocols" section.
Step 4 ![]() Click OK in Figure 51-25 after you have the information you want.
Click OK in Figure 51-25 after you have the information you want.
The result is a Summary Report with the selections you made listed. You can Modify, Refresh, Print, or Close this report with the appropriate button.

Note ![]() If you choose Modify, you receive a window such as Figure 51-25 in which you can modify your selections as explained in the previous steps.
If you choose Modify, you receive a window such as Figure 51-25 in which you can modify your selections as explained in the previous steps.
HTTP Report
From Figure 51-24, choose HTTP Report and proceed similarly to the "Summary Report" section, with the following exceptions:
•![]() Value Displayed has different drop-down choices.
Value Displayed has different drop-down choices.
•![]() There is no Destination Routers selection.
There is no Destination Routers selection.
•![]() There is no Probe Type drop-down list in the equivalent of Figure 51-25, because the probe type is automatically HTTP. The result is an HTTP Report.
There is no Probe Type drop-down list in the equivalent of Figure 51-25, because the probe type is automatically HTTP. The result is an HTTP Report.
Jitter Report
From Figure 51-24, choose Jitter Report and proceed similarly to the "Summary Report" section, with the following exceptions:
•![]() Value Displayed has different drop-down choices.
Value Displayed has different drop-down choices.
•![]() There is no Destination Routers selection.
There is no Destination Routers selection.
•![]() There is no Probe Type drop-down list in the equivalent of Figure 51-25, because the probe type is automatically Jitter. The result is a Jitter Report.
There is no Probe Type drop-down list in the equivalent of Figure 51-25, because the probe type is automatically Jitter. The result is a Jitter Report.
Summary CoS Report
From Figure 51-24, choose Summary CoS Report for a summary of the Class of Service (CoS) reports, which are based on the TOS values of the SLA probes, and follow these steps:
Step 1 ![]() Choose Summary CoS Report, and the resulting window is shown in Figure 51-26.
Choose Summary CoS Report, and the resulting window is shown in Figure 51-26.
Figure 51-26 Parameters of CoS Summary Report
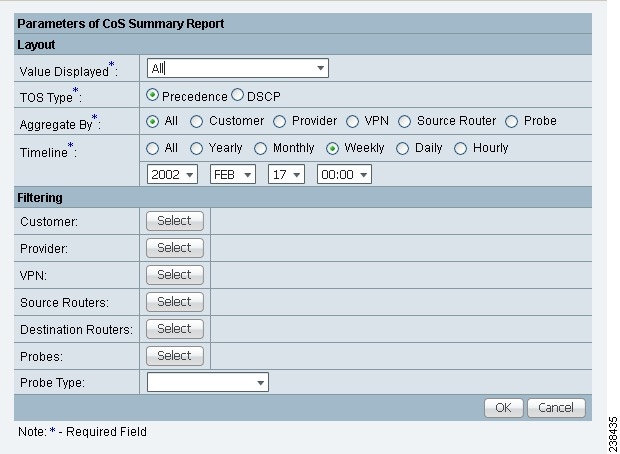
Step 2 ![]() For Figure 51-26, fill in the Layout fields, as shown in Step 2 of the "Summary Report" section, with the following exception. After Value Displayed and before Aggregate By, select the radio button Precedence (default) or DSCP for the new TOS Type. The explanations are given in the Filtering section, Step 3 of the "Summary Report" section.
For Figure 51-26, fill in the Layout fields, as shown in Step 2 of the "Summary Report" section, with the following exception. After Value Displayed and before Aggregate By, select the radio button Precedence (default) or DSCP for the new TOS Type. The explanations are given in the Filtering section, Step 3 of the "Summary Report" section.
Step 3 ![]() For Figure 51-26, fill in the Filtering fields, as shown in Step 3 of the "Summary Report" section, with the exception that there are no Precedence or DSCP drop-down lists. They are now in the Layout fields, as explained in Step 2 in this section.
For Figure 51-26, fill in the Filtering fields, as shown in Step 3 of the "Summary Report" section, with the exception that there are no Precedence or DSCP drop-down lists. They are now in the Layout fields, as explained in Step 2 in this section.
Step 4 ![]() Click OK in Figure 51-26 after you have the information you want.
Click OK in Figure 51-26 after you have the information you want.
The result is a CoS Summary Report with the selections you made listed. You can Modify, Refresh, Print, or Close this report with the appropriate button.

Note ![]() If you choose Modify, you receive a window such as Figure 51-26 in which you can modify your selections as explained in the previous steps.
If you choose Modify, you receive a window such as Figure 51-26 in which you can modify your selections as explained in the previous steps.
HTTP CoS Report
From Figure 51-24, choose HTTP Report and proceed exactly as in the "Summary CoS Report" section, with the following exceptions:
•![]() Value Displayed has the same drop-down choices as HTTP Report.
Value Displayed has the same drop-down choices as HTTP Report.
•![]() There is no Destination Routers selection.
There is no Destination Routers selection.
•![]() There is no Probe Type drop-down list in the equivalent of Figure 51-26, because the probe type is automatically HTTP CoS. The result is a CoS HTTP Report. This CoS HTTP report is based on the TOS values of the SLA probes.
There is no Probe Type drop-down list in the equivalent of Figure 51-26, because the probe type is automatically HTTP CoS. The result is a CoS HTTP Report. This CoS HTTP report is based on the TOS values of the SLA probes.
Jitter CoS Report
From Figure 51-24, choose Jitter Report and proceed exactly as in the "Summary CoS Report" section, with he following exceptions:
•![]() Value Displayed has the same drop-down choices as Jitter Report.
Value Displayed has the same drop-down choices as Jitter Report.
•![]() There is no Destination Routers selection.
There is no Destination Routers selection.
•![]() There is no Probe Type drop-down list in the equivalent of Figure 51-26, because the probe type is automatically Jitter CoS. The result is a CoS Jitter Report. This CoS Jitter report is based on the TOS values of the SLA probes.
There is no Probe Type drop-down list in the equivalent of Figure 51-26, because the probe type is automatically Jitter CoS. The result is a CoS Jitter Report. This CoS Jitter report is based on the TOS values of the SLA probes.
 Feedback