- About This Book
-
- Getting Started
- Setting Up the Prime Fulfillment Services for L2VPN
- Creating a FlexUNI/EVC Ethernet Policy
- Creating a FlexUNI/EVC Ethernet Service Request
- Creating a FlexUNI/EVC ATM-Ethernet Interworking Policy
- Creating a FlexUNI/EVC ATM-Ethernet Interworking Service Request
- Creating an L2VPN Policy
- Creating an L2VPN Service Request
- Creating a VPLS Policy
- Creating a VPLS Service Request
- Deploying, Monitoring, and Auditing Service Requests
- Using Auto Discovery for L2 Services
- Sample Configlets
- Setting Up VLAN Translation
-
- Getting Started with MPLS VPN
- Setting Up the Prime Fulfillment Services
- Independent VRF Management
- IPv6 and 6VPE Support in MPLS VPN
- MPLS VPN Service Policies
- MPLS VPN Service Requests
- Provisioning Regular PE-CE Links
- Provisioning Multi-VRFCE PE-CE Links
- Provisioning Management VPN
- Provisioning Cable Services
- Provisioning Carrier Supporting Carrier
- Provisioning Multiple Devices
- Spanning Multiple Autonomous Systems
- Sample Configlets
- Troubleshooting MPLS VPNs
Cisco Prime Fulfillment User Guide 6.1
Bias-Free Language
The documentation set for this product strives to use bias-free language. For the purposes of this documentation set, bias-free is defined as language that does not imply discrimination based on age, disability, gender, racial identity, ethnic identity, sexual orientation, socioeconomic status, and intersectionality. Exceptions may be present in the documentation due to language that is hardcoded in the user interfaces of the product software, language used based on RFP documentation, or language that is used by a referenced third-party product. Learn more about how Cisco is using Inclusive Language.
- Updated:
- March 20, 2015
Chapter: How Does Cisco MPLS Diagnostics Expert Work
How Does Cisco Prime Diagnostics Work?
This chapter describes how the Cisco Prime Diagnostics application works.
The MPLS VPN Connectivity Verification test consists of connectivity testing, troubleshooting, and diagnostics steps. The exact steps performed for each test depend upon the nature of the failure found and the location of the failure within the network. Due to the simple test configuration and result presentation, you have little need to understand the troubleshooting and diagnostics logic. However, in some cases - particularly when examining the test log - you might want an understanding of the troubleshooting and diagnostics process. This chapter provides a high-level overview of the connectivity testing, troubleshooting, and diagnostics logic.

Note ![]() The steps detailed in this chapter are illustrative of the types of tests that Diagnostics performs. However, this list of tests is not exhaustive; Diagnostics performs many more tests.
The steps detailed in this chapter are illustrative of the types of tests that Diagnostics performs. However, this list of tests is not exhaustive; Diagnostics performs many more tests.
The test scope is determined by the test configuration you enter. For example, for each site, testing could be performed to a customer device within the site or to the CE access circuit interface. For simplicity, this chapter assumes that testing for all sites is to the CE access circuit interface.
The first step tests VPN connectivity between the two sites to determine if a problem exists. This is achieved using the Cisco IOS VRF ping functionality. Ideally, this test should be initiated from a device in the local site subnet to a destination IP address in the remote site subnet. However, Prime Fulfillment supports managed and unmanaged Cisco CE devices, and non-Cisco CE devices. The troubleshooting and diagnostics functionality works for all cases. As a result, it is only possible to initiate tests from PE and P devices within your core network. To work around this limitation, it is necessary to perform the connectivity test in two stages (see Figure 60-1).
Figure 60-1 IOS VRF Ping Connectivity Tests
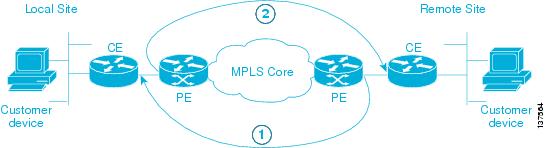
1. ![]() The first stage (see Figure 60-1) tests connectivity from the remote site PE to the local site CE. This is achieved using a Cisco IOS ping vrf command, specifying the local site CE access circuit interface IP address as the destination and the remote site PE access circuit interface as the source IP address.
The first stage (see Figure 60-1) tests connectivity from the remote site PE to the local site CE. This is achieved using a Cisco IOS ping vrf command, specifying the local site CE access circuit interface IP address as the destination and the remote site PE access circuit interface as the source IP address.
2. ![]() The second stage (see Figure 60-1) tests connectivity from the local site PE to the remote site CE. The second stage is performed only when the ping vrf command in the first stage indicates successful connectivity. This is also achieved using a Cisco IOS ping vrf command, specifying the remote site CE access circuit interface IP address as the destination and the local site PE access circuit interface as the source IP address.
The second stage (see Figure 60-1) tests connectivity from the local site PE to the remote site CE. The second stage is performed only when the ping vrf command in the first stage indicates successful connectivity. This is also achieved using a Cisco IOS ping vrf command, specifying the remote site CE access circuit interface IP address as the destination and the local site PE access circuit interface as the source IP address.
Performing the connectivity test from the remote site PE to the local site CE first ensures that any problems with the local access circuit are found first. This means that any reverse-path MPLS VPN, MPLS core, and MPLS TE Tunnel problems will be found before forward-path problems.
By testing connectivity in two stages, the troubleshooting and diagnostics functionality is able to simulate an end-to-end test from the local site CE to the remote site CE, and thus identify any VPN connectivity problems between the sites. This connectivity test exercises VPN, MPLS, and IP connectivity between the two sites.
If a VPN connectivity problem is not detected, then no troubleshooting and diagnostics are performed. If a VRF connectivity problem is detected, then a further series of connectivity tests are performed in an attempt to isolate the connectivity problem. These tests are initiated on the PE device and performed in the direction for which a VPN failure was detected. They include:
•![]() VRF ping across core to PE access circuit interface. This determines if the failure lies on the access circuit, between the CE and PE or in the core.
VRF ping across core to PE access circuit interface. This determines if the failure lies on the access circuit, between the CE and PE or in the core.
•![]() ICMP ping across core to PE loopback—This confirms that IP connectivity is working across the core.
ICMP ping across core to PE loopback—This confirms that IP connectivity is working across the core.
•![]() LSP ping across core to PE loopback—This confirms that the MPLS LSP path across the core is working.
LSP ping across core to PE loopback—This confirms that the MPLS LSP path across the core is working.
Testing might stop at any point if the fault is isolated. A sequence of automated troubleshooting and diagnostics steps is then performed to diagnose the cause of the fault. The steps performed depend upon the nature and location of the fault. Troubleshooting is performed in the following order:
1. ![]() Access circuit (local and remote).
Access circuit (local and remote).
a. ![]() L3 connectivity (VRF pings and trace to CE and Customer Device) and route checks.
L3 connectivity (VRF pings and trace to CE and Customer Device) and route checks.
b. ![]() L2 (ATM, Ethernet, Frame Relay, Serial) connectivity and status checks.
L2 (ATM, Ethernet, Frame Relay, Serial) connectivity and status checks.
c. ![]() PE-CE routing protocol determination and status checks.
PE-CE routing protocol determination and status checks.
d. ![]() PE-CE routing protocol and MP-BGP redistribution checks.
PE-CE routing protocol and MP-BGP redistribution checks.
2. ![]() MPLS VPN edge.
MPLS VPN edge.
a. ![]() MP-BGP neighbor and VPN route checks.
MP-BGP neighbor and VPN route checks.
b. ![]() VRF route limit and checks.
VRF route limit and checks.
c. ![]() Route map presence checks.
Route map presence checks.
d. ![]() PE-PE VRF (VRF pings and trace across MPLS core) connectivity checks.
PE-PE VRF (VRF pings and trace across MPLS core) connectivity checks.
e. ![]() PE MPLS OAM capability checks.
PE MPLS OAM capability checks.
3. ![]() MPLS Traffic Engineered (TE) tunnels.
MPLS Traffic Engineered (TE) tunnels.
a. ![]() Tunnel connectivity (TE aware ping and trace) and status checks.
Tunnel connectivity (TE aware ping and trace) and status checks.
4. ![]() MPLS core.
MPLS core.
a. ![]() IP connectivity (ICMP ping) checks.
IP connectivity (ICMP ping) checks.
b. ![]() LSP connectivity (LSP ping and trace) and status checks.
LSP connectivity (LSP ping and trace) and status checks.
c. ![]() LSP datapath generation.
LSP datapath generation.
d. ![]() LSP fault localization.
LSP fault localization.
e. ![]() LDP session and neighbor checks.
LDP session and neighbor checks.
f. ![]() Label checks.
Label checks.
g. ![]() MPLS VPN edge.
MPLS VPN edge.
h. ![]() VPN label checks.
VPN label checks.
i. ![]() VRF route target checks.
VRF route target checks.
Note ![]() Core troubleshooting will only be performed for PE devices which support the Cisco IOS MPLS LSP Ping and Traceroute feature. For details of supported device types and Cisco IOS versions with MPLS OAM support, see Chapter 57, "Supported Hardware, IOS, and IOS XR Versions".
Core troubleshooting will only be performed for PE devices which support the Cisco IOS MPLS LSP Ping and Traceroute feature. For details of supported device types and Cisco IOS versions with MPLS OAM support, see Chapter 57, "Supported Hardware, IOS, and IOS XR Versions".
Note ![]() Diagnostics troubleshoots the primary tunnel if it is configured with FRR protection and reports the possible failures found in the primary tunnel and backup tunnels (providing FRR protection to the primary tunnel). The backup tunnel troubleshooting is limited to tunnels that are configured to protect the FRR enabled primary tunnel configured between ABRs.
Diagnostics troubleshoots the primary tunnel if it is configured with FRR protection and reports the possible failures found in the primary tunnel and backup tunnels (providing FRR protection to the primary tunnel). The backup tunnel troubleshooting is limited to tunnels that are configured to protect the FRR enabled primary tunnel configured between ABRs.
After a fault diagnosis has been made, the result is displayed in the Test Results window with appropriate recommended actions to resolve the fault. The exact connectivity testing and automated troubleshooting and diagnostics steps performed can be viewed in the Test Log section of the Test Results window.
 Feedback