This topic explains how to navigate the APIC GUI, detailing the menu and submenu bars, and the various tools available for configuration, search, notifications, and user preferences.
The menu bar provides access to the main configuration tabs, along with access to tools such as search, notifications, and preferences. Immediately below the menu bar is the submenu bar, which presents specific configuration areas for each selected menu bar tab. The submenu bar tabs are different for each menu bar tab and might also differ depending upon your specific configuration or privilege level.
Tip
In the APIC GUI configuration instructions, you will see notation such as Fabric > Fabric Policies. In this example, you are asked to click the Fabric tab in the menu bar followed by the Fabric Policies tab in the submenu bar.
The menu bar is displayed across the top of the APIC GUI. At the far right side of the menu bar are the menu bar tools (these are described in detail in the subsequent sections).
username: the name of the currently logged in local user.
: the Search icon.
: the Multi-site manager icon to launch the multi-site manager.
: the Feedback icon to send comments to Cisco.
: the Alerts icon to view the list of active alerts.
: the Tools icon to access the system tools.
: the Help icon.
: the Manage my profile icon. The logged-in use can configure settings and preferences.
Menu bar tabs
The menu bar is displayed at the top of the APIC GUI. The menu bar serves as the vital navigation area, allowing you to access key configuration tabs. It also includes convenient tools such as search, notifications, and preferences, enabling you to manage settings. The menu bar tabs are discussed in detail in this section.
System tab
Use the System tab to collect and display a summary of the overall system health, its history, and a table of system-level faults.
In addition, the System tab provides the following functions:
You can configure global system policies in the System Settings submenu.
You can view your licensing status in the Smart Licensing submenu.
You can view user sessions in the Active Sessions submenu.
Tenants tab
Use the Tenants tab in the menu bar to perform tenant management. The submenu bar provides a list of all tenants, an Add Tenant link, and links to three built-in tenants plus up to two of the most recently used tenants.
The built-in tenants are:
The common tenant is preconfigured for defining policies that provide common behavior for all the tenants in the fabric. A policy defined in the common tenant is usable by any tenant.
The infra tenant is preconfigured for configuration related to the fabric infrastructure
The mgmt tenant is preconfigured for inband and out-of-band connectivity configurations of hosts and fabric nodes (leafs, spines, and controllers).
Fabric tab
The Fabric tab contains the following tabs in the submenu bar:
Inventory tab: Displays the individual components of the fabric.
Fabric Policies tab: Displays the monitoring and troubleshooting policies and fabric protocol settings or fabric maximum transmission unit (MTU) settings.
Access Policies tab: Displays the access policies that apply to the edge ports of the system. These ports are on the leaf switches that communicate externally.
Virtual networking tab
Use the Virtual Networking tab to view and configure the inventory of the various virtual machine (VM) managers. You can configure and create various management domains under which connections to individual management systems (such as VMware vCenters or Nutanix hypervisors) can be configured.
Use the Inventory tab in the submenu bar to view the hypervisors and VMs that are managed by these VM management systems (also referred to as controllers in API).
Admin tab
Use the Admin tab to perform administrative functions such as authentication, authorization, and accounting functions, scheduling policies, retaining and purging records, upgrading firmware, and controlling features such as syslog, Call Home, and SNMP.
Operations tab
The Operations tab provides the following built-in tools for planning and monitoring fabric resources.
Visibility & Troubleshooting: Shows the location of specified end points in the fabric and displays the traffic path, including any L4-L7 devices.
Capacity Dashboard: Displays the available capacity of configurable resources such as end points, bridge domains, tenants, and contexts. For more details, see Capacity Dashboard.
EP Tracker: Enables you to view virtual and bare metal endpoint connections and disconnections to leaf switches and FEXes.
Visualization: Provides visualization of traffic maps.
Apps tab
The Apps tab displays all the applications installed or uploaded to APIC. The tab allows an APIC administrator to upload, enable, upgrade, install, or uninstall a packaged application in APIC.
Integrations tab
Use the Integrations tab to view all third-party integrations.
Menu bar tools
At the far right side of the menu bar are the menu bar tools. These are displayed as icons and the detailed descriptions for each of them are discussed in this section.
Search
The Search icon displays the search field to locate objects in the interface by name or other distinctive attributes.
The search function allows the use of wildcards (*).
Launch multi-site manager
The Multi-Site Manager icon launches the multi-site manager. The multi-site manager can launch multiple site APICs.
Feedback
The Feedback icon enables you to send comments directly to Cisco.
Alerts
The Alert icon indicates the alerts on the system. To view the alerts, click the icon. When system alerts are available, a numeric badge appears on the alert icon indicating the number of active alerts. When critical system notifications are available, the alert icon will blink red.
To disable blinking of the alert icon, remove all critical alerts from the alert list. A disabled Close button on a critical alert indicates that you must first resolve the underlying issue before the alert can be cleared.
Tools
To access the system tools, click the Tools icon and select an item from the drop-down list.
Show API Inspector: Provides visibility into internal API messages between the GUI and APIC operating system to execute tasks. For more information, see Viewing an API interchange section in this chapter.
Start Remote Logging: Forwards logging information to a remote URL.
Object Store Browser: Opens the Managed Object Browser, or Visore, which is a utility built into APIC that provides a graphical view of the managed objects (MOs) using a browser.
Show Debug Info: Open a status bar at the bottom of the GUI to display information such as current managed object (MO) and system time. When the status bar is open, this selection changes to Hide Debug Info.
Config Sync Issues: Opens the Configuration Objects Pending Resolution panel. This panel shows if there are any transactions involving user-configurable objects that have yet to take effect in APIC. You can use information in the panel to help with debugging.
Note
Global system settings are configured in System > System Settings.
Help
To access the help tools, click the Help icon and select an item from the drop-down list.
The following selections are available:
Help: Displays links to API documentation and to the APIC
Allows personalization and account management for the logged-in user.
The following selections are available:
Bookmarks: Displays links to menus bookmarked by the user.
Menus that display the Favorites icon () can be bookmarked by clicking the icon.
Change My Password: Change the password of the currently logged in local user.
Change My SSH Keys: Change the user's public SSH key used for certificate-based login.
Change My X509 Certificate: Change the user's X.509-format certificate for login.
View My Permissions: Display the user's role-based read and write privileges for domains and accessible objects.
Settings:Change general GUI settings.
Remember Tree Selection: Enables the GUI to keep the navigation tree expanded when returning to a window. For example, if you enable this property and expand the navigation tree in the Tenants tab, click on the Fabric tab, then return to the Tenants tab, the tree will remain expanded.
Preserve Tree Divider Position: Enables the GUI to keep the position of the tree divider after dragging the tree divider to the desired location.
Disable Notification on Success: Suppresses the success dialog box notification.
Disable Deployment Warning at Login: Disables the Deployment Warning dialog box when logging in. See the Deployment warning and policy usage information section later in this chapter.
Default Page Size for Tables: Sets the GUI table size.
Show All UI Sections: Displays hidden UI configuration options.
Show What's New at Login: Displays splash screen at login, showing recent features.
Change Deployment Settings: Enable and set the scope of the deployment notification. See the Deployment warning and policy usage information section later in this chapter.
Logout: Exit the APIC configuration GUI.
Capacity dashboard
The capacity dashboard displays the available capacity of configurable resources such as endpoints, bridge domains, tenants, and contexts.
The dashboard contains the following tabs:
Fabric Capacity: Displays the capacity of the managed objects within the fabric. Each tile provides the current and maximum capacity of each object, as well as the percentage of the maximum capacity that is used. You can hover your cursor over some of the tiles to see more information.
Leaf Capacity: Displays the capacity of the managed objects for each leaf switch that the APIC manages. Beginning with APIC release 6.1(4), the name of the tab has been changed to Leaf Switch Capacity.
For all of the objects, the GUI displays the current resource usage and maximum resource capacity, as well as the percentage of the maximum resource capacity that is used.
The data for some of the objects is split into subcategories, such as local and remote for ESG MAC addresses.
The data for MAC, IPv4, and IPv6 addresses shows the total number of local and remote addresses.
(not applicable for APIC release 6.1(4) and after) The data for /32 routes and /128 routes provides the following information:
UC: The total IPv4 /32 or /128 unicast routes. This value persists through each interval without resetting to zero.
EP: The total IPv4 /32 or /128 endpoints. This value persists through each interval without resetting to zero.
MCast: The total IPv4 /32 or /128 multicast routes. This value persists through each interval without resetting to zero.
You can click the Configure Profile button in the Switch column to configure the forward scale profile for that switch. Beginning with APIC release 6.1(4), this button has been renamed to Change Forward Scale Profile.
You can change the forward scale profile by clicking the three dots at the end of the row for each entry.
(not applicable for APIC release 6.1(4) and after) You can click any other part of a row to see detailed capacity usage information for that switch. For resources with the Absolute entry, this is the current resource usage. In the case of /32 and /128 routes, Absolute is the total of unicast routes, endpoints, and multicast routes being used. Percentage is the percentage of the maximum resource capacity that being used.
Beginning with APIC release 6.1(4), there is a considerable performance improvement to the Capacity Dashboard tab with faster display time of the various elements displayed here. The other significant enhancements include:
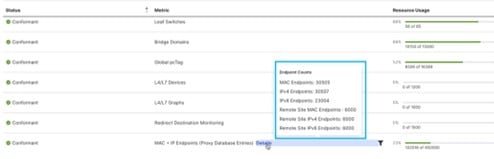
Moving away from the tile layout. Prior to release 6.1(4), all the entries were available as tiles, now a table has been introduced for the Fabric Capacity and Leaf Switch Capacity sub-tabs. The metrics which were earlier displayed as tiles are available in the table. Some of the earlier tile entries, for the Fabric Capacity sub-tab, such as endpoint details, are now available only when you click Details in the MAC + IP Endpoints row.
Status indication for each of the resources is dependent on the Resource Usage. Hover over the Resource Usage column to check the status of the usage of resources. The available status indicators are:
Conformant (0 to 75% of resource usage)
Approaching limits (76 to 90% of resource usage)
Approaching high limits (91 to 100% of resource usage)
Violated limits (above 100% of resource usage)
In the Leaf Switch Capacity tab, click the Resource Usage number to get more details about the switch parameters. You can also use the filtering option to filter using Metric, Status or Resource Usage.
New entries added to the Fabric Capacity and Leaf Switch Capacity tabs are:
 : the Search icon.
  : the Multi-site manager icon to launch the multi-site manager.
 : the Feedback icon to send comments to Cisco.
 : the Alerts icon to view the list of active alerts.
 : the Tools icon to access the system tools.
  : the Help icon.
 : the Manage my profile icon. The logged-in use can configure settings and preferences.