Topology map for network visualisation

Topology maps

A topology map is a network visualization tool that

  • displays network devices and their connections using logical or geographical layouts,

  • allows you to filter, group, and interact with devices and links for better analysis, and

  • integrates device inventory data to provide real-time status, alarm, and performance insights.

For information on managing your devices and inventory, viewing interface details, and performing actions such as inventory synchronization, refer to the Cisco Crosswork Network Controller 7.2 Device Lifecycle Management Guide.

Prerequisites

  • Devices must be onboarded to the system before using the topology map. See Device onboarding methods.

    All devices in the network must have single-topology settings configured before you onboard the topology. Configuring single-topology on only some devices is not supported and will cause links to appear as degraded or missing. Changing devices from non-single-topology to single-topology or the other way round after onboarding is also not supported. In single-topology mode, note that only the IPv4 metric is used, even if you configure IPv6 metrics.

Topology map views

Topology maps support two main views:

  • Logical map: Arranges devices and links based on user-modifiable algorithms, irrespective of their physical location.

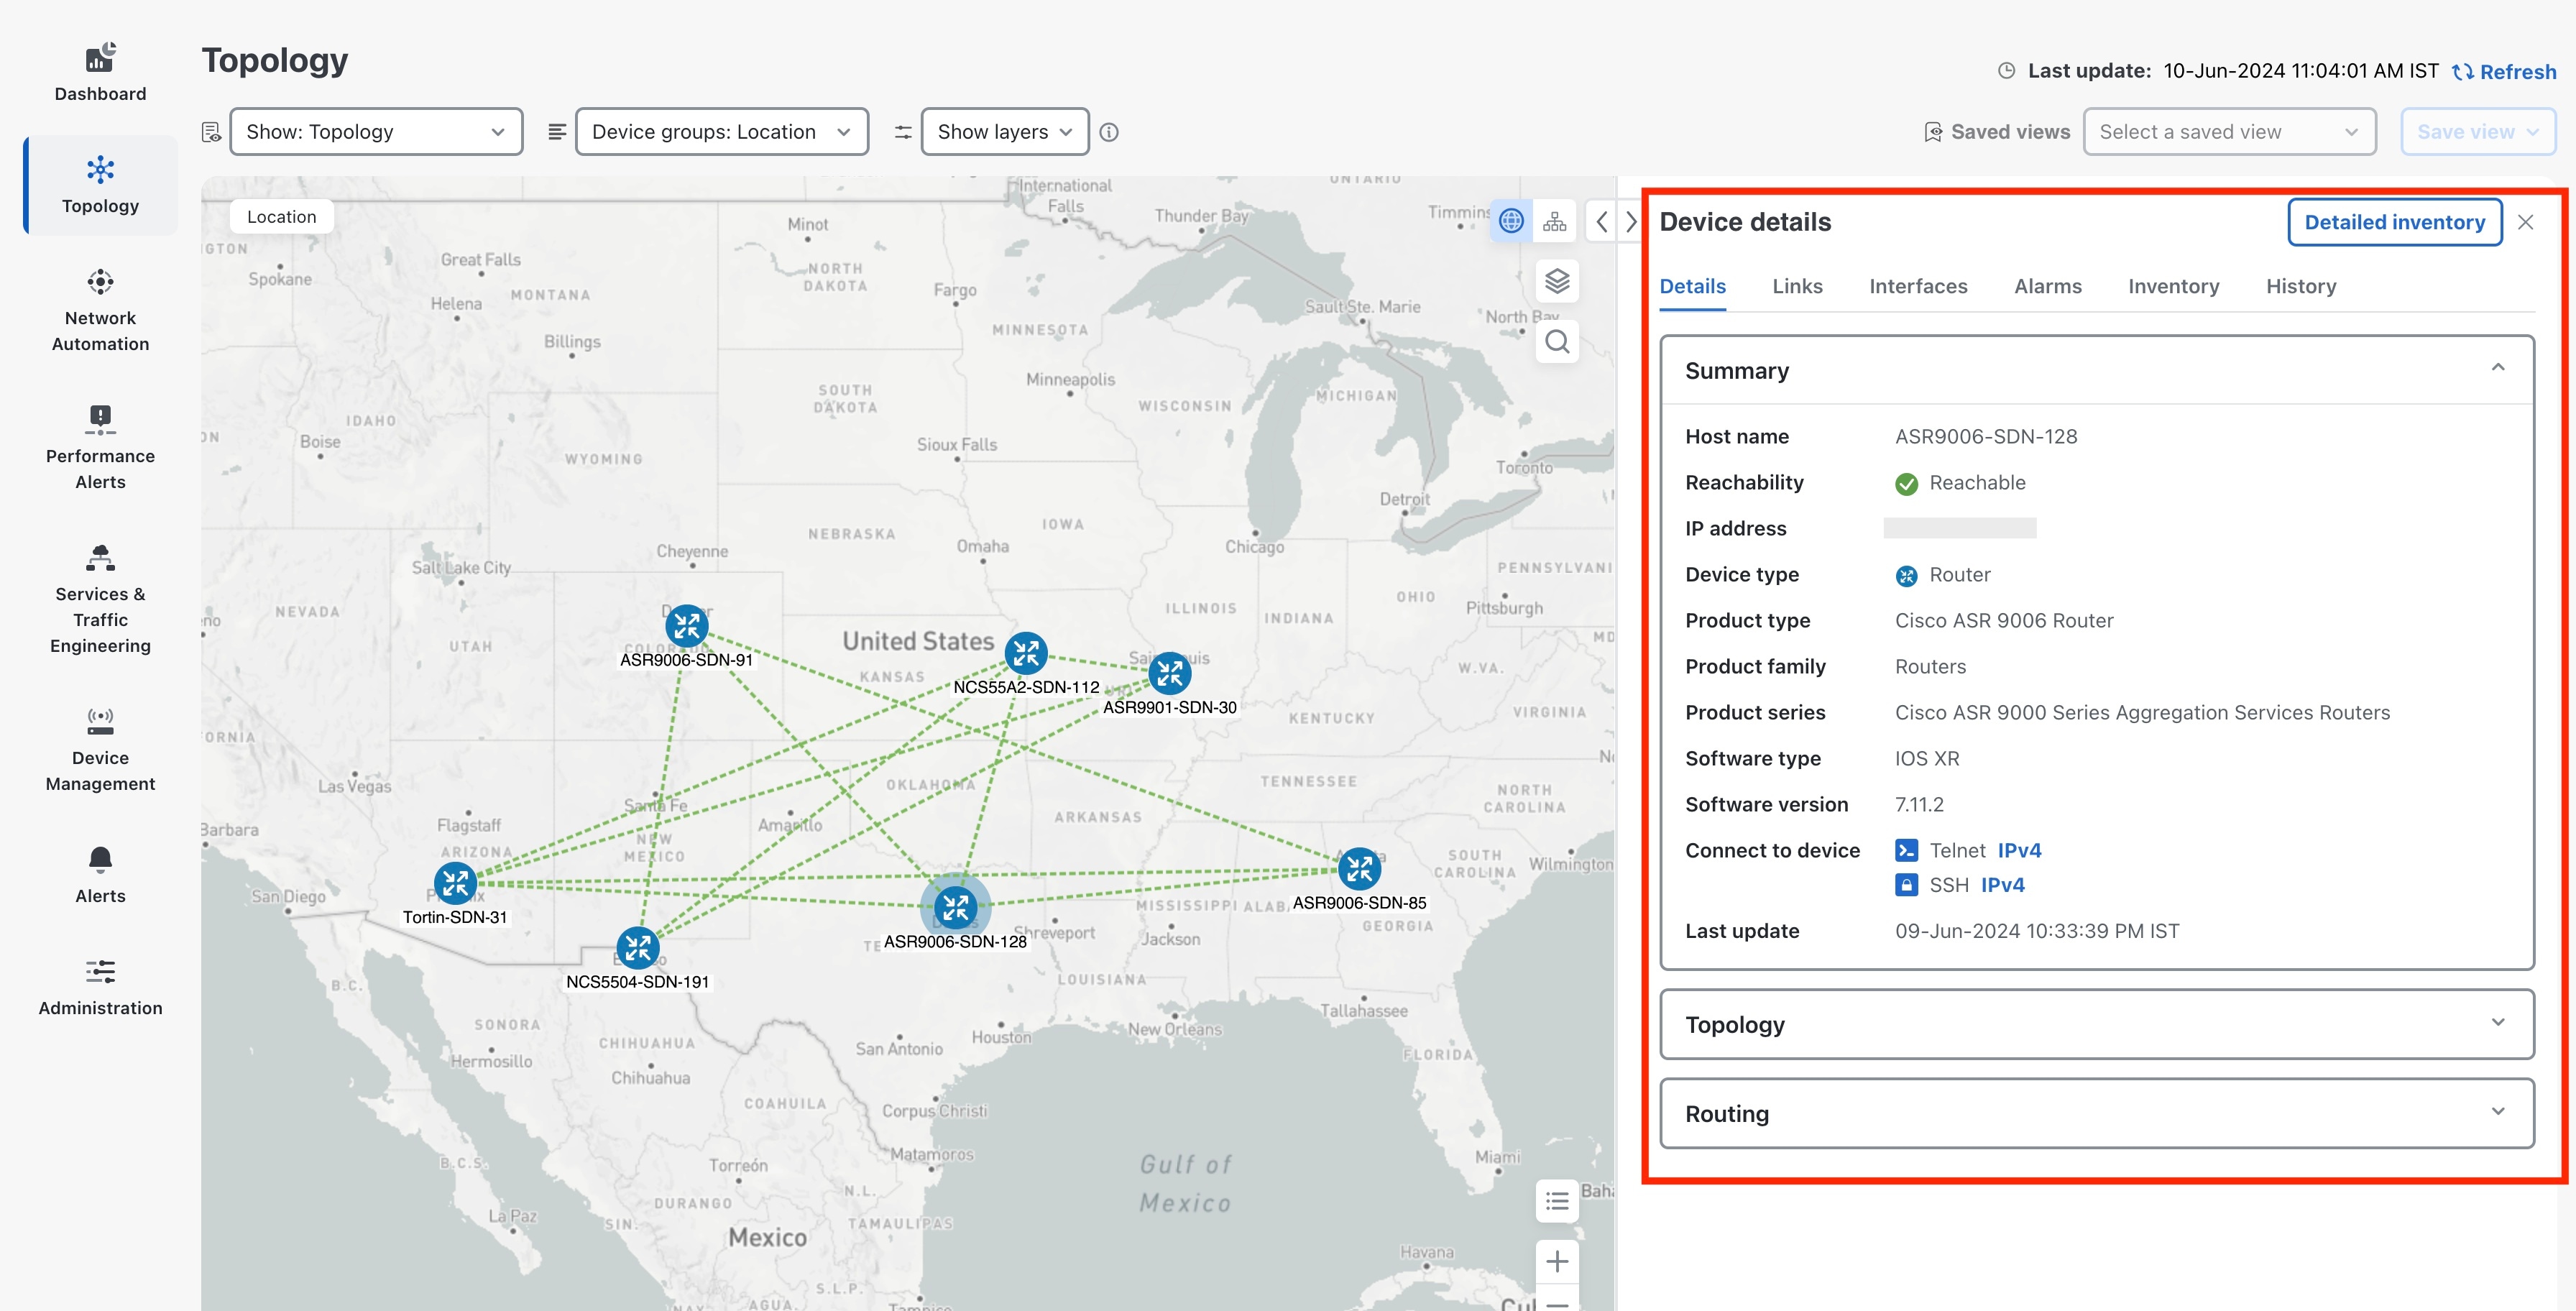
  • Geographical map: Plots devices, clusters, links, and tunnels on a world map using GPS coordinates from the device inventory.

Filtering topology

  • Filter your view by creating device groups.

  • Display devices and links by selected network layers.

  • Save custom views to retain filter and display settings across sessions.

Link representation and details

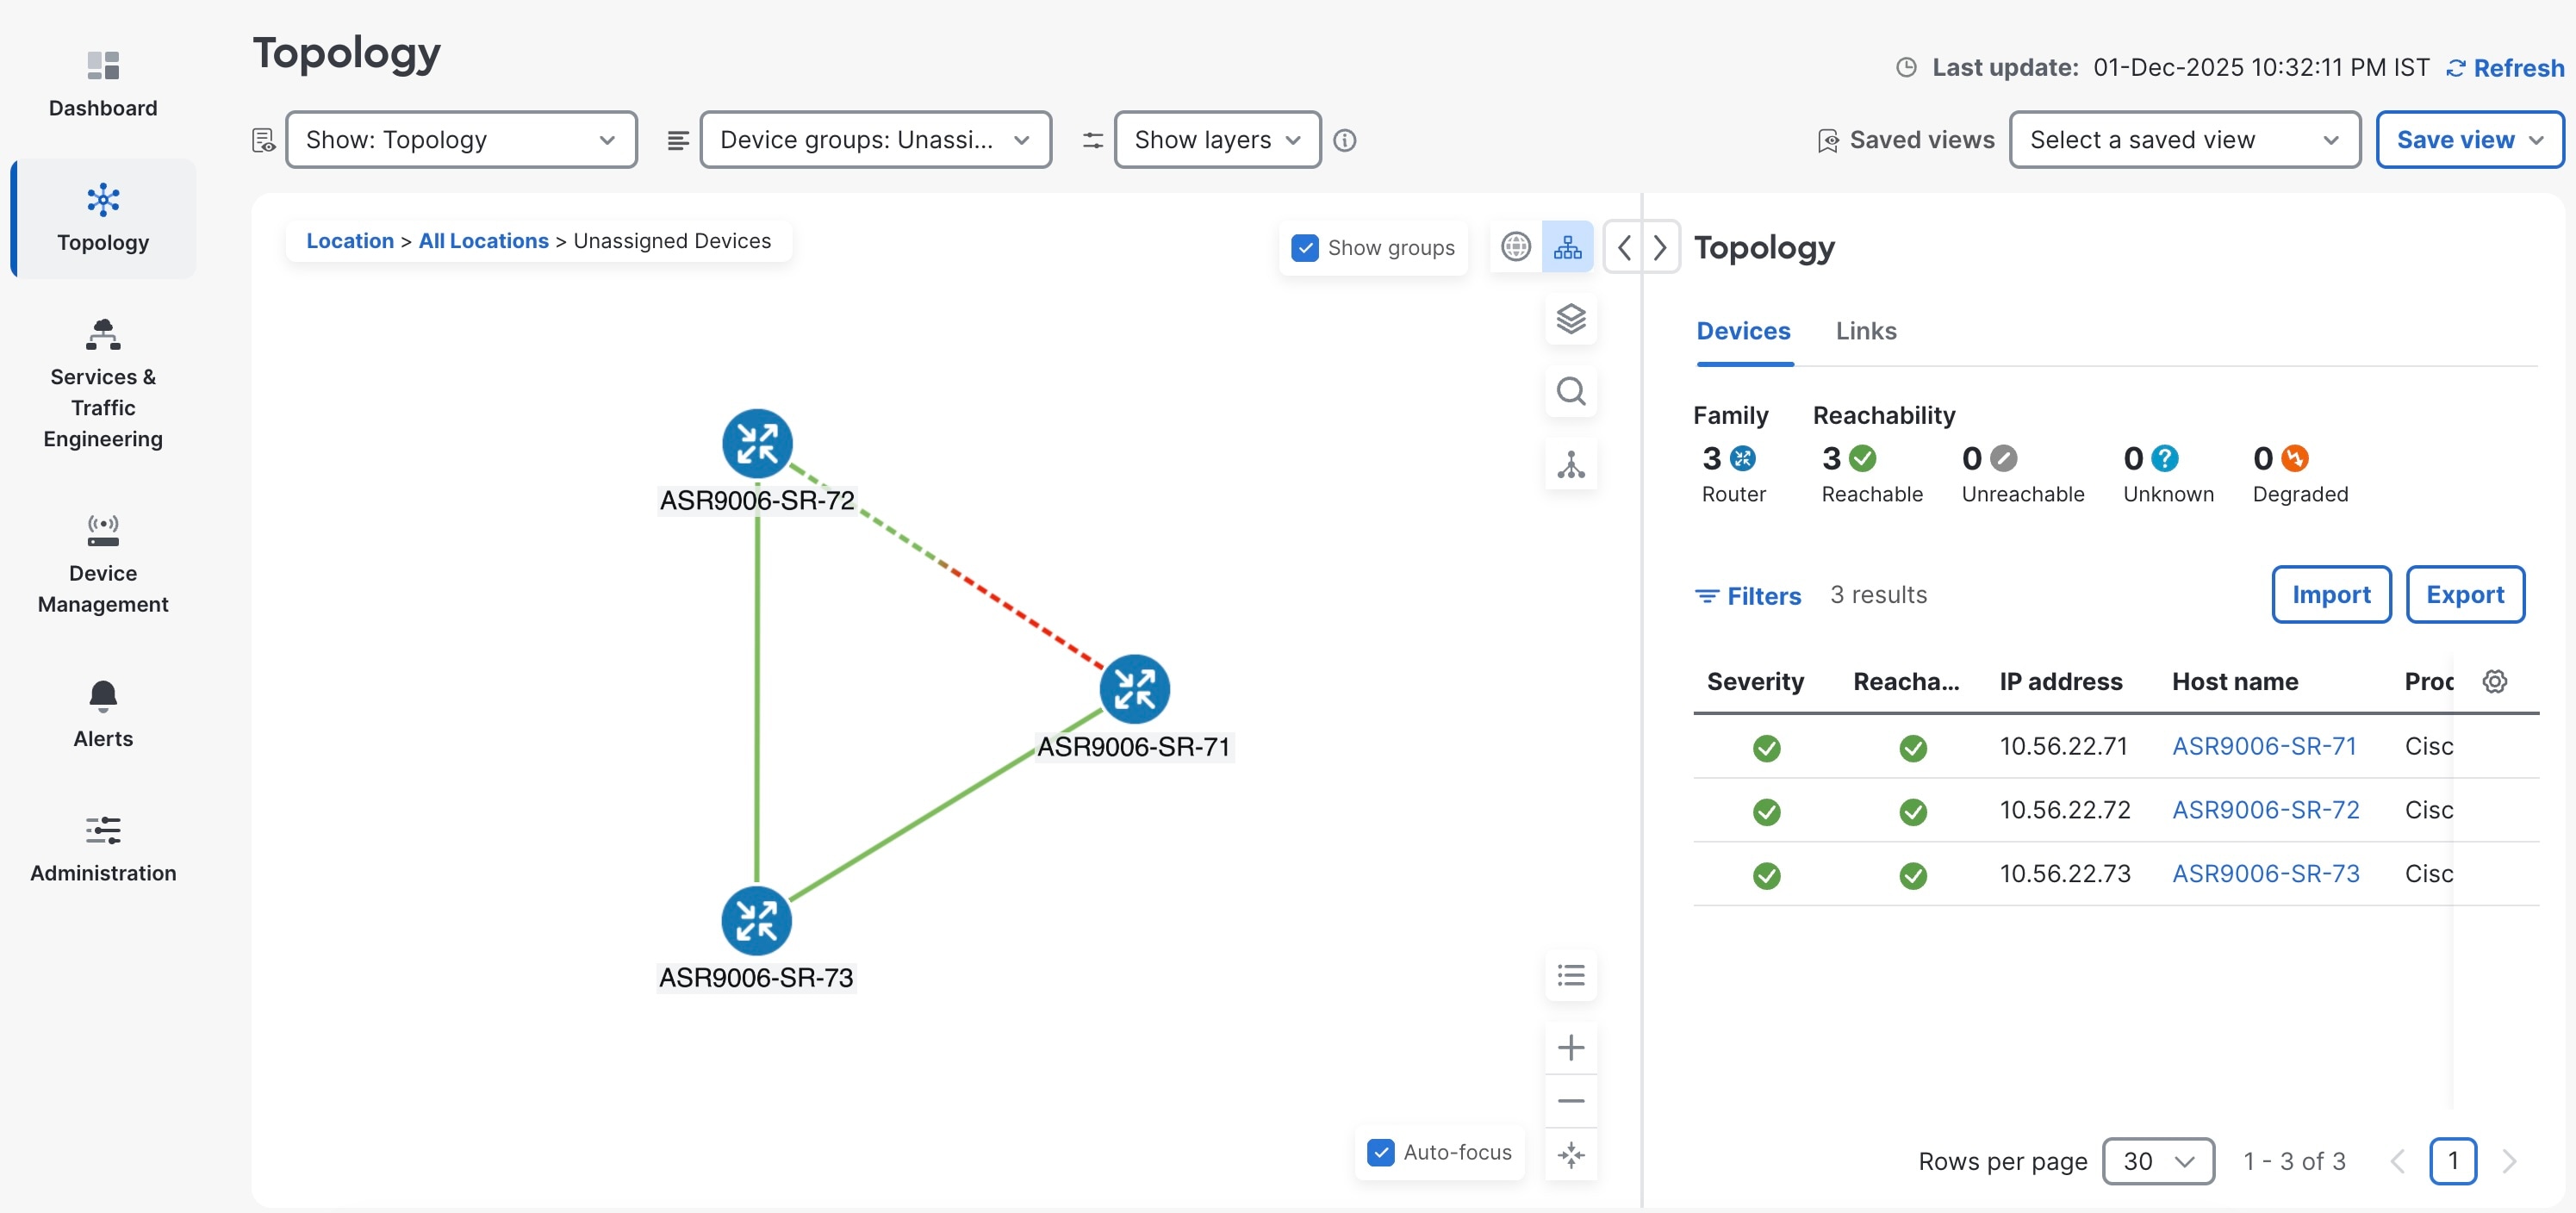
  • Solid line: Represents a single physical or logical link between two devices.

  • Dashed line: Represents an aggregated link, which may include multiple Layer 2 links (for example, several Ethernet links) or multiple Layer 3 links (such as multiple ISIS connections) over the same physical link.

  • Color links to quickly identify status, such as link down, or utilization level.
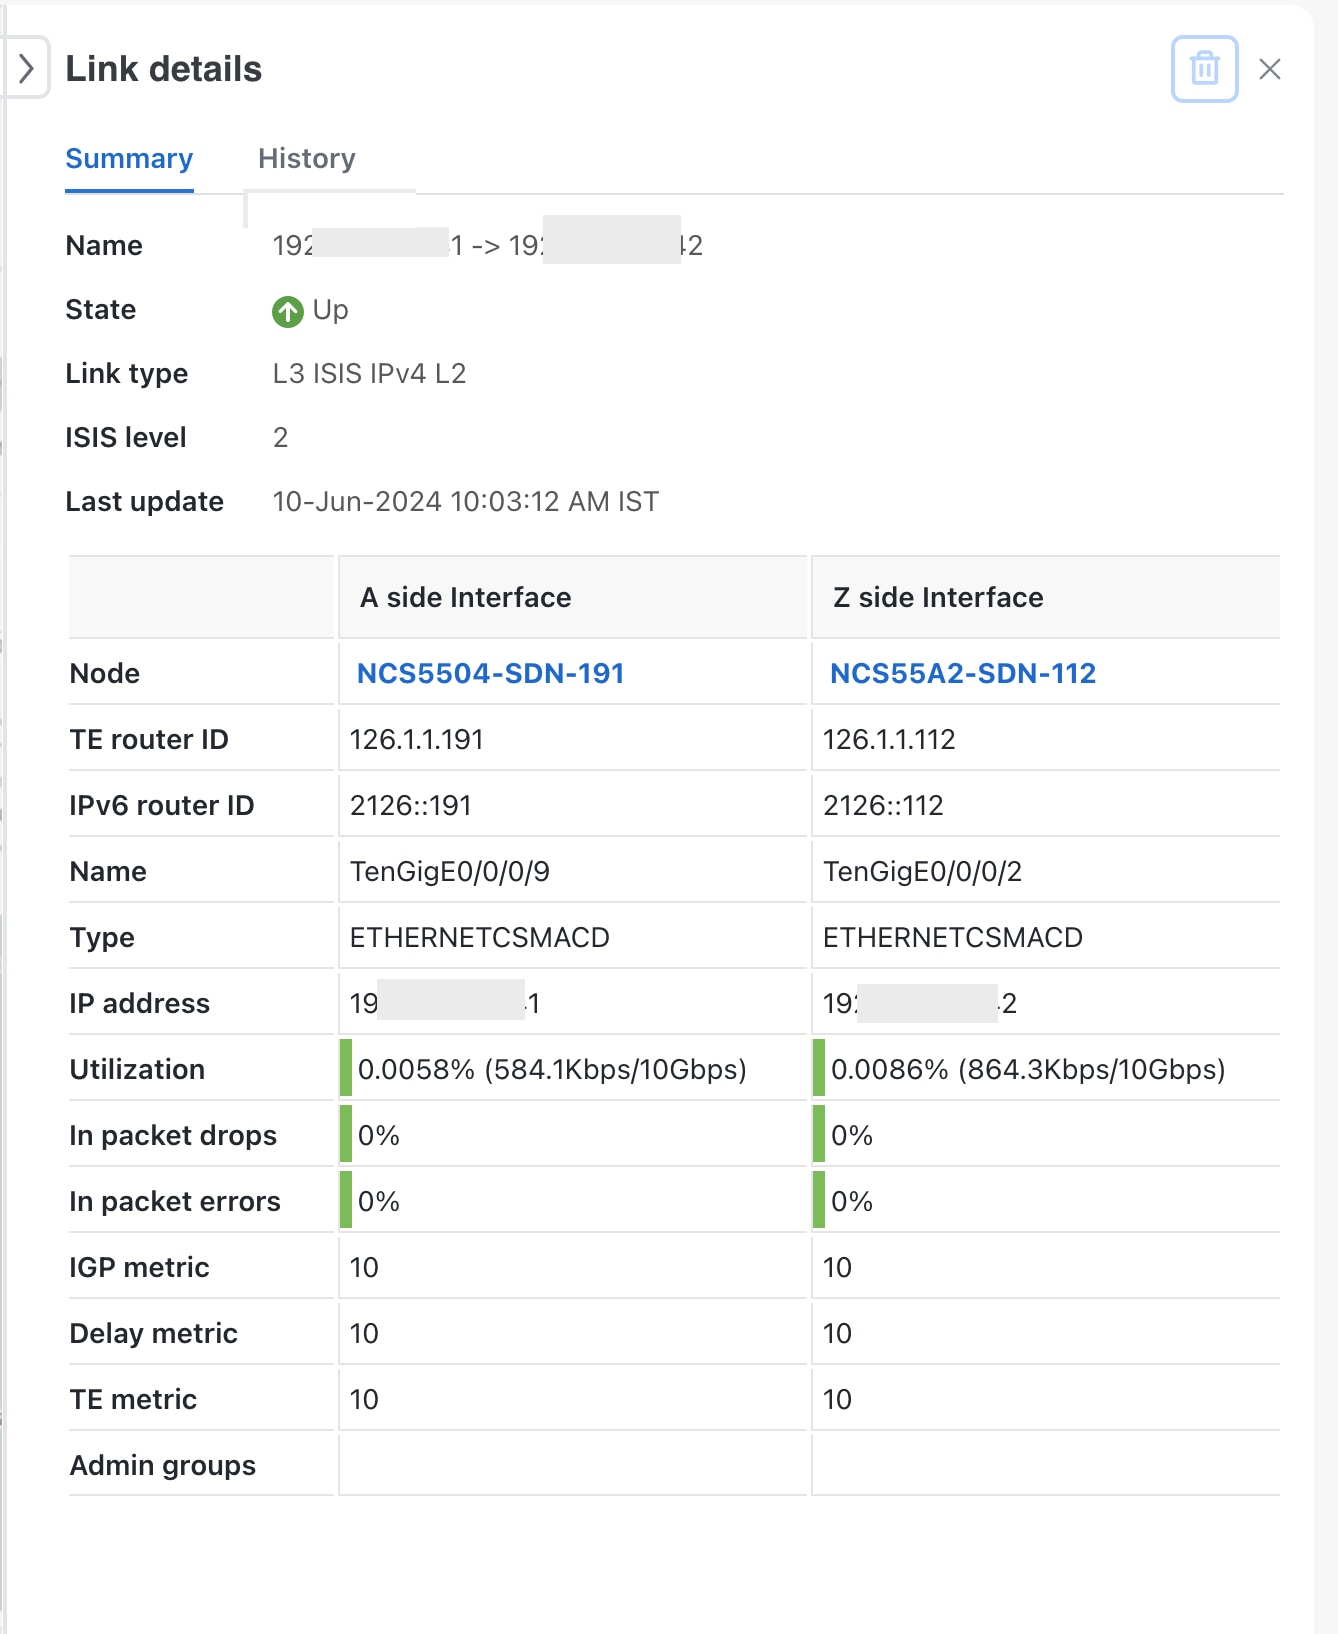
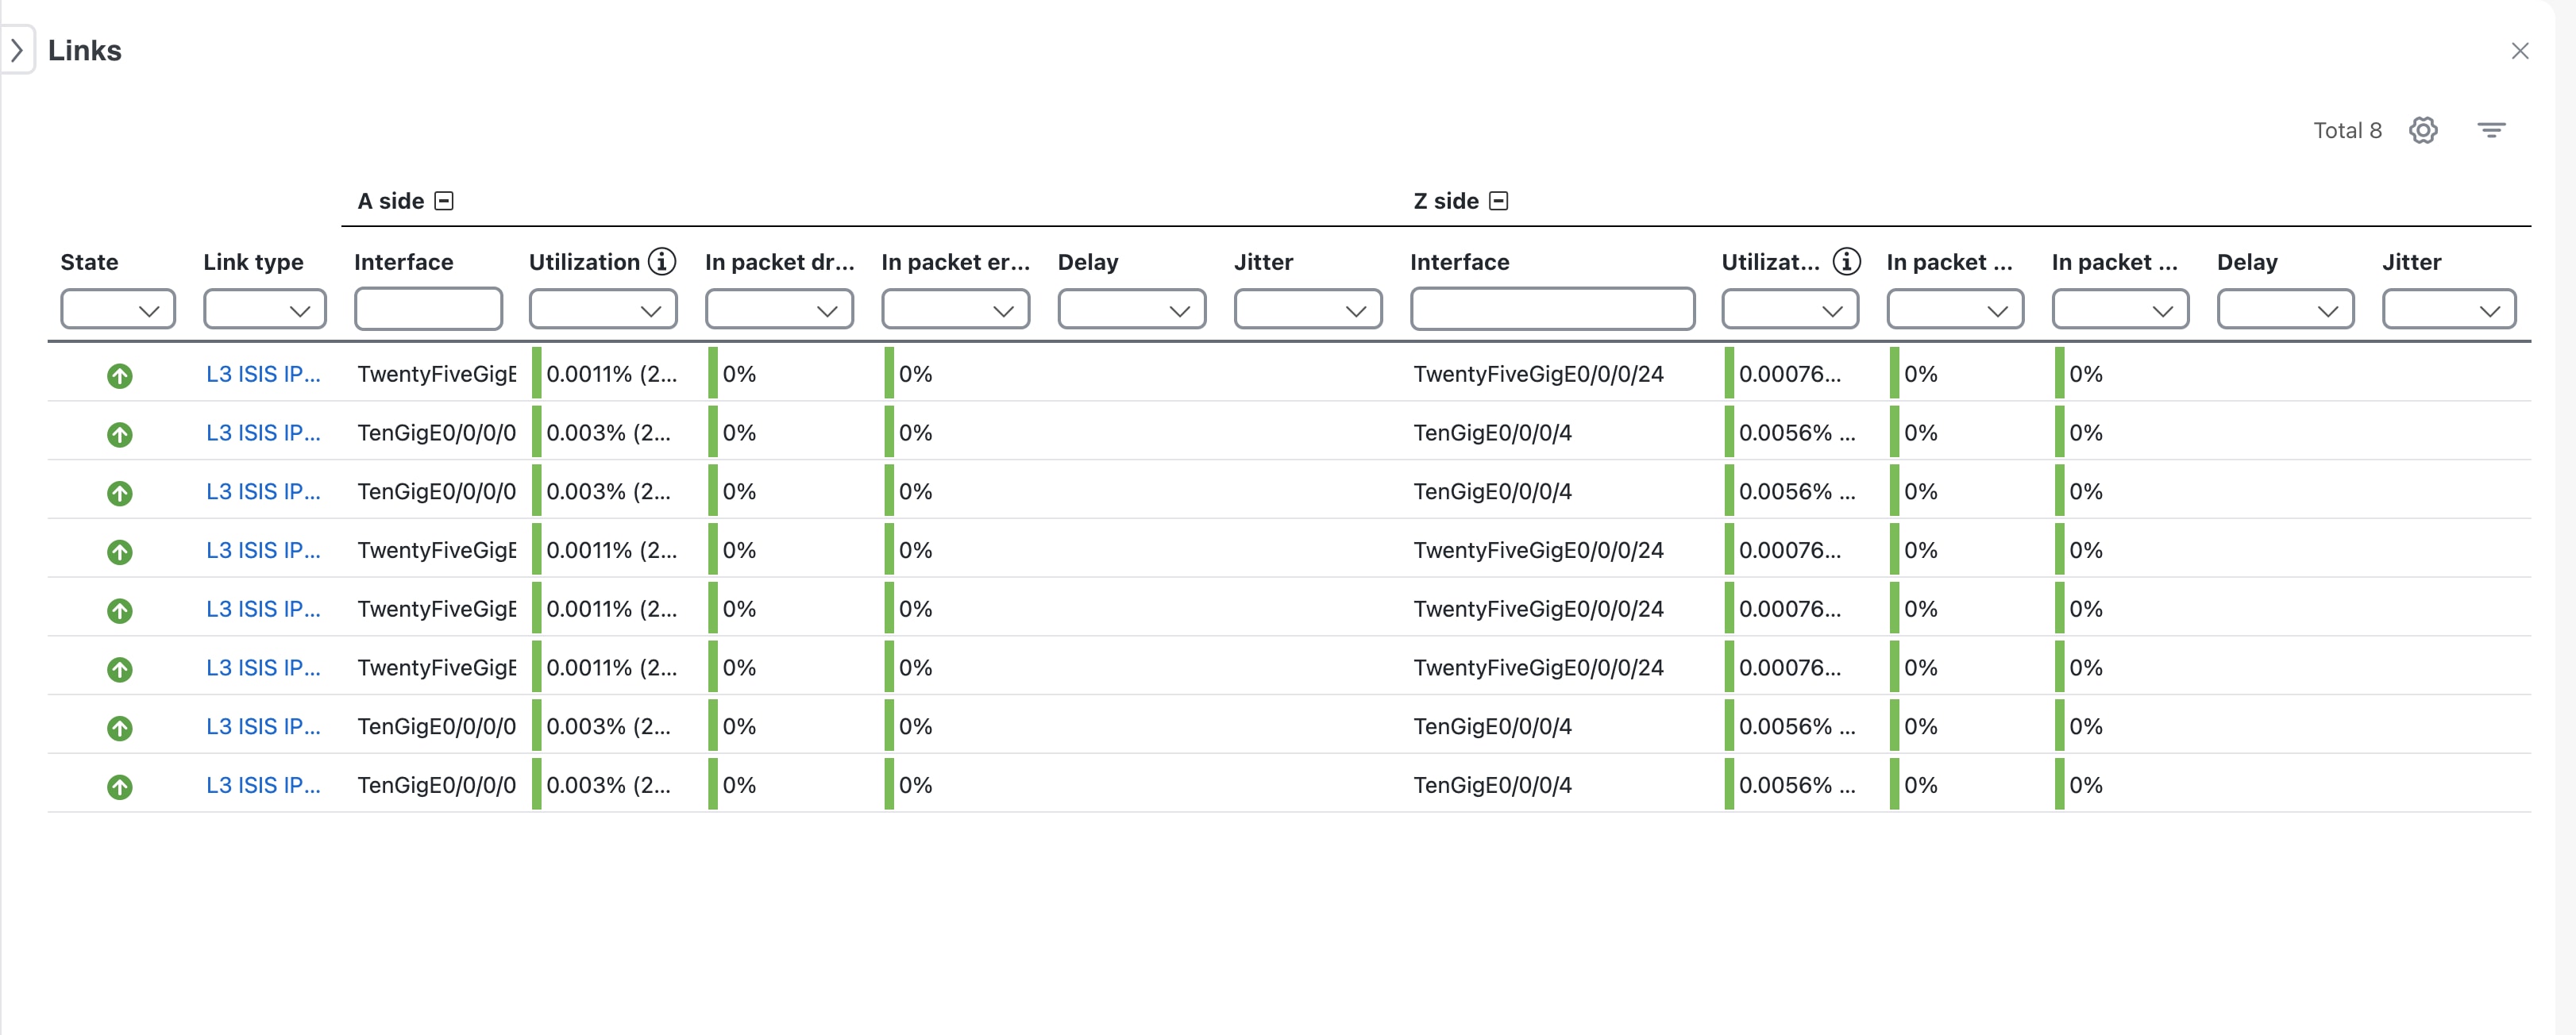
  • ā€œAā€ and ā€œZā€ labels indicate the interfaces connecting links between devices.

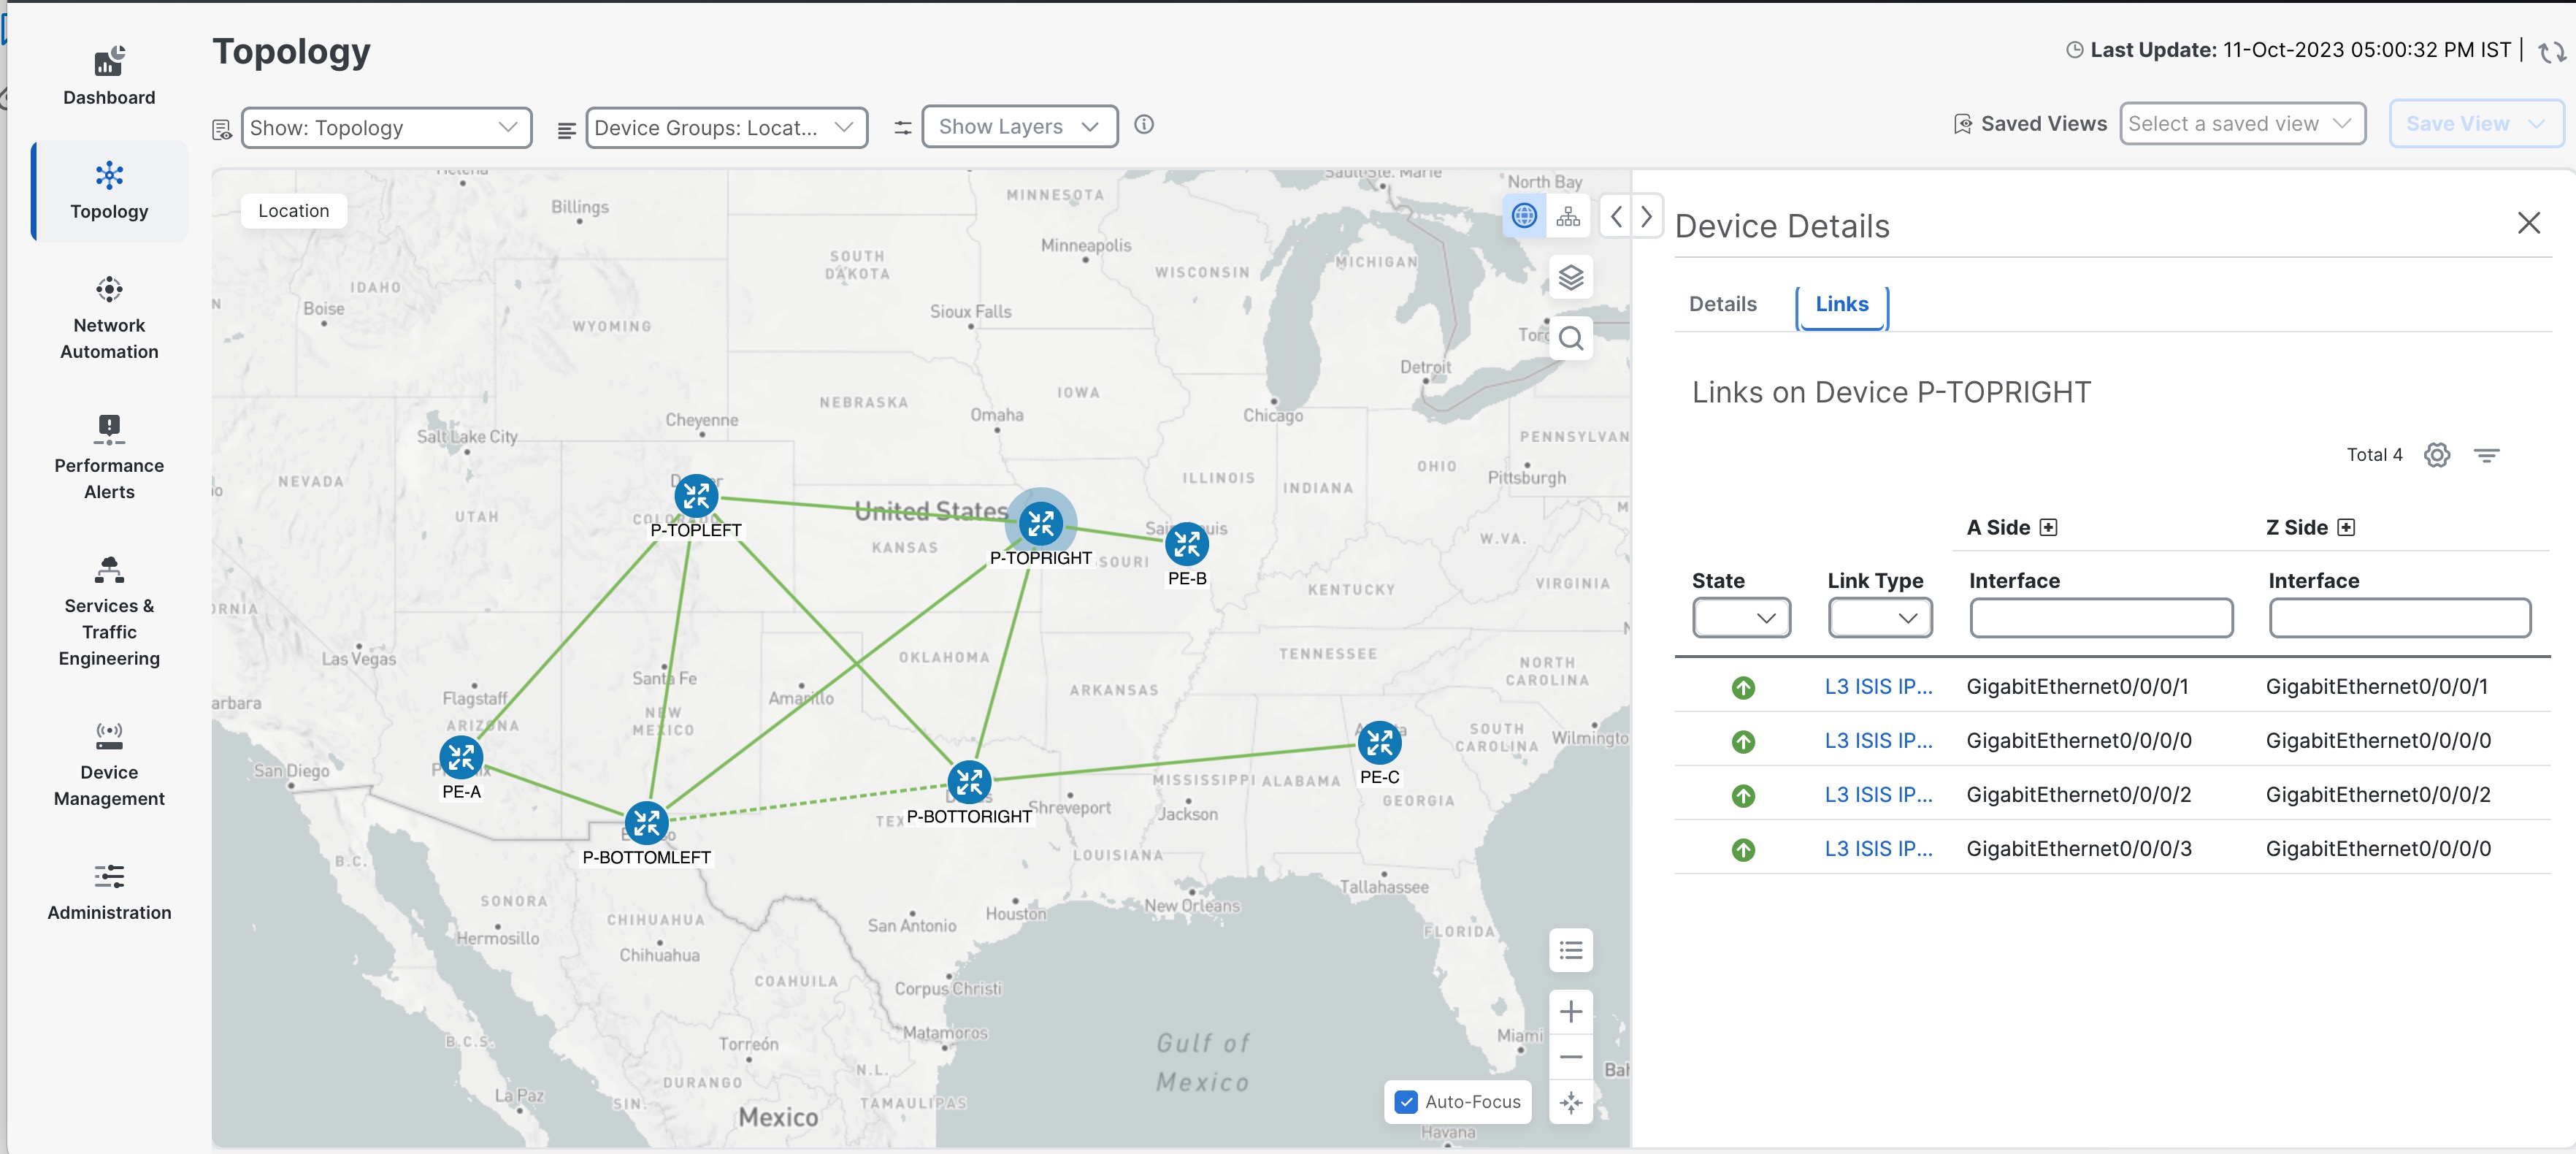
  • To view details for a link, click the link to open the Links panel, which shows information on the right side of the interface.

Topology map UI elements

The table describes key UI elements and actions on the topology map:

Feature/Action Description
Topology map view Choose views such as Topology, Traffic Engineering, VPN Services, or Transport Slicing from the Show drop-down.
Device groups Filter displayed devices by group.
Show layers Display devices and links belonging to selected network layers.
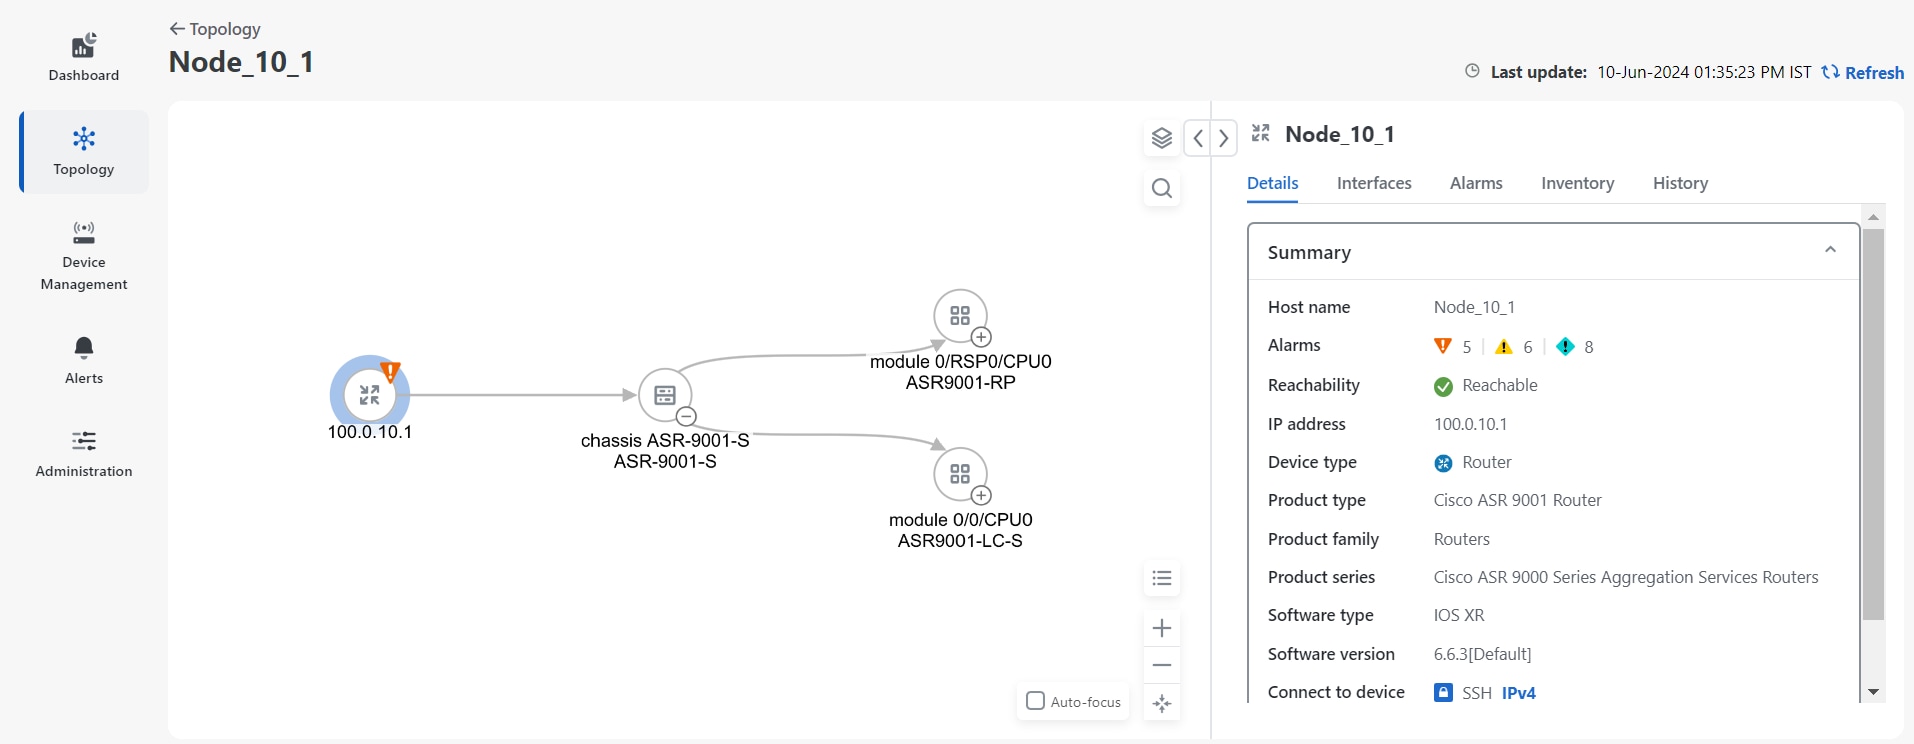
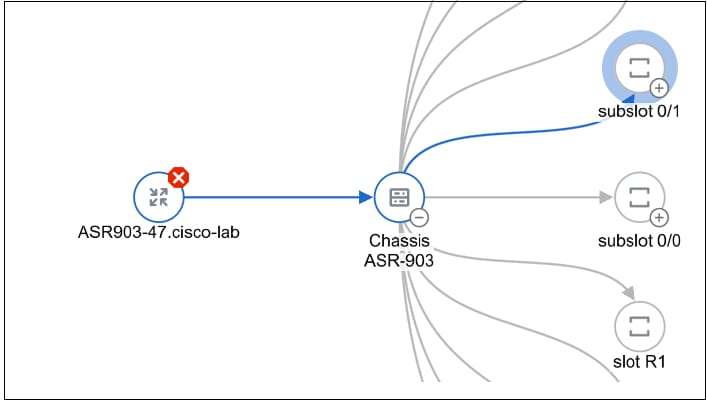
Topology map View devices and links with options to drill down for detailed device or link information.
Map type selector Switch between logical and geographical maps.
Side panel controls Expand, collapse, or hide the side panel for more map viewing area.
Mini dashboard Monitor IP Domain, device reachability and alarm severity.
Contextual panel See information relevant to the selected device, link, or policy depending on installed applications.
Saved views Create and recall named custom views of the map along with table settings and filters.

Upload internal map files for offline use

Enable detailed geographical map display within the Crosswork Network Controller when there is no internet connection to Mapbox or other external map providers.


Note


If you choose to work offline with internal maps and you do not upload map files, your geographical map will display as a generic world map without details of cities, streets, and so on.

By default, the system retrieves map tiles from an external provider. If your environment lacks Internet connectivity, you can upload Cisco-provided internal map files to ensure geographical features are displayed accurately. Upload only those map files that are relevant to your network's regions. If no map files are uploaded, only a generic, less-detailed world map will be shown.

Before you begin

  • Ensure you can access Cisco.com to download the required signed map files.

  • Verify you have credentials and permissions to upload files in Crosswork Network Controller.

Procedure


Step 1

Download the map file from Cisco.com.

  1. Go to Cisco Software Download Center and download the signed map file for your region to your local computer.

    Example file name: signed-us-geomaps-1.0.0-for-Crosswork-7.0.0.tar.gz

  2. Open a terminal or file explorer and extract the .tar.gz file.

    Example:
    cd <folder where tar was downloaded>
    tar -xvf signed-us-geomaps-1.0.0-for-Crosswork-7.0.0.tar.gz
    
    README
    us-geomaps-1.0.0-for-Crosswork-7.0.0-signed.tar.gz
    us-geomaps-1.0.0-for-Crosswork-7.0.0-signed.tar.gz.signature
    cisco_x509_verify_release.py
    cisco_x509_verify_release.py3
    CW-CCO_RELEASE.cer

Step 2

Upload the extracted map file into Crosswork Network Controller.

  1. In Crosswork Network Controller, go to Administration > Settings > System settings.

  2. Under Topology, select Map.

  3. Select the Work offline with internal maps and then click Manage.

  4. In the Manage internal maps dialog, click the upload icon to add a new map file, one at a time.

  5. Browse to the location of the extracted .signed.tar.gz file, select it, and click Upload.

    Example: us-geomaps-1.0.0-for-Crosswork-7.0.0-signed.tar.gz


The selected regional map is available for offline geographical display. When working offline, the Controller now shows detailed maps based on the uploaded files, improving network visualization.

What to do next

  • If you manage networks across multiple regions, repeat the process for each relevant map file.

  • Confirm correct map display on the geographical interface.

Device groups

A device group is a device category that

  • organizes devices into logical collections based on user-defined criteria,

  • enables filtering and visualization of data from specific sets of devices, and

  • simplifies monitoring by reducing screen clutter and focusing attention on relevant device data.

Create device groups

Organize devices into groups to simplify management, policy assignment, and bulk operations within your network platform.

Device groups let you manage related devices together. You can create groups manually or set up automatic grouping rules (see Create rule for dynamic device grouping). Note that each device can belong to only one device group.

Procedure


Step 1

From the main menu choose Device Management > Device Groups.

Only the devices belonging to that device group are listed in the devices table in the right pane.

Step 2

To create a new group, select the parent group and choose Add group.

Step 3

Enter the required details for the group and select Create.

The new group appears under the selected parent device group.

Create dynamic device group rules

Automatically organize unassigned devices into dynamic groups using rules based on device host names or IP addresses.

You can create a rule to dynamically create device groups and automatically add unassigned devices to these groups using a Regular Expression (regex) on the device host name or IP address.

Before you begin

Dynamic rules do not apply to devices that already belong to groups. Move devices already in other groups to "Unassigned Devices" if you want the rule to apply to them.

Procedure


Step 1

From the main menu choose Device Management > Device Groups.

Step 2

Click next to All Locations > Manage Location Dynamic Groups.

Step 3

Click Show more details and examples to help you fill out the required host name or IP address.

Step 4

If there are any existing devices in the Unassigned Devices group, test your rule to preview potential group assignments.

Step 5

Enable the rule to start automatically assigning matching unassigned devices to dynamic groups.

The system checks for unassigned devices every minute and applies your rule.

Step 6

Save your changes.

Step 7

Review the newly created groups under Unassigned Groups and move groups into your preferred hierarchy as needed.


Unassigned devices matching your rule criteria are automatically placed into the correct dynamic groups.

Modify device group details

Change the name, parent group, or description of an existing device group to keep your network structure up to date.

Modify device groups when reorganizing devices or updating administrative records.

Procedure


Step 1

From the main menu choose Device Management > Device Groups.

Step 2

Select the device group you want to update.

Step 3

Edit the group details, and description as needed.

Step 4

Save your changes.


Delete a device group

Remove an existing device group and make its devices available for assignment to other groups.

Use this task when you need to delete a device group that is no longer required. Deleting a group will unassign all devices from that group, and make them available for reassignment.

Before you begin

Procedure


Step 1

From the main menu choose Device Management > Device Groups.

Step 2

Select the device group you want to delete.

Step 3

Open the actions menu for the group and choose Delete group.

Step 4

In the confirmation dialog, click Delete to confirm and complete the deletion.


The device group is deleted, and its devices are unassigned and available for reassignment to other groups.

Move devices from one group to another

Transfer devices to a different group to reorganize network assets and adjust policies or administrative boundaries as needed.

Use this task to efficiently regroup devices. This is useful during organizational changes, policy updates, or network scaling.

Before you begin

Identify the devices and the target group for the transfer.

Procedure


Step 1

From the main menu choose Device Management > Device Groups .

Step 2

Select the source group from which you wish to move the devices.

Step 3

Select the devices to transfer.

Step 4

Click Move, then choose the target group from the drop-down and confirm.

If devices do not appear on device maps after moving, update your display settings:

  • Go to Administration > Settings, then click the User settings tab.

  • Options include:

    • Automatically switch to the device group that will show all participating devices - Ensures all relevant devices for a service or policy are shown.

    • Don't switch the device group automatically - Keeps your current device group selection, even if all devices are not shown.

    • Ask me each time - Prompts you when a device could be missing from the map.


The devices are now part of the new group and visible in the target group's listing.

Import multiple device groups

Import multiple device groups at once and update existing ones in bulk by uploading a CSV file.

When you import device groups from a CSV file, new device groups are created for entries not already in the database. Existing groups are updated if the imported data matches them.

Importing device groups may overwrite current data, so exporting a backup of current device groups before importing is recommended.

Before you begin

  • Prepare a CSV file containing your device group data, using the provided template format.

  • Back up your current device groups to prevent accidental data loss.

Procedure


Step 1

From the main menu, choose Device Management > Device Groups .

Step 2

Click Import groups to open the dialog box.

Step 3

If you have not prepared a device groups CSV file:

  1. Download the device groups CSV template to a local storage resource.

  2. Open the template in your preferred editor and add one row for each device group.

    Use a semicolon to separate multiple entries in the same field. Use two semicolons with no space between them to indicate that you are leaving the field blank.

  3. Remove all sample data rows, leaving only the column header row.

  4. When you are finished, save the new CSV file.

Step 4

Click Browse and select your completed CSV file.

Step 5

With the CSV file selected, click Import .

Note

 
Wait for the import to complete before clicking Import again to avoid duplicate device group entries.

The selected device groups are imported and updated as needed.

Export multiple device groups

Export the details of your device groups to a CSV file for record-keeping or bulk updates.

Use this task to create an export of all device groups in the system. You can modify the CSV file and import it again to update device group data.

Procedure


Step 1

From the main menu, choose Device Management > Device Groups.

Step 2

Click the export icon to download the device group details in CSV format.


The CSV file containing all device groups is downloaded in your systems download folder.

Device details available from the topology map

The topology map displays comprehensive information about network devices, including:
  • Device specifications,

  • Routing configurations, and

  • Device links

    You can use the topology map to monitor and manage your network devices efficiently.

For information on managing your devices and inventory, viewing interface details, and performing actions such as inventory synchronization, refer to the Cisco Crosswork Network Controller 7.2 Device Lifecycle Management guide.

View basic device details

View essential information about a networking device and its connectivity in a graphical topology map.

Use this task when you need to identify device details such as host name, status, IP address, and type within the topology view. The topology map allows you to visually explore device connections and adjust your view as needed. If you are viewing the HTML version of this guide, click on the images to view them in full-size.


Note


Starting from Crosswork Network Controller version 7.2, interface names are not discovered if any communication protocol on a device is in a degraded state, even if SNMP and SSH protocols are working. If one protocol such as Telnet fails, the device is marked as degraded, preventing interface discovery and causing the link icon to remain blue. Removing the failing protocol allows interface names to be discovered and the link icon to turn green. Interface names are then populated and links show green if SNMP and SSH are functional, despite other protocol failures.


Procedure


Step 1

From the main menu, choose Topology .

Step 2

In the topology map, locate the device you want to inspect.

Step 3

Hover over the device icon, to quickly view the host name, reachability state, IP address and type of device.

Figure 1. Basic device details

Step 4

(Optional) Adjust the map view by zooming, panning, or rotating as needed for clarity.


You see basic device information, helping you quickly understand device status and network placement.

View all device details

Display comprehensive device information from the topology map, including its location, the type of device, and the date it was last updated.

Perform this task when you need to assess or troubleshoot a device directly from the topology view.

Before you begin

(Optional) Element Management Functions must be installed to view extended device details.

Follow these steps to view device details:

Procedure


Step 1

From the main menu choose Topology .

Step 2

Click the device icon that represents the device you want to inspect. The device detail window displays these tabs.

Figure 2. Device details

If you have installed Element Management Functions, the additional information is displayed in the Device details screen.

  • An Interfaces tab with name, and operational and admin status for each associated interface.

  • A Links tab with the details of the links on the selected device.

  • An Alarms tab displaying information such as severity, source, category, and condition of the alarms. The columns can be customized based on your preferences.

  • An Inventory tab displaying the product name, product ID, admin status, operational status, and serial number. The columns can be customized based on your preferences.

  • A History tab with detailed information about device performance, including various performance metrics for CPU utilization, device memory utilization, device availability and environmental temperature. For each trend, you can choose the required time frame and dates using the Zoom and Date options on the graph. You also have the option to download the details in a PNG or CSV file.


The Device details panel provides all available information about the selected device. Additional details are shown if Element Management Functions are installed.

View the detailed device inventory

Provide an up-to-date and comprehensive view of each device’s hardware components and attributes.

Use this task to quickly examine modules, chassis, cards, and interfaces for any device in your network, supporting maintenance, troubleshooting, and audits.

Before you begin

Procedure


Step 1

From the main menu, choose Topology .

Step 2

Click the device icon to view the Device details pane for the device.

Step 3

Click the Detailed inventory button on the Device details pane to open the detailed inventory window for the chosen device. You can see the Topology tree view on the left.

Under the Details tab, you can view detailed device information, including the device summary and interface properties.

Figure 3. Extended view of the Details tab

Step 4

Zoom in to view the different modules and click one for which you need detailed information.

You can view detailed information in the Details, Interface, Alarms, Inventory and History tabs for the chosen module.

Note


In the Detailed inventory view:

  • Slot, bay, and container are not shown.

  • The Optics Controller and pluggable components are combined and displayed as a single merged port.

  • Only entities with the serial numbers (SN) are shown. An entity without a SN is hidden, and its child is attached to the parent of the hidden entity.

  • Optical ports for XR devices are merged with the corresponding SFP and the RSIP. Ethernet port merging for XR devices is not supported.

  • When you select the device or chassis node in the topology tree, both physical and logical interfaces are shown. Other nodes show only physical interfaces.


You can view detailed inventory attributes for any device, including modules, summary, interface properties, alarms, and history, supporting informed operations and troubleshooting.

Identify the device routing details

Find out how data packets are routed through a specific device in your network topology.

Use this task to view path configuration, or review routing details for devices within the topology map.

Before you begin

Follow these steps to identify the device routing details:

Procedure


Step 1

From the main menu, choose Topology.

Step 2

Click the icon for the device you want to view on the topology map.

The routing details for that device are displayed in the right pane.


You can view routing information for the selected device, including network paths and connections.

Import a KML file

Add devices and their geographic locations to the topology map by importing a formatted Keynote Markup Language (KML) file.

Use this task when you want to visually map devices on a topology map according to their location information contained in a KML file.

Before you begin

If you do not have a device KML file:

  • Download the KML file template.

  • Open the template using your preferred tool.

  • Add one row for each device with the necessary information.

  • Save the updated KML file.

Procedure


Step 1

From the main menu, choose Topology.

Step 2

Click Import icon to open the Import KML File dialog box.

Step 3

Click Browse, select your KML file, and click Open.

Step 4

With the KML file selected, click Import.

Caution


Wait for the operation to finish before clicking Import again to avoid duplicate entries.


Devices and their locations appear on the topology map.

Export geographical data to a KML file

Obtain a KML file containing location information for network devices, which can be reused or imported into external mapping tools.

Use this task when you want to back up, share, or analyze device locations outside the current application.

Procedure


Step 1

From the main menu, choose Topology.

Step 2

In the right pane, click Export KML file.


The KML file containing device location data is downloaded to your system's default download folder.

Customize your topology map display

Enable visibility and personalize display options for devices, links, and alarms on your topology map to suit operational needs.

Use this task when you want to highlight specific device states, link characteristics, or alarms for network monitoring.

Before you begin

Procedure


Step 1

From the main menu, click Topology.

Step 2

On the topology map, open the Display preferences dialog box.

Step 3

In the Devices tab:

  1. Show or hide device state.

  2. Select your preferred label type, such as host name, IP address, or OSPF Router ID.

Step 4

In the Links tab:

  1. Toggle the option to distinguish aggregated links from single links.

    Note


    Aggregated dual stack links are displayed as a single line.

  2. Choose the link color scheme based on down state or utilization. If you select utilization, set the appropriate thresholds.

Step 5

In the Alarms tab:

  1. Show or hide device-level alarms.

  2. Filter alarms by severity to display only those at or above your chosen threshold.


The topology map updates to reflect your selected device, link, and alarm display preferences, providing a tailored view for effective network monitoring.

Troubleshooting the topology map

The table below lists common topology map issues, their possible causes, and suggested actions:

Issue Possible cause Recommended action
Devices do not appear on the topology map Devices are offline or unreachable Verify devices are powered on and connected to the network.
Incorrect topology layout Outdated network configuration Ensure device IP addresses, subnet masks, gateways, and DNS settings are correct.
Status shows as "unknown" or "unreachable" Network or configuration error Check device connectivity and management protocol settings.
Map does not match physical layout Devices added or removed without update Refresh the topology map after any network changes.

If the basic troubleshooting steps do not resolve your topology issue, refer these actions for further diagnosis.

Check error records in Topology services alarms and events report

Diagnose and resolve problems within Topology services by reviewing error records in the Alarm and Events report.

Topology services may encounter operational errors, such as missing data, communication failures, or configuration issues. These errors are captured in the Alarm and Events report, allowing you to quickly identify and address problems impacting network visibility.

Procedure


Step 1

From the main menu, go to Administration > Alarms.

Step 2

In the Source filter, enter topo to display alarms and events specific to Topology services.

The filtered Alarm Events report shows all related error records.

Step 3

Review the list for error records, noting any issues such as missing data or communication failures.

You will see all error records associated with Topology services, making it easier to diagnose and resolve operational problems.

What to do next

Investigate any error records found and take corrective actions as needed.

Rebuild the topology

Rebuilding the topology is a process of creating a new topology for our system. This is useful when the topology becomes inconsistent because of network problems or other unforeseen events. You should only rebuild the topology as a last resort.

The topology rebuild will refresh the topology and update the links and devices. The topology pages will not display links and devices when a rebuild is in progress. They will reappear after the rebuild is complete.

Procedure


Step 1

Turn the system maintenance mode on.

Choose Administration > Settings > System Settings > Maintenance mode.

Step 2

Begin the process of rebuilding the topology.

Under Topology, choose Maintenance and click Rebuild Topology.

Step 3

When the Confirm Topology Rebuild dialog box appears, click Rebuild Topology again.

Step 4

After links and devices reappear on the topology map indicating that the topology has been rebuilt, turn the maintenance mode off.

Choose Administration > Settings > System Settings > Maintenance mode.

Step 5

(Optional)You can view detailed events about the rebuild.

  1. Choose Alerts > Alarm and Events.

  2. From the Show drop-down list, select Events.

  3. From the Category drop-down list, select Network.