PTP Debugging over GRE Tunnel

The Precision Time Protocol (PTP) debugging over GRE tunnel feature enables the transport of PTP debugging information and PTP packets originated from this device through a GRE tunnel.

Information About PTP Debugging over GRE Tunnel

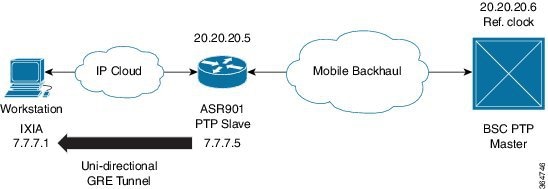
PTP debugging over GRE tunnel feature encapsulates the debugging dumps into the IP/UDP packets. The packets are transferred from the PTP slave device to a remote site device or IXIA through a GRE tunnel. The PTP packets received on the remote site are captured in a packet capture (PCAP) file, which is then used for analysis.

The following figure shows the sample Unidirectional tunnel with slave device topology.

Note


This feature should be used only for debugging purposes and in a maintenance window.


Figure 1. Topology: Unidirectional Tunnel with Slave Device

Prerequisites

  • Identify a remote site node, which is reachable through an IP path.

  • Ensure that the GRE tunnel configured on the PTP slave device is not carrying any data traffic at the time of PTP debugging.

  • Ensure that the tunnel configuration is not changed during PTP debugging.

  • Ensure that the PTP debugging dumps are enabled.

Restrictions

  • The PTP debugging over GRE tunnel feature is supported only for debugging.

  • Only Unidirectional GRE tunnel is supported.

  • This feature does not support the capture of PTP packets received from the peer on this device. It only supports the capture of PTP packets generated by this device.

  • This feature does not support the changes in tunnel configuration during execution.

Guidelines

  • Unidirectional GRE tunnel should be set up manually by the user from the PTP client node to the remote site node or IXIA where the packets are captured.

  • Manual configuration of GRE tunnel is required by the user.

  • The PTP packets are captured only for a 30 minutes duration in packet capture (PCAP) file. The debugging is disabled after 30 minutes.

  • After the successful capture of PTP packets, tunnel configuration must be manually removed from the slave device.

Configuring GRE Tunnel on Slave Device

Perform this task to configure GRE tunnel on the slave device.


Note


This feature configures a unidirectional GRE tunnel. The other end of the tunnel is not configured with any GRE tunnel configuration; however, that other end must be reachable through a pure IP path (no MPLS).


Procedure

  Command or Action Purpose

Step 1

enable

Example:


Router# enable

Enables privileged EXEC mode.

  • Enter your password if prompted.

Step 2

configure terminal

Example:

Router# configure terminal

Enters global configuration mode.

Step 3

interface tunnel number

Example:

Router(config)# interface Tunnel l0

Enters tunnel interface configuration mode. number is the number associated with the tunnel interface.

Step 4

ipv4 address ipv4-address subnet-mask

Example:

Router(config-if)# ip address 45.45.45.1 255.255.255.0

Specifies the IPv4 address and subnet mask for the interface.

Step 5

tunnel source type source-ip-address

Example:

Router(config-if)# tunnel source 7.7.7.5

Specifies the source of the tunnel interface.

Step 6

tunnel destination ip-address

Example:

Router(config-if)# tunnel destination 7.7.7.10

Defines the tunnel destination.

Step 7

end

Example:

Router(config-if)# end

Exits configuration mode and enters privileged EXEC mode.

Configuring PTP Debugging over GRE Tunnel

Perform the following steps to configure PTP debugging over GRE tunnel.

Procedure


Step 1

Enable PTP debugging dumps on the ASR901 PTP slave device using BCM shell commands. (Contact Cisco TAC to enable these commands.)

Step 2

Enable PTP debugging over GRE tunnel feature using the debug platform ptp interface tunnel command.

Step 3

Allow the packet capture to run for 30 minutes. After 30 minutes, disable the feature. (You can disable the PTP debugging over GRE tunnel feature using the no debug platform ptp interface tunnel command.)

Note


Generic debug commands like debug all and undebug all do not have any effect on this feature. You can only use the debug platform ptp interface tunnel command to enable the PTP debugging over GRE tunnel feature.