Reports

This chapter contains the following sections:

About Reports

The Reports option in the Cisco Business Dashboard provides a series of reports about your network. The reports provided include:

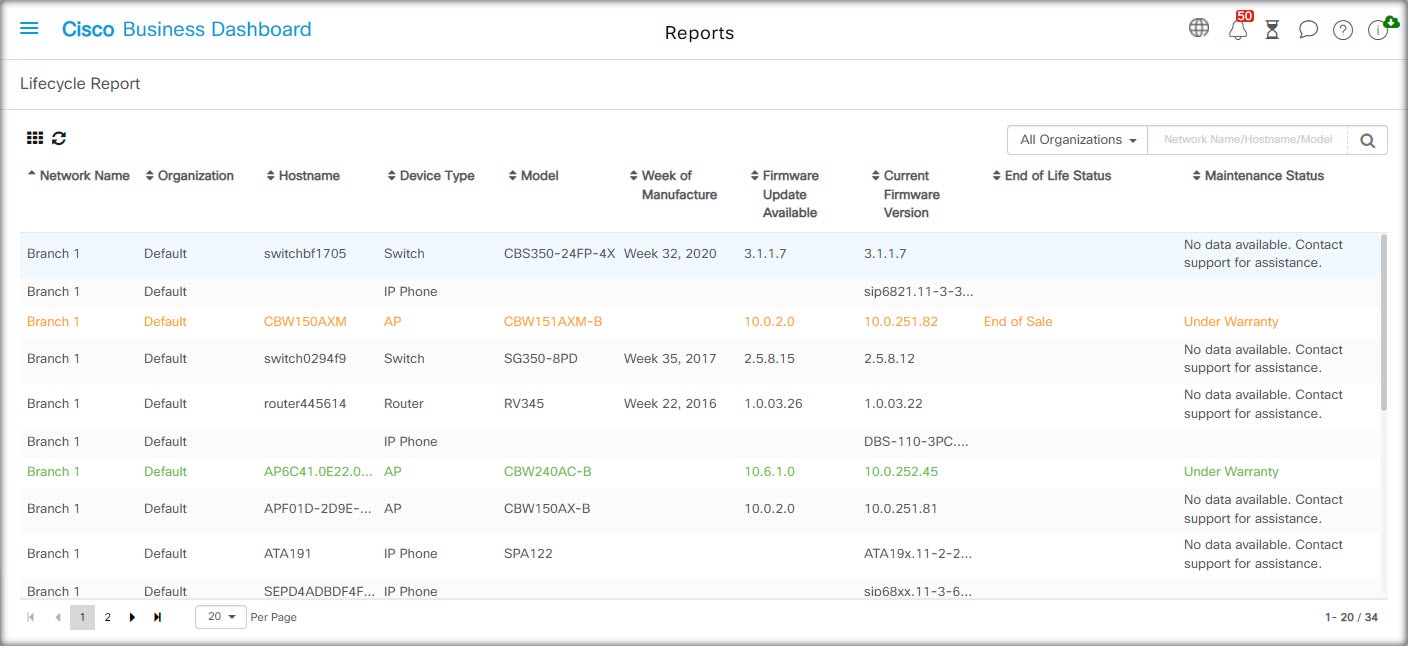
  • Lifecycle—Provides a summary of the lifecycle status of the devices in the network.

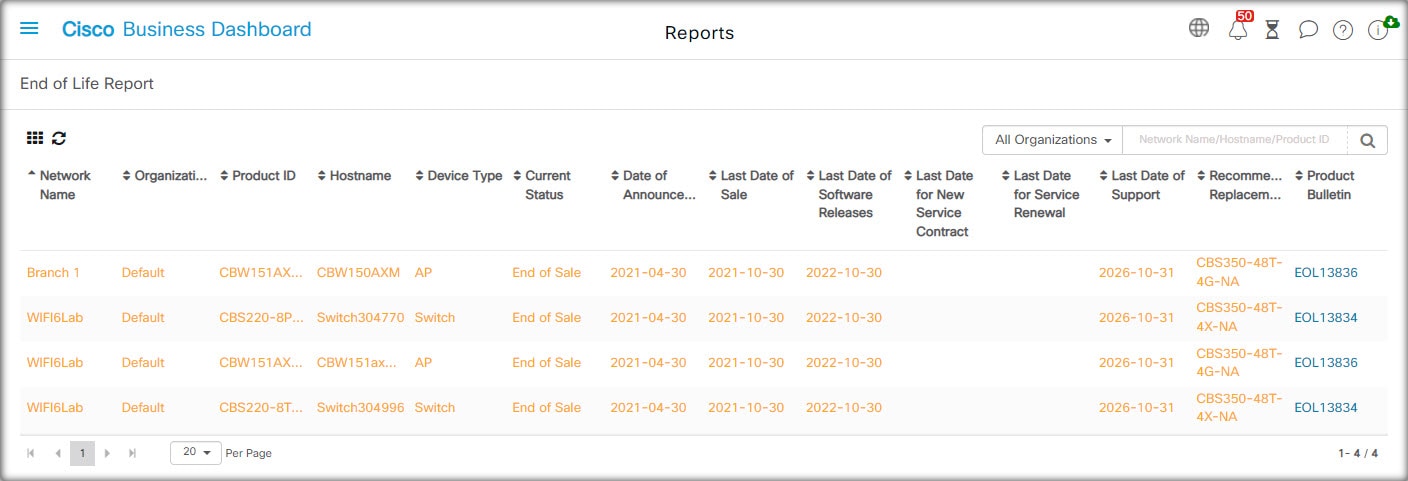
  • End of Life—Shows any devices that have an End of Life bulletin published.

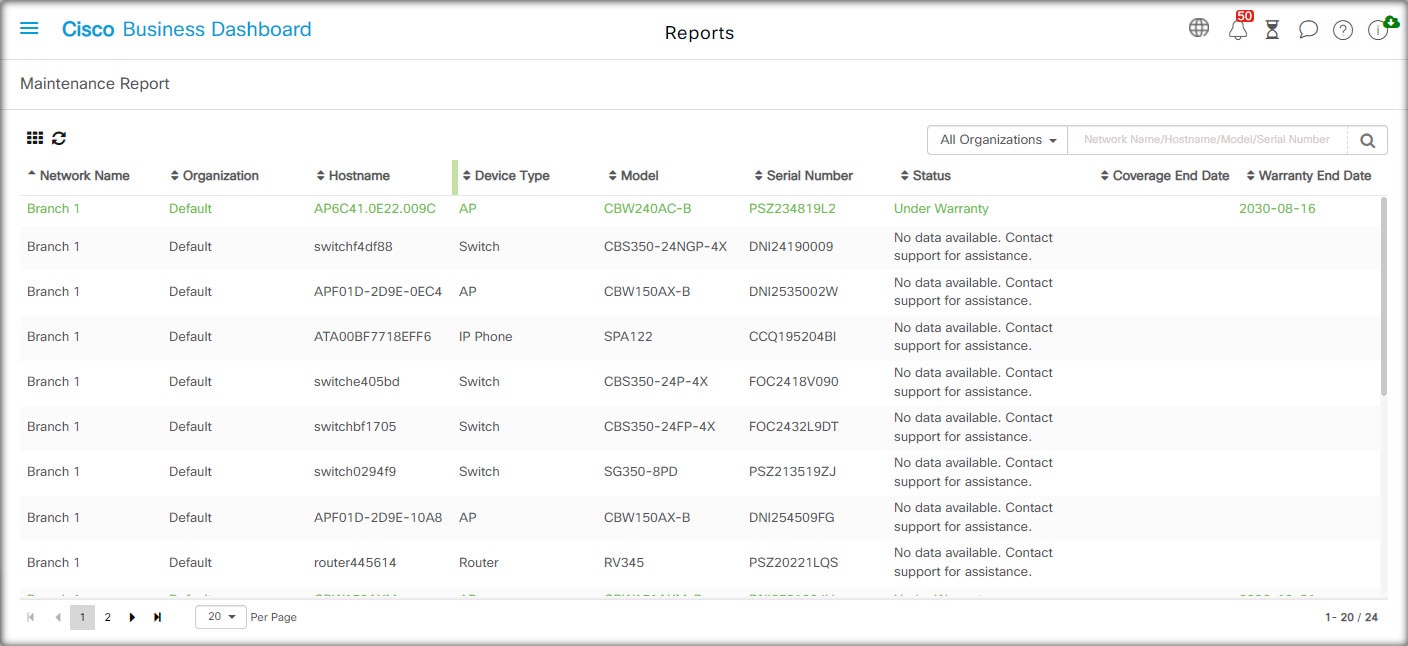
  • Maintenance—Lists all devices and their warranty state and whether the device has an active support contract.

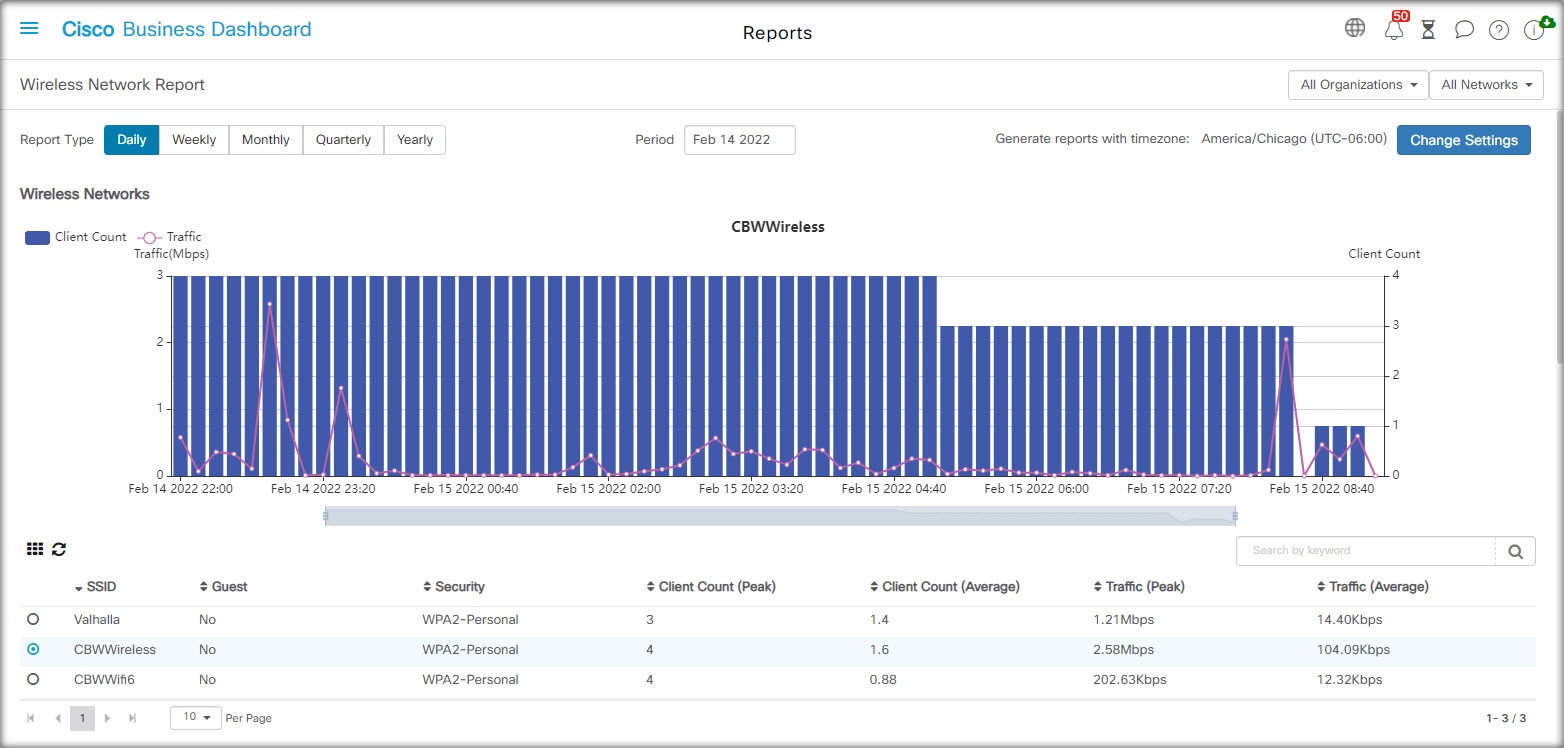
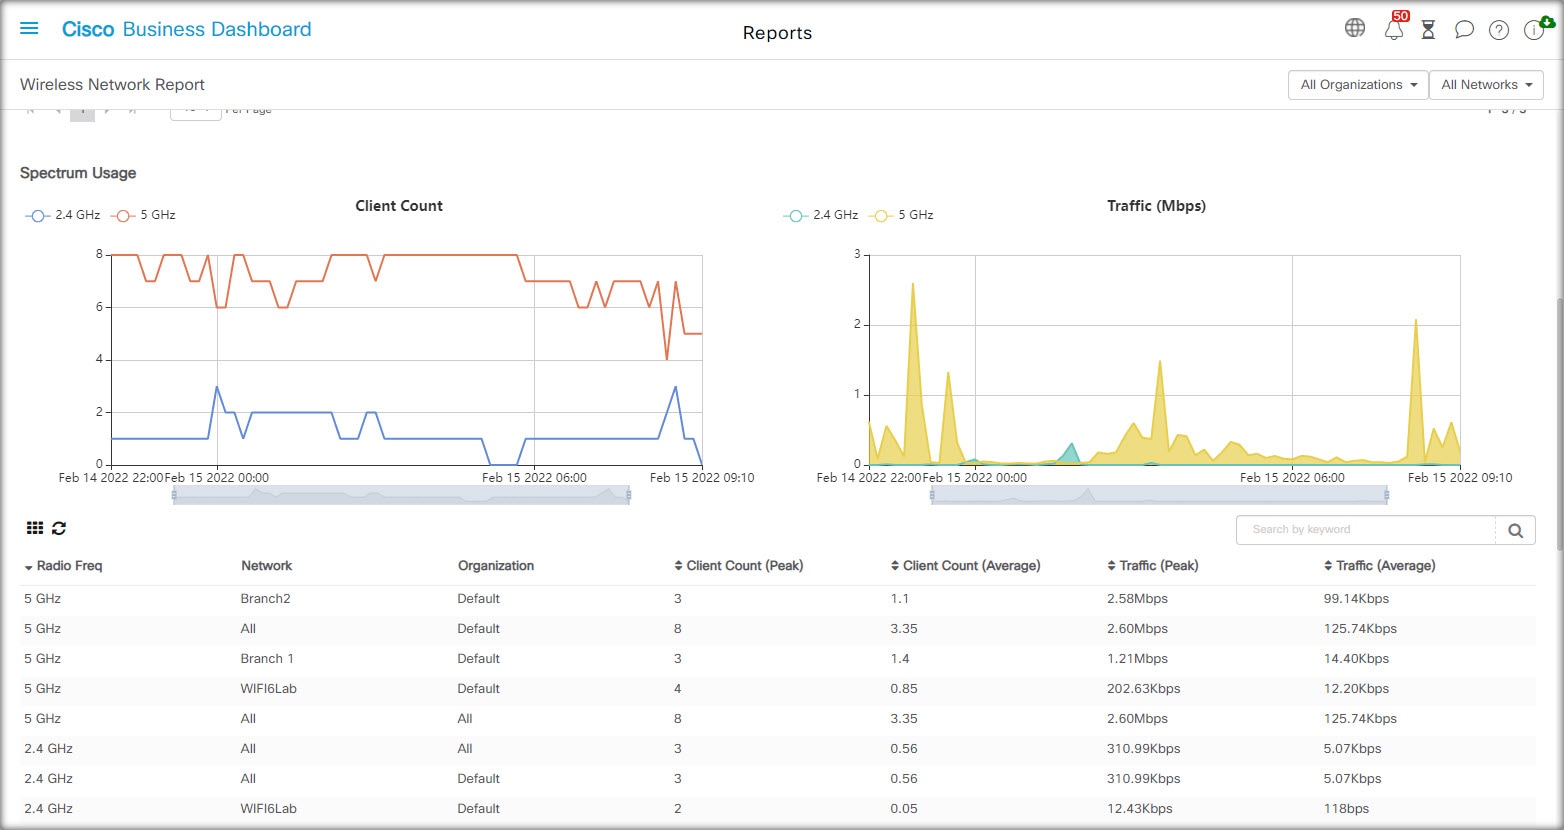
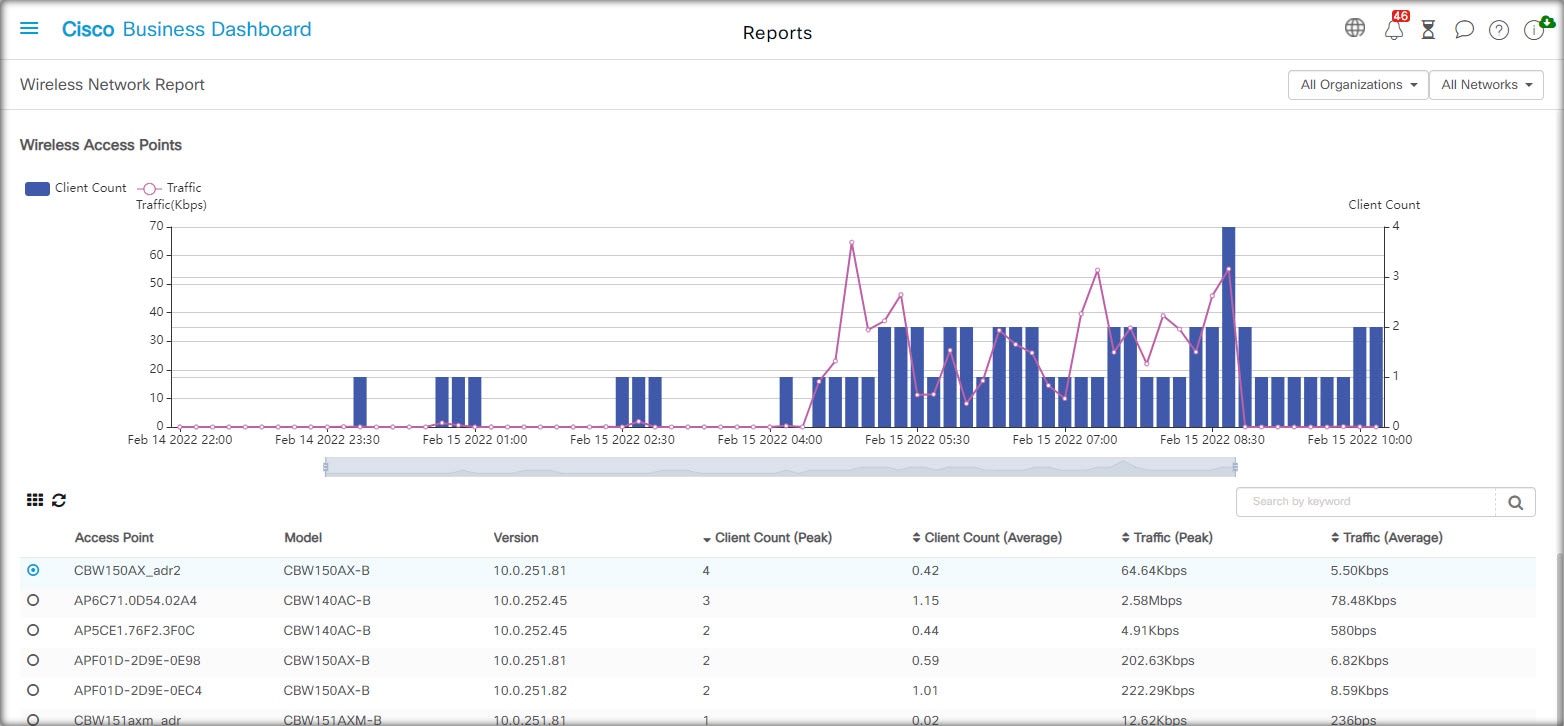
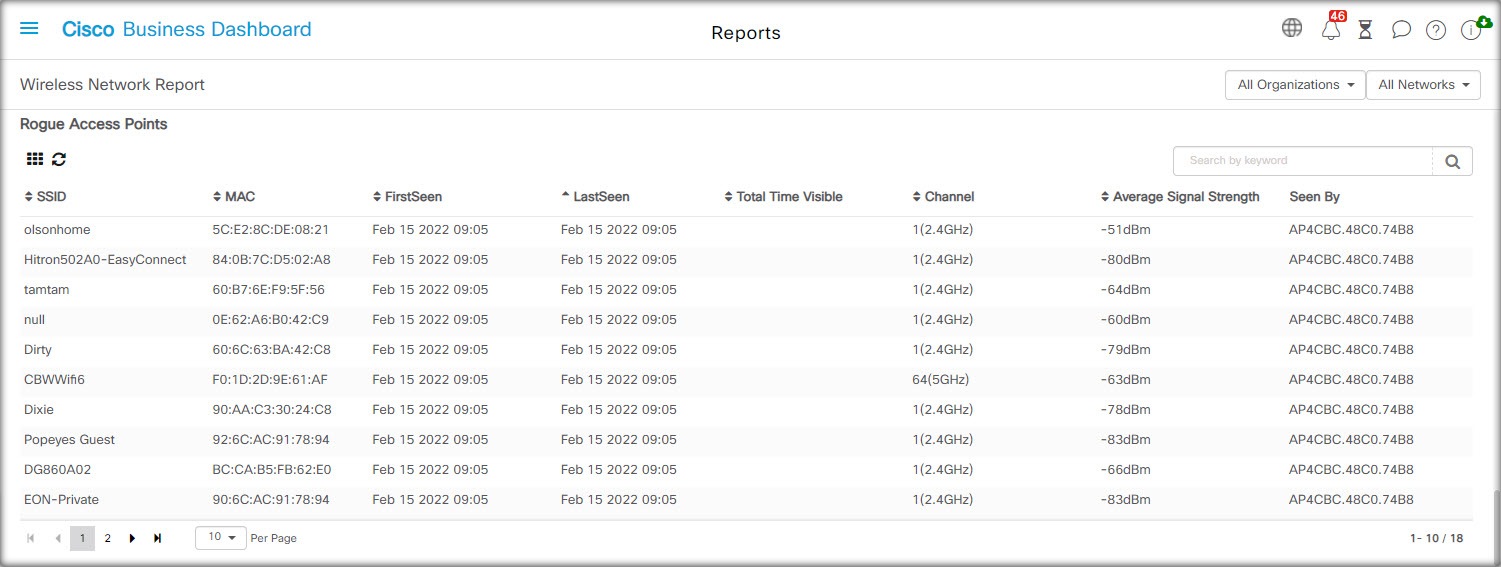
  • Wireless Network— Shows information about the wireless environment, including SSIDs, access points, and spectrum usage.

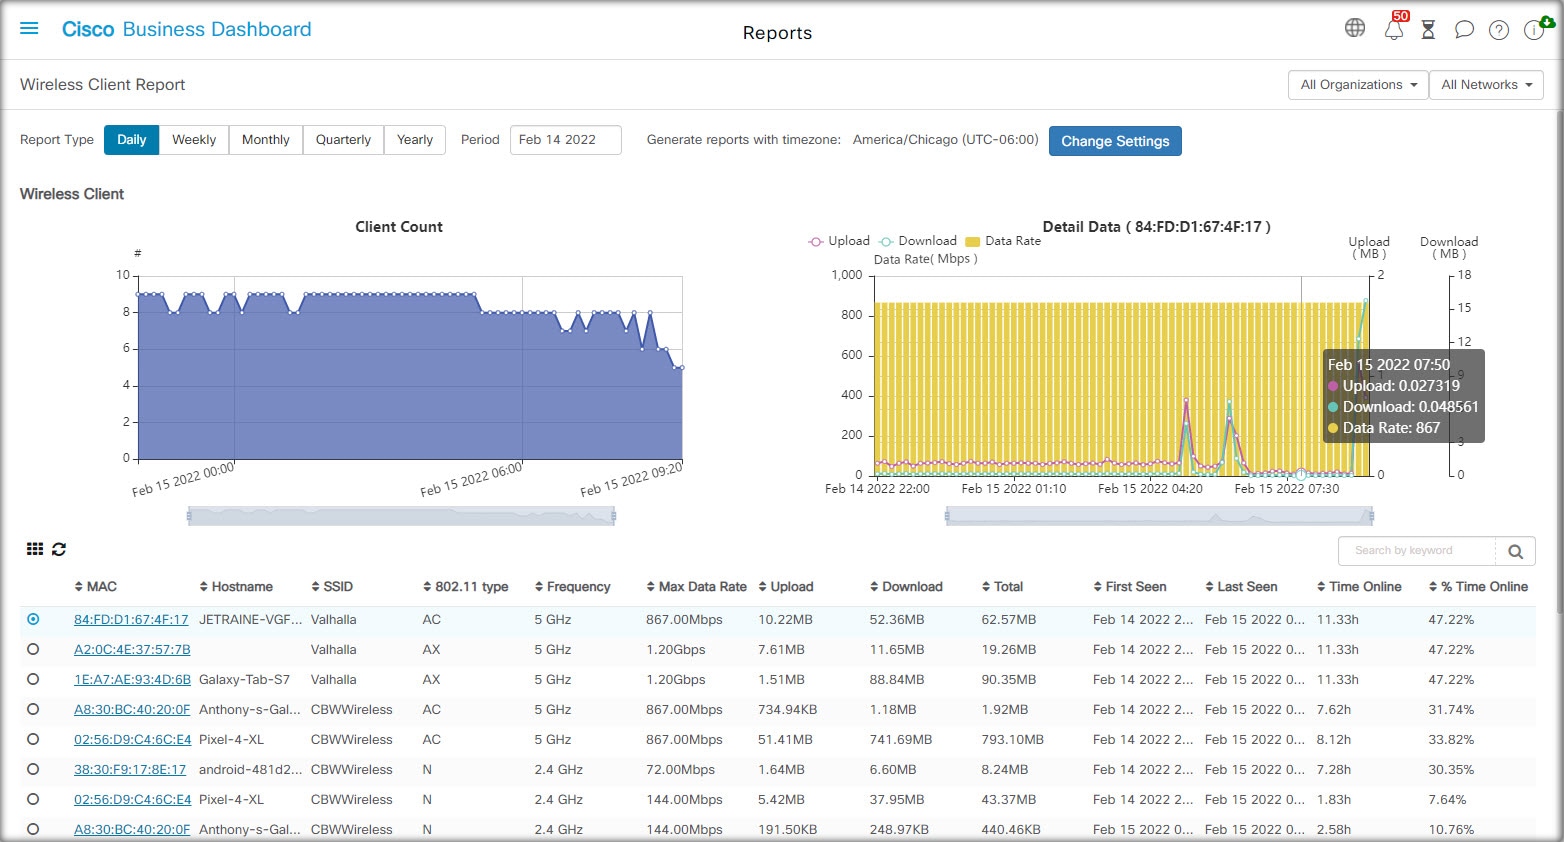
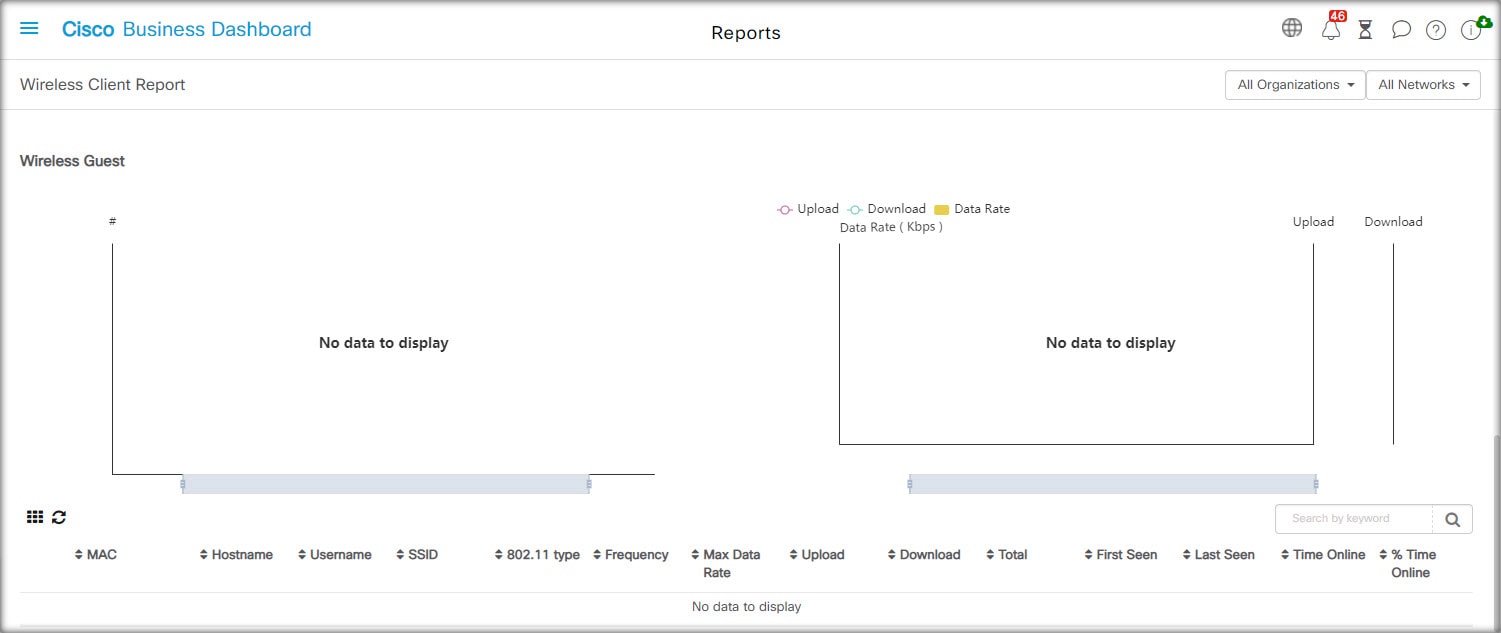
  • Wireless Client—Displays details about wireless clients seen on the network.

Viewing the Lifecycle Report

The Lifecycle Report provides a high level view of the status of the network devices, taking into account both software and hardware lifecycle status.

The following table describes the information provided in this report.

Field

Description

Network Name

The name of the network in which the device is located.

Organization

The organization the device belongs to.

Hostname

The hostname of the device.

Device Type

The type of device.

Model

The model number of the device.

Week of Manufacture

The date of manufacture for the device, displayed as week number and year.

Firmware Update Available

Displays the latest firmware version available for the device, or states that the device firmware is currently up to date.

Firmware Version

Displays the current firmware version running on the device.

End of Life Status

Specifies if an End of Life bulletin has been published for the device and the date of the next key milestone in the End of Life process.

Maintenance Status

Specifies if the device is currently under warranty or covered by a support contract.

The row in the table for a device that may require attention is color-coded to indicate the urgency. For example, a device with a published End of Life bulletin will be colored orange if the End of Support milestone has not been reached, and red if the device is no longer supported by Cisco.

The Search box located at the top of the report can be used to filter the results. Enter text in the Search box to limit the number of entries that are displayed with the matching text. Results may be limited to a specific organization using the Organization drop-down.

The column selection icon at the top left of the report can be used to customize the information displayed. Click on the icon and then use the check boxes that appear to select the columns you wish to include in the report.

Viewing the End of Life Report

The End of Life Report lists any devices that have an End of Life bulletin published, along with key dates in the End of Life process, and the recommended replacement platform.

The following table describes the information provided:

Field

Description

Network Name

The name of the network in which the device is located.

Organization

The organization the device belongs to.

Product ID

The product ID or part number of the device.

Hostname

The hostname of the device.

Device Type

The type of device.

Current Status

The stage at which the End of Life process of the product is at.

Date of Announcement

The date the End of Life bulletin was published.

Last Date of Sale

The date after which the product will no longer be sold by Cisco.

Last Date of Software Releases

The date after which no more software versions will be released for the product.

Last Date for New Service Contract

The last date for taking out a new support contract on the device.

Last Date for Service Renewal

The last date for renewing an existing support contract on the device.

Last Date of Support

The date after which Cisco will no longer provide support for the product.

Recommended Replacement

The recommended replacement product.

Product Bulletin

The product bulletin number and a link to the bulletin on the Cisco website.

Each row of the table is color-coded to indicate the stage of the End of Life process the device is at. For example, a device that has past the Last Date of Sale but not yet reached the Last Date of Support will be colored orange, and a device that is past the Last Date of Support is colored red.

The Search box located at the top of the report can be used to filter the results. Enter text in the Search box to limit the number of entries that are displayed with the matching text. Results may be limited to a specific organization using the Organization drop-down.

The column selection icon at the top left of the report can be used to customize the information displayed. Click on the icon and then use the check boxes that appear to select the columns you wish to include in the report.

Viewing the Maintenance Report

The Maintenance Report lists all network devices which includes the warranty and support contract status information for each of them.

The following table describes the information provided in this report.

Field

Description

Network Name

The name of the network in which the device is located.

Organization

The organization the device belongs to.

Hostname

The hostname of the device.

Device Type

The type of device.

Model

Model number of the device.

Serial Number

The serial number for the device.

Status

The current support status of the device.

Coverage End Date

The date at which the current support contract will expire.

Warranty End Date

The date at which the warranty for the device will expire.

Each row of the table is color-coded to indicate the support status for the device. For example, a device that is approaching the expiry date of the warranty or support contract will be colored orange, while a device that is out of warranty and does not have a current support contract will be colored red.

The Search box located at the top of the report can be used to filter the results. Enter text in the Search box to limit the number of entries that are displayed with the matching text. Results may be limited to a specific organization using the Organization drop-down.

The column selection icon at the top left of the report can be used to customize the information displayed. Click on the icon and then use the check boxes that appear to select the columns you wish to include in the report.

Viewing the Wireless Network Report

The Wireless Network Report shows details about the wireless network broken down by SSID, wireless spectrum usage, and access point, and includes a list of rogue access points that have been detected. Reports can be generated for time ranges from daily to yearly using the controls at the top of the page.

Several of the data sets include a graph that shows a breakdown over time for the selected row. You can click on the labels in the legend on the graph to toggle the display of each set of data.

The following tables describes the information provided in the different sections of the report.


Wireless Networks Table

SSID

The wireless network name.

Network (hidden by default)

The network where the SSID is located.

Organization (hidden by default)

The organization the SSID belongs to.

Guest

Whether the SSID is configured for guest access.

Security

The security method configured for the SSID.

Client Count (Peak)

The maximum number of clients associated with the SSID during the period covered by the report.

Client Count (Average)

The average number of clients associated with the SSID during the period covered by the report.

Traffic (Peak)

The maximum aggregate traffic rate through the SSID during the period covered by the report.

Traffic (Average)

The average aggregate traffic rate through the SSID during the period covered by the report.


Spectrum Usage Table

Radio Freq

The radio frequency band in use – either 2.4GHz or 5GHz.

Network

The network the spectrum usage data displayed applies to.

Organization

The organization the spectrum usage data applies to.

Client Count (Peak)

The maximum number of clients using the frequency band during the period covered by the report.

Client Count (Average)

The average number of clients using the frequency band during the period covered by the report.

Traffic (Peak)

The maximum aggregate traffic rate through the frequency band during the period covered by the report.

Traffic (Average)

The average aggregate traffic rate through the frequency band during the period covered by the report.


Wireless Access Point Table

Access Point

The name of the access point.

Network (hidden by default)

The network where the access point is located.

Organization (hidden by default)

The organization the access point belongs to.

Model

The model of the access point.

Version

The firmware version running on the access point.

Client Count (Peak)

The maximum number of clients associated with the access point during the period covered by the report.

Client Count (Average)

The average number of clients associated with the access point during the period covered by the report.

Traffic (Peak)

The maximum aggregate traffic rate through the access point during the period covered by the report.

Traffic (Average)

The average aggregate traffic rate through the access point during the period covered by the report.


Rogue Access Points Table

SSID

The SSID detected.

Network (hidden by default)

The network where the detecting access point is located.

Organization (hidden by default)

The organization the detecting access point belongs to.

MAC

The MAC address of the rogue access point.

First Seen

The time at which the rogue access point was first detected.

Last Seen

The time at which the rogue access point was last seen.

Total Time Visible

The total time that the rogue access point was online.

Channel

The wireless channel used by the rogue access point.

Average Signal Strength

The average signal strength of the rogue access point as seen by the detecting access point.

Seen By

The access point(s) that detected the rogue access point.

Viewing the Wireless Client Report

The Wireless Client Report shows details about the wireless clients on the network. Reports may be generated for time ranges from daily to yearly using the controls at the top of the page.

Each data sets includes graphs that shows a breakdown over time for the selected row. You may click on the labels in the legend on the graph to toggle the display of each set of data.

The following tables describe the information provided in each report.


Wireless Clients Table

MAC

The MAC address of the client

Hostname

The hostname of the client, where available.

Organization

The organization in which the client was last seen.

Network

The network where the client was last seen.

SSID

The SSID the client was last associated with.

802.11 Type

The 802.11 variant used by the client.

Frequency

The frequency band used by the client.

Max Data Rate

The maximum data rate used by the client.

Upload

The volume of data uploaded by the client.

Download

The volume of data downloaded by the client.

Total

The total volume of data sent and received by the client.

First Seen

The time at which the client was first detected.

Last Seen

The time at which the client was last seen.

Time Online

The total time that the client was online.

% Online Time

The percentage of time the client was online in the total time the client was known to the network.


Table 1. Wireless Guests Table

Wireless Guests Table

MAC

The MAC address of the client.

Hostname

The hostname of the client, where available.

Username

The username entered by the client in the guest portal.

Organization

The organization in which the client was last seen.

Network

The network where the client was last seen.

SSID

The SSID the client was last associated with.

802.11 Type

The 802.11 variant used by the client.

Frequency

The frequency band used by the client.

Max Data Rate

The maximum data rate used by the client.

Upload

The volume of data uploaded by the client.

Download

The volume of data downloaded by the client.

Total

The total volume of data sent and received by the client.

First Seen

The time at which the client was first detected.

Last Seen

The time at which the client was last seen.

Time Online

The total time that the client was online.

% Online Time

The percentage of time the client was online in the total time the client was known to the network.


Note


The First Seen and Last Seen timestamps are the time reported by the access point. It is recommended that all network devices implement clock synchronization using a mechanism such as the Network Time Protocol (NTP).