Assurance

The section contains the following topics:

About the Event Log

Open the Event Log screen to search for events that happen across your network. This screen provides an interface where you can search and sort through the events generated across the network. Up to 500,000 of these events are stored for a maximum of 90 days. You can use the filter controls provided to limit the events displayed based on any combination of the following parameters:

Add a Time to specify the start and end times for the period of interest. Only events occurring in this period will be displayed.


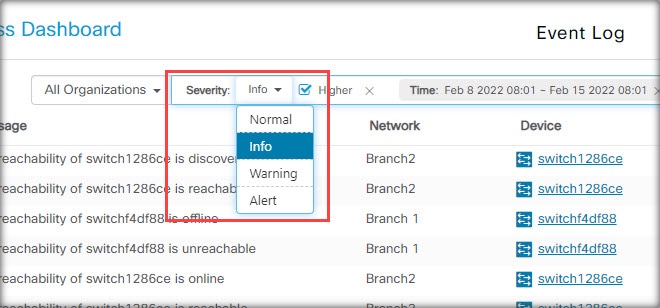
Add a Severity filter to select the level of events to display. You can also check the Higher checkbox to include events with a higher severity level.


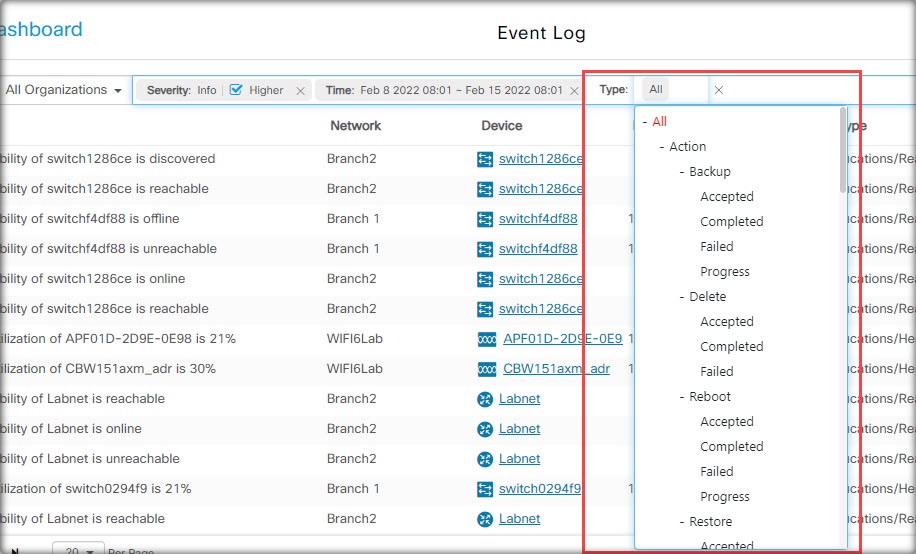
Add the Type filter to select one or more event types to display. The types are arranged in a tree structure, and selecting a type will automatically include all event types underneath the selected type in the tree.


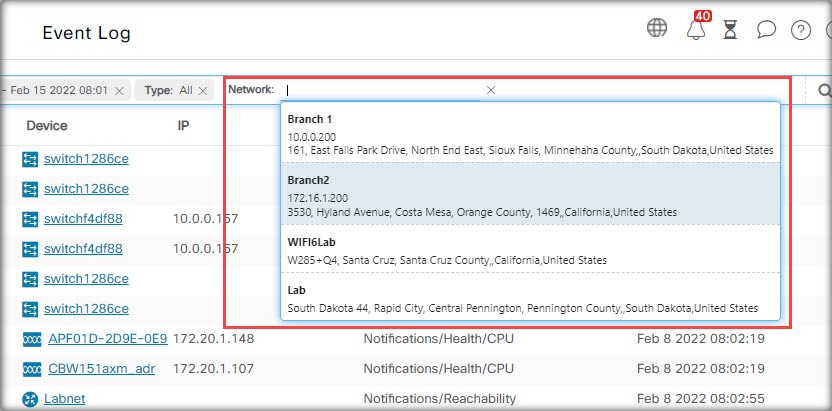
Use the Networkfilter to display events by one or more networks. As you type, matching sites will be displayed.


Use the Devicefilter to display events by one or more devices. As you type, matching devices will be displayed. You can also specify devices by name, IP address, or MAC address.


Events that match the filter conditions will be displayed in a table like the example shown below. You can also sort the information in the table using the column headings.


Monitoring Defaults

Monitoring Profiles allow you to control the device monitoring that is performed in the network. Monitoring Profiles may be applied at the organization level or at the system level. Organizations that choose to inherit system level monitoring profiles will have the behavior controlled by the Monitoring Defaults page.

To change the Monitoring Profiles applied across the system, follow the steps below.

  1. Navigate to Assurance > Monitoring > Monitoring Defaults.

  2. Use the drop-downs to select the appropriate monitoring profile to be applied to devices of the corresponding type. See Managing Monitoring Profiles for more information on creating monitoring profiles.

  3. Click Save.

See Managing Monitoring Profiles for more information about the types of monitoring that can be performed and how to configure them. See Organizations for details on changing monitoring settings at the organization level.

Monitoring Profiles

Monitoring Profiles control the data that is collected from devices and the notifications that are generated. Profiles can be applied to different types of devices within an organization or across the system. For instance some devices might need different monitoring requirements depending on their location or security requirements. Within a profile, two types of monitors are supported – Notification Monitors and Reporting Monitors.

Notification Monitors cause notifications and alerts to be generated, usually due to a change in device state or a parameter crossing a threshold. Notifications have different levels of severity – informational, warning and alert – and can be delivered through the following channels:

  • Pop-up notifications of the Web UI.

  • Email. This requires that email settings are correctly configured. See Managing Email Settings for more details.

  • Help desk ticket. This requires integration with an application providing help desk services. See Managing Integration Settings for more details.

  • Collaboration message. This requires integration with a collaboration application. See Managing Integration Settings for more details.

  • Cisco Business Mobile App. Please install a Cisco Business Mobile App and follow the instructions.


Note


Cisco recommends you configure the Monitoring Profiles to ensure the average rate of 60 tickets and/or collaboration messages per hour is not exceeded. When communicating with external applications, sustained rates over this could result in API congestion and loss of events.


Active notifications are also visible in the Notification Center and are displayed in the device information views. Changes in notifications are also recorded in the Event Log

Reporting monitors collect the data used for the wireless reports and traffic graphs in the monitoring dashboard.

Multiple monitoring profiles can be created, and different profiles can be assigned to different device types at the system level or on a per-organization basis. For more information on assigning monitoring profiles to devices, see Organizations and Monitoring Defaults.

Add a New Monitoring Profile

  1. Navigate to Assurance > Monitoring > Monitoring Profiles.

  2. Click the + (plus) icon to create a new profile

  3. Specify a name for the profile and an organization to associate the profile to. You can also specify All Organizations here, allowing the profile to be used with any organization or as a system level default.

  4. You can also provide a description for the profile and a comma-separated list of email address to receive notifications.

  5. Click Save

  6. The screen updates to display the different notification and reporting monitors. You can enable and disable individual monitors using the controls provided.

  7. The notification monitors have additional settings that can be modified by clicking the Edit icon for the monitor. The settings will vary between monitors, but include the notification types that should be generated, the severity of the notification, and the thresholds that should trigger the notification.

Copy an Existing Monitoring Profile

To copy an existing monitoring profile, follow the steps below.

  1. Navigate to Assurance > Monitoring > Monitoring Profiles.

  2. Select the check box next to the profile to be copied and click the Save As icon.

  3. Update the profile name, description, organization and email address(es) as required, then click Save.

  4. Make changes to the notification and reporting monitors as required. You can restore the monitor settings to the defaults by clicking the Reset to defaults button.

Modify a Monitoring Profile

To modify an existing monitoring profile, follow the steps below.

  1. Navigate to Assurance > Monitoring > Monitoring Profiles

  2. Select the check box next to the profile to be copied and click the Edit icon.

  3. Update the profile settings and email address(es) as required, then click Save.

  4. Make changes to the notification and reporting monitors as required. You can restore the monitor settings to the defaults by clicking the Reset to defaults button.

Remove a Monitoring Profile

  1. Navigate to Assurance > Monitoring > Monitoring Profiles.

  2. Select the check box next to the profile to be copied and click the Delete icon.


Note


If the profile is in use as an organization-level monitoring profile, then the corresponding organization and device type will be updated to inherit the system-level configuration. Profiles that are in use as system-level monitoring profiles can not be removed. Remove the profile from the Assurance > Monitoring > Monitoring Defaults page before deleting it.


Troubleshooting

Switches and wireless access points (WAPs) are essential components in modern networking, providing seamless connectivity for various devices. However, like any technology, they can encounter issues that disrupt network performance. Troubleshooting switches and wireless access points involves identifying and resolving these problems to ensure a stable and efficient network. The following topics will explore common issues such as connectivity problems, slow speeds, interference, and network congestion, offering practical solutions to restore optimal functionality.

Ping

The Ping utility tests if a remote host can be reached and measures the round-trip time for packets sent. Ping operates by sending Internet Control Message Protocol (ICMP) echo request packets to the target host and waiting for an ICMP response, sometimes called a pong. It measures the round-trip time and records any packet loss. To ping a host, follow the steps below.

Procedure


Step 1

Navigate to Assurance > Troubleshooting > Ping.

Step 2

Use the drop-downs to select the device from which to initiate the Ping.

Step 3

Enter the target host address in the Destination field, specifying either a domain name, IPv4, or IPv6 (only IPv6 global unicast addresses are supported).

Step 4

Optionally, specify the number of ping attempts and packet size.

Step 5

Click Ping to ping the host.

Step 6

View the results of the ping.

  • Status - Fail or succeed.

  • Packet Loss - Percentage of packets lost in ping process.

  • Sent/Received Packets - Number of packets sent / received by ping.

  • Min/Avg/Max Round Trip Time - Shortest / Longest / Average time for packet to return.


Traceroute

Traceroute discovers the IP routes forwarded by sending an IP packet to the target host and back to the device. The Traceroute page shows each hop between the device and a target host, and the round-trip time to each such hop. To traceroute a host, follow the steps below.

Procedure


Step 1

Navigate to Assurance > Troubleshooting > Traceroute.

Step 2

Use the drop-downs to select the device from which to initiate the traceroute.

Step 3

In the Destination edit box input the target host address, which can be specified using domain name, IPv4 or IPv6 (only support IPv6 global unicast addresses).

Step 4

You can optionally specify the maximum number of hops that traceroute permits. This is used to prevent a case where the sent frame gets into an endless loop. The traceroute terminates when the destination is reached or when this value is reached.

Step 5

Click Tracerouteto traceroute the host. Once completed, the result appears.

Step 6

View the results of the traceroute.

  • Status - Fail or succeed.

  • Index - Displays the number of the hop.

  • Host - Displays a stop along the route to the destination.

  • Round Trip Time (1-3) - Displays the round trip time (ms) and Status.


Device Integrity

This service analyzes the integrity of your Cisco product by verifying key components of Cisco's software and hardware that include Cisco's Trustworthy Technologies. These security technologies are designed into Cisco Networking devices to protect against counterfeit and software modification and verify that Cisco products are operating as intended.

To verify device integrity, follow these steps:

  1. Copy the CLI commands.

  2. Open the device command line interface (CLI), paste and run the CLI commands.

  3. On the CBD GUI, paste the CLI outputs or save the CLI outputs into a file, then upload.

  4. Click Verify.

Notifications

This segment contains the following sections:

About Notifications

Cisco Business Dashboard generates notifications when different events occur in the network including Connectwise or Webex teams integration notifications. A notification may generate an email or a pop-up alert that appears in the lower right corner of the browser, and all notifications are logged for later review.

Notifications can also be acknowledged when they are no longer of interest. Those notifications will be hidden from the Notification Center by default.

Supported Notifications

The following table lists the notifications supported by Cisco Business Dashboard

Table 1. Supported Notifications

Event

Level

Description

Clears Automatically?

Device Notifications for Access Points, Routers, IP Phones and Switches

Reachability/Device Discovered

Information

A new device is detected on the network.

Yes, 5 minutes after the device is discovered.

Reachability/Device Unreachable

Warning

A device is known through a discovery protocol, but is not reachable using IP.

Yes, when the device is reachable through IP again.

Reachability/Device Offline

Alert

A device is no longer detectable on the network

Yes, when the device is rediscovered.

Credential Required/SNMP

Warning

The Probe is unable to access the device due to an authentication error.

Yes, when the Probe authenticates.

Credential Required/User ID

Warning

The Probe is unable to access the device due to an authentication error.

Yes, when the Probe authenticates.

Credential Required/Password Expired

Warning

The password has expired for the admin user on the device.

Yes, when the password on the device has been reset.

Configuration Mismatch

Alert

The current device configuration does not match the configuration specified in Cisco Business Dashboard configuration profiles and device settings.

Yes, when the configuration mismatch is resolved.

Device Service/SNMP

Warning

SNMP is disabled on the device.

Yes, when SNMP is enabled.

Device Service/Web service

Warning

The web service is disabled on the device.

Yes, when web service API is enabled

Health

Warning/Alert

The device health level changes to warning or alert.

Yes, when the device health returns to normal.

Cisco Support Notifications

Firmware

Information

A later version of firmware is available on cisco.com

Yes, when the device is updated to the latest version.

End of Life

Warning/Alert

An End of Life bulletin is found for the device or an End of Life milestone has been reached.

No

Maintenance Expiry

Warning/Alert

The device is out of warranty and/or does not have a currently active maintenance contract.

Yes, if a new maintenance contract is taken out.

Device Health Notifications

CPU

Warning/Alert

Device CPU usage exceeds maximum thresholds.

Yes, when the CPU usage returns to a normal level.

Uptime

Warning/Alert

Device uptime is below minimum thresholds.

Yes, when the device uptime exceeds minimum levels.

Connected Clients

Warning/Alert

The number of connected clients exceeds maximum thresholds.

Yes, when the number of connected clients returns to an acceptable level.

Viewing and Filtering Current Device Notifications

To view currently active notifications for a single device or all devices, do the following:

Procedure


Step 1

In the Home window, click Notification Center icon on the top right corner of the global tool bar. The number badge on the icon specifies the total number of unacknowledged notifications outstanding, and the color of the badge indicates the highest severity level currently outstanding.

Any notifications currently outstanding are listed below the icons in the Notification Center. The number on the severity icon provides a total of the number of notifications in each of the following categories:

  • Information (green circle icon)

  • Warning (orange triangle icon)

  • Alert (red inverted triangle icon)

Step 2

In the Notification Center, you can perform the following actions:

  • Acknowledge a notification—Check the check box against the notification to acknowledge it. You may acknowledge all notifications in the display by checking the ACK All checkbox

  • Filter the displayed notifications—Instructions for this action is provided in the following step

Step 3

The Filter box limits the notifications displayed in the table. By default, notifications of all types and all severity levels will be displayed. To change an existing filter, double click on that filter to change the setting. To add a new filter, click on the Add Filter label and select a filter from the dropdown list. The following filters are available:

Table 2. Available Filters

Filter

Description

Notification Type

The type of notification to be displayed. For example, to display notifications for devices that are offline, choose Device Offline from the drop-down list.

Severity

The severity level of the notifications to be displayed. It can be one of the following:

  • Info

  • Warning

  • Alert

You may include higher severity levels by selecting the Higher checkbox.

Include Ack

Include notifications that have been acknowledged.

Network

Displays notifications for the specified network(s). Start typing in the filter and matching networks will be listed in a dropdown. Click to select the desired network.

You may include multiple networks in the filter.

Device

Displays notifications for the specified device(s). Start typing in the filter and matching devices will be listed in a dropdown. Click to select the desired device.

You may include multiple devices in the filter.

Note


Notifications for individual devices may be seen in the Basic Info and the Detailed Info panels for the device.

To control how you receive notifications, change the notification settings at the organization or system level.


Viewing and Filtering Historical Device Notifications

The occurrence or change in state of any notification is recorded as an event on the Dashboard, and may be viewed through the Event Log. A subset of the event log can be viewed through the following panels:

The Basic Info panel or the Device Detail panel displays individual devices.

The Basic Info Panel shows only the last 24 hours worth of events.

The Device Detail panel shows all historical data for the device that is available.


Note


The Device Detail panel can be filtered to help isolate those events you are interested in. See Event Log for more information on viewing and filtering historical events.