Using Cisco Business Dashboard and Probe

The section contains the following topics:

Using the Cisco Business Dashboard GUI

This chapter provides an overview of the Cisco Business Dashboard GUI including descriptions of the navigation pane links.
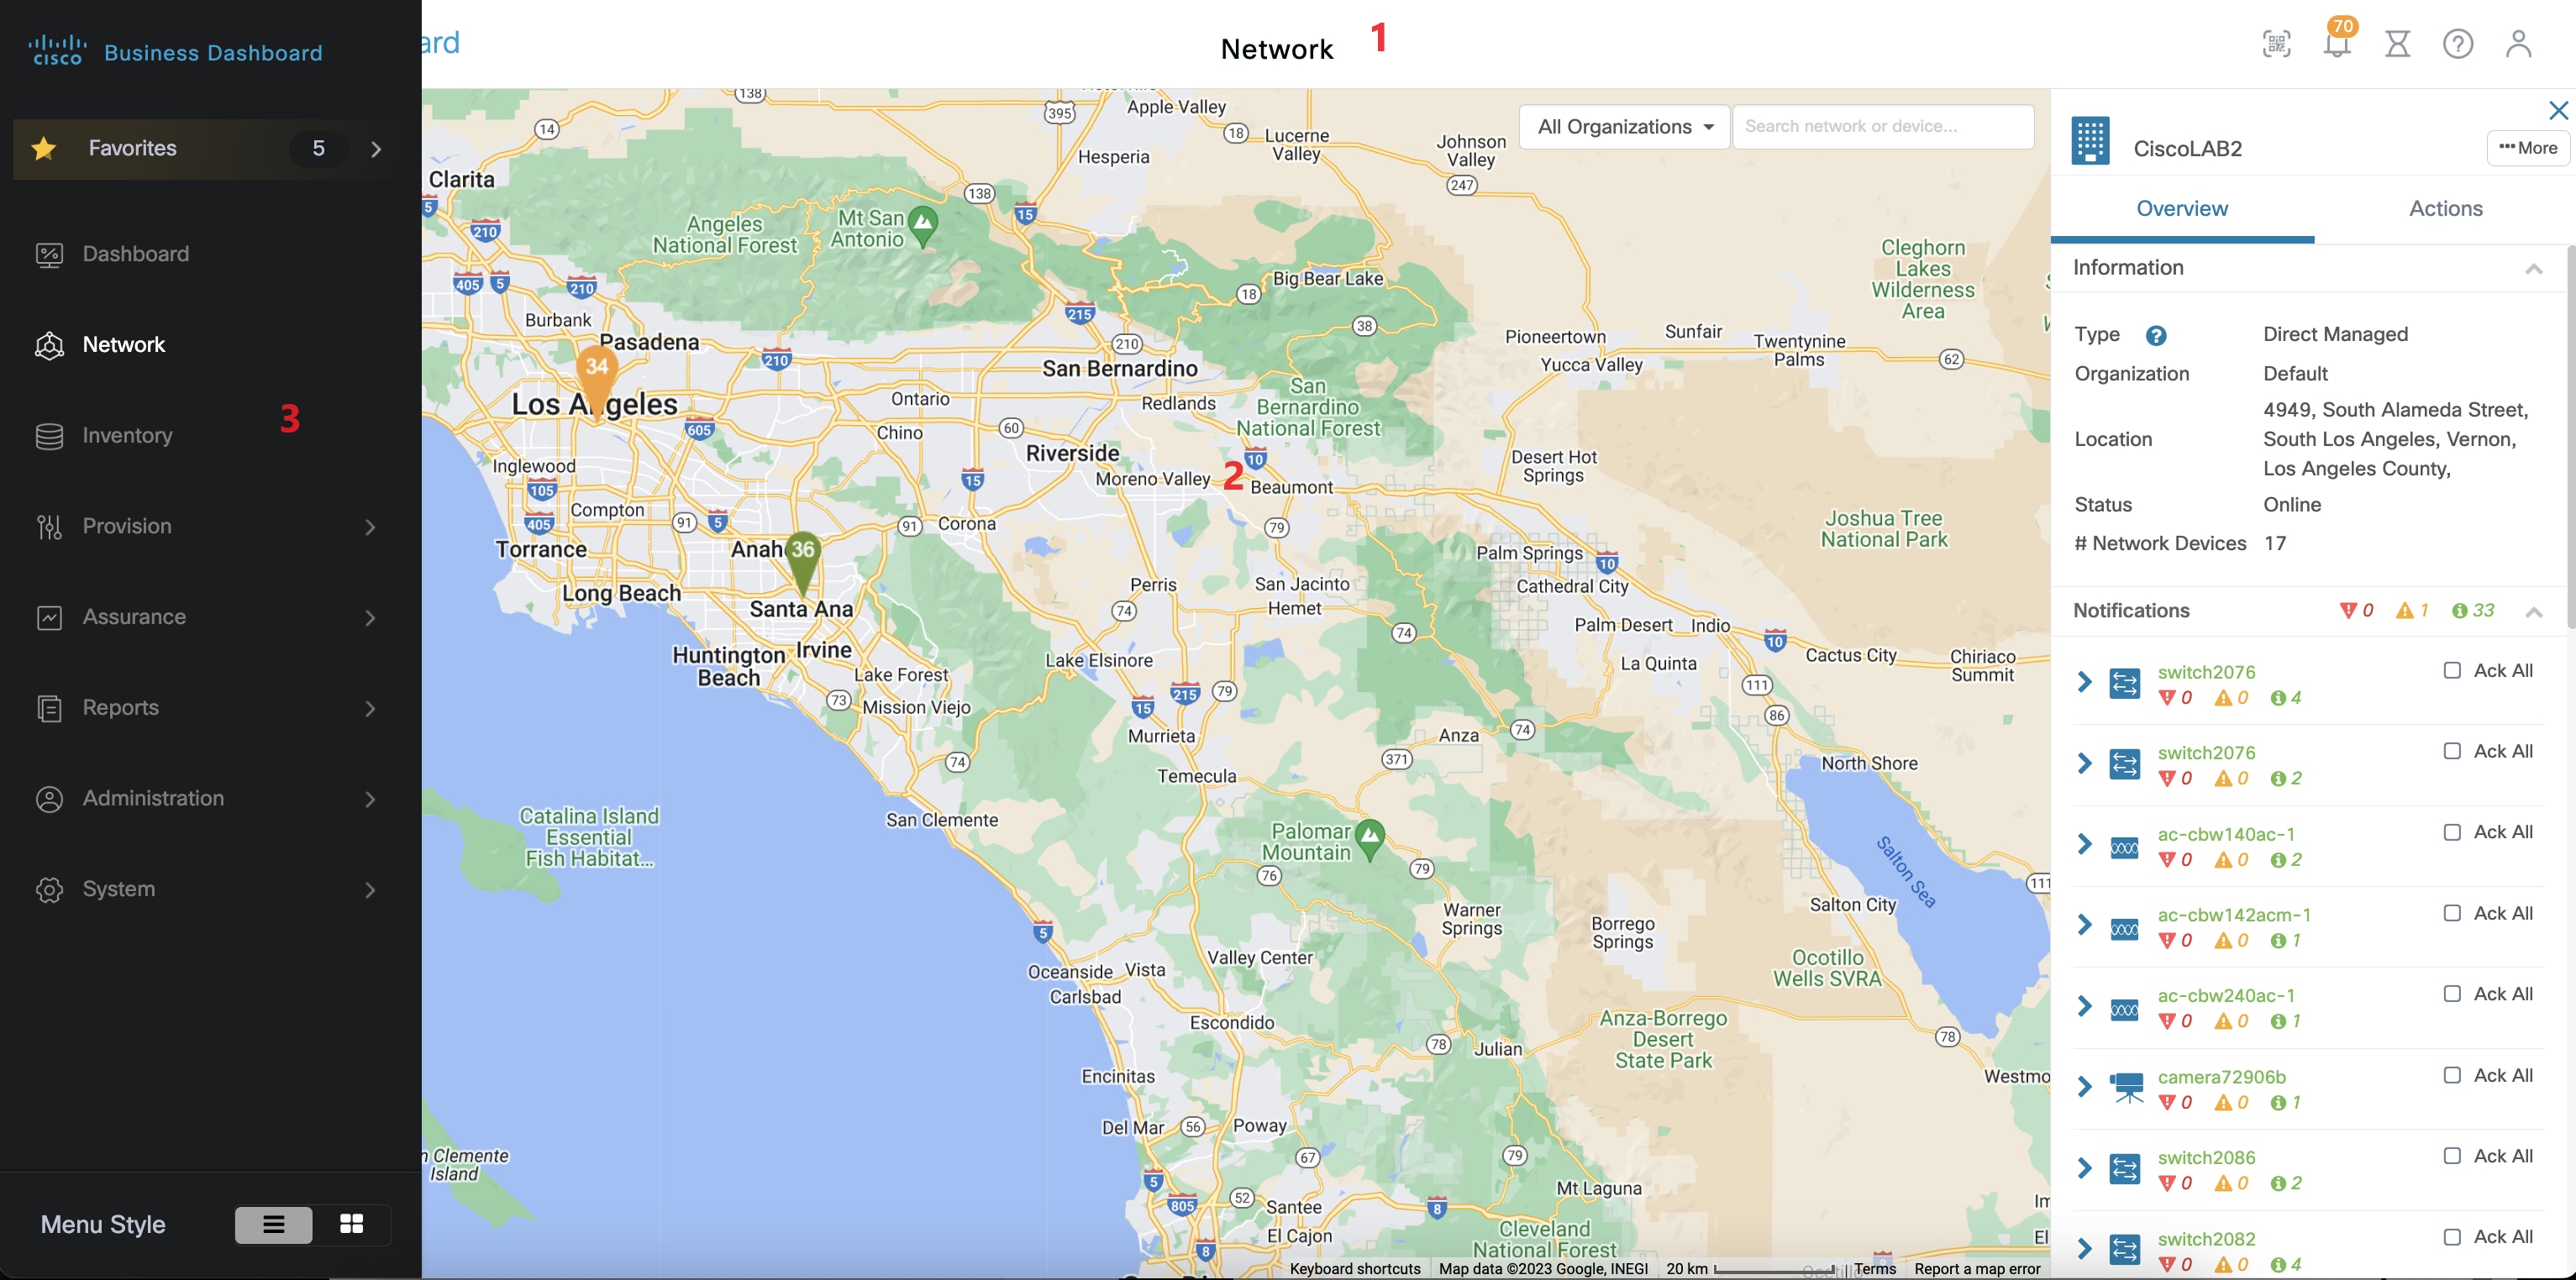
Home window

  1. The Header pane

    The header toolbar contains the following options:

    • A menu button to display the navigation pane

    • Header text

    • A series of icons for functions such as language selection, notifications, task activity, feedback, context sensitive help, and version information.

  2. The Work pane is this is the area where the feature interface is displayed.

    When you click an option in the Navigation pane, its corresponding window opens in this area.

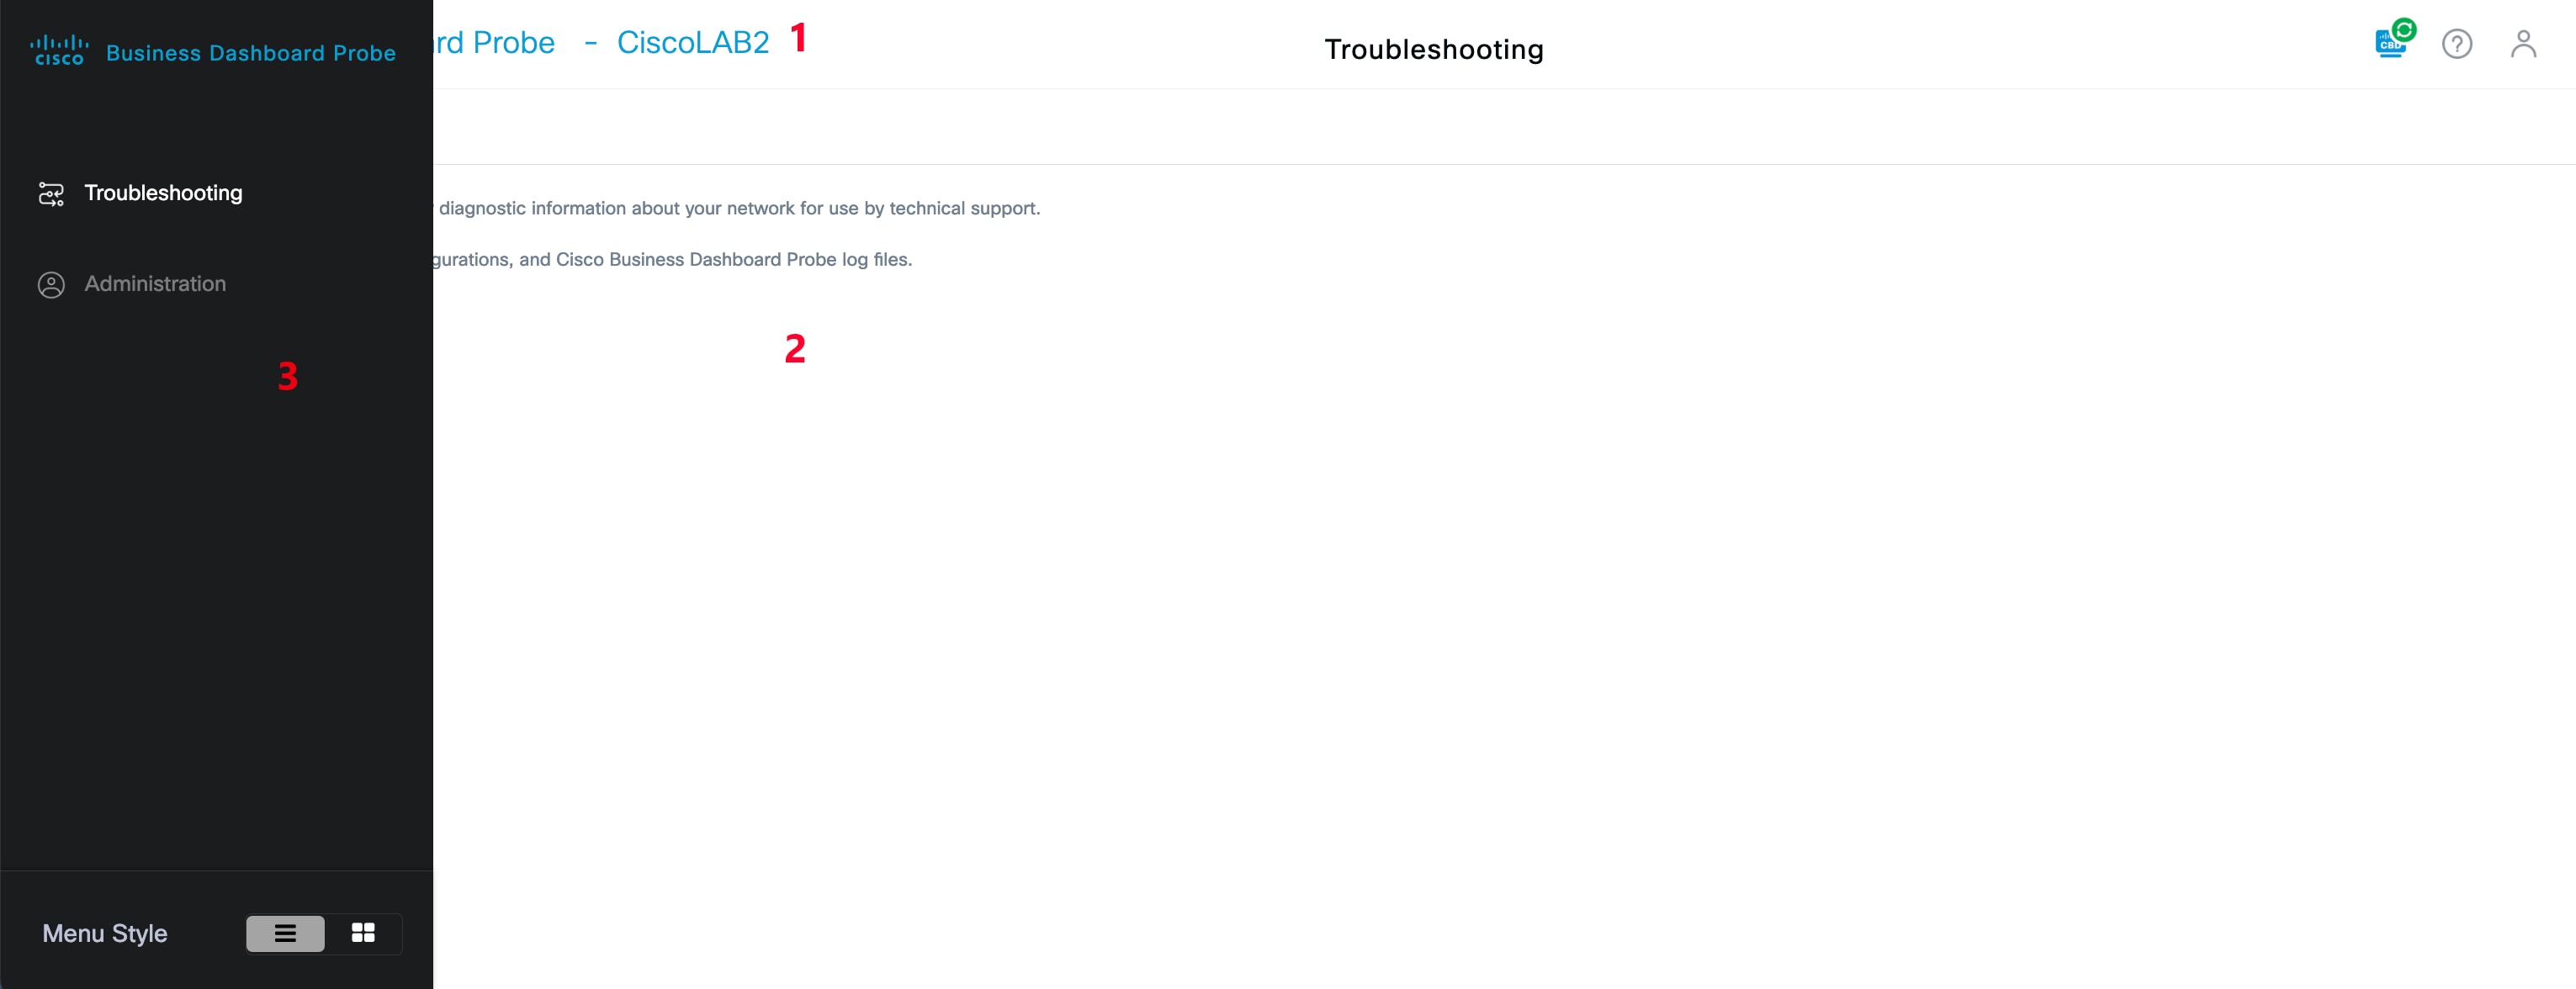
  3. The Navigation pane provides access to the Cisco Business Dashboard features. The navigation pane is displayed when the Menu icon is clicked, and slides away once a selection is made.

Navigation Pane Options

The Navigation pane provides options to access the major Cisco Business Dashboard features.

Icon

Description

The Favorites allows you to bookmark your favorite sections in the Cisco Business Dashboard for easy access.

The Dashboard allows you to monitor the performance of your network over time. The dashboard allows you to monitor traffic levels, connected device counts, and other details about the network.

The Network icon displays an overview of all of the locations in the network as either a map or a list. It also contains different views of each network and the devices discovered. The views include the network topology and a floor-plan view that allows you to track the physical layout of the network.

The Inventory tool provides a list of all devices in the network, allows you to view detailed information about the devices, and to perform actions such as update firmware, backup configurations, and reboot.

The Provision option provides access to Port Management, Network Configuration and Network Plug and Play, and allows you to manage the ports and make configuration changes.

The Assurance page provides access to Monitoring which allows you to monitor and manage your network. And Device Integrity which analyzes the integrity of your devices.

The Reports option will display a number of reports that provide life-cycle information about your network devices, including end of life bulletins, warranty information and service contract details.

The Administration pages allow you to maintain the Cisco Business Dashboard.

The System pages are used to administer the Cisco Business Dashboard application.

Header Toolbar Options

The Header toolbar provides access to other system functions and displays system notifications.

Icon

Description

The currently logged in user is displayed at the top of the navigation bar along with a Language and Logout option. Click on the username to display the user’s profile page.

The Menu button is located on the top left of the header—Click this button to display the navigation pane.

The Notification Center icon displays the number and severity of outstanding notifications in Cisco Business Dashboard. Click this icon to display the Notification Center panel which provides you the option to filter the notification events that are displayed.

The Job Center icon shows the status of currently executing jobs and the history of past jobs. Jobs include any actions performed by Cisco Business Dashboard including both user-initiated jobs and system jobs. Click this icon to display jobs that are pending, in progress, and completed, as well as any jobs that have been scheduled for a later date.

Click the Support Center icon to access the help information, virtual assistant, feedback, API Document and About Cisco Business Dashboard. Click the About Cisco Business Dashboard icon to see information about this version, including the current version. If a new version is available, a green icon with an arrow will be displayed on the Support Center icon and the About icon, and a link to apply the update will be available in the pop-up of About.

Click the AI Assistant icon to open its chat window.

Using the Cisco Business Dashboard Probe GUI

When you log into the Cisco Business Dashboard Probe, the Home page appears.

  1. The Header pane

    The header toolbar contains the following options:

    • A menu button to display the navigation pane

    • Header text

    • A series of icons for functions such as language selection, feedback, context sensitive help, and version information.

    The currently logged in user is displayed at the bottom of the navigation pane.

  2. The Work pane is this is the area where the feature interface is displayed.

    When you click an option in the Navigation pane, its corresponding window opens in this area.

  3. The Navigation pane provides access to the Cisco Business Dashboard Probe features. The navigation pane is displayed when the Menu icon is clicked, and slides away once a selection is made.

Navigation Pane Options

The Navigation pane provides options to access the major Cisco Business Dashboard Probe features.

Icon

Name

Description

Troubleshooting

Click this to see the page that contains diagnostic tools that can help you identify problems with your network may be found under the Troubleshooting section.

Administration

The Administration page allows you to maintain the Cisco Business Dashboard Probe network application.

Header Bar Options

The Header bar provides access to other system functions and displays system notifications.

Icon

Option

Description

Menu button

Located on the top left of the header—Click this button to display the navigation pane.

Dashboard Status

This shows the status of the connection between Cisco Business Dashboard and the Probe. Click on this icon to open the Dashboard GUI.

Support Center

Click the Support Center icon to access the help information, virtual assistant, feedback, and About Cisco Business Dashboard Probe. Click the About Cisco Business Dashboard Probe icon to see information about this version, including the current version. If a new version is available, a green icon with an arrow will be displayed on the Support Center icon and the About icon, and a link to apply the update will be available in the pop-up of About.

Currently Logged In User

The currently logged in user is displayed at the top of the navigation bar along with a Language and Logout option.

Upgrading Cisco Business Dashboard and Probe

From time to time, Cisco releases new versions and updates for Cisco Business Dashboard & Probe and posts them to the Software Center on cisco.com. Cisco Business Dashboard periodically checks the Software Center for updates and if one is found, displays a badge on the icon in the header panel of the UI. You can click to have the Dashboard download and apply the update, or you can choose to download the update yourself and manually apply it.

To set up Dashboard to download and apply the update:

  1. Click About Cisco Business Dashboard to open the pop-up. If any updates are available for the Dashboard or any associated Probes, they will be listed here.

  2. If an update is available for the Dashboard, select the radio button next to that update and click Upgrade.

    The Dashboard will download and apply the update, and you may view the progress at any time on the About Cisco Business Dashboard pop-up. Once the update is complete, the Dashboard application will restart.

To apply a Dashboard update manually:

  1. Download the Cisco Business Dashboard Linux installer file by navigating to https://cisco.com/go/cbd-sw and selecting the Download Software option from the product selection panel at the bottom right.

  2. Copy the installer file to the Dashboard file system.

  3. Execute the installer using the Sudo command sh <filename of installer>. For example sh cisco-business-dashboard-2.2-ubuntu-xenial-amd64.sh. If necessary, enter your password at the sudo prompt. The Dashboard application will restart during this process.

You may also apply updates to all the Probes in the network from the Dashboard. You can update all Probes in parallel, or you can update Probes individually.

To update all Probes in parallel from the Dashboard:

  1. Click About Cisco Business Dashboard to open the pop-up.

    If updates are available for the Dashboard or any of the associated Probes, they will be listed here.


    Note


    If an update is available for the Dashboard, perform that update before upgrading the probes.

    If you try to update the probes first, you will receive an error message.


  2. Select the radio button next to the Probe update, and click Upgrade.

  3. You may view the progress of the update in the user interface of the Probe.

To update an individual Probe from the Dashboard:

  1. If an update is available for the Dashboard, perform that update before upgrading any probes.

    If you try to update a probe before updating the Dashboard, you will receive an error message.

  2. Select Network in the navigation.

  3. Select the network to be updated in either the Map View or the List View.

  4. In the Basic Info panel for the network, select the Actions tab.

  5. Click Upgrade.

    You may view the progress of the update in the job center.


Note


When using an embedded probe running on a network device, you should consult the documentation for that device to perform an update. Some devices do not support the updating of the Probe application independently of the device firmware.


Note


When Cisco Business Dashboard running in Amazon Web Services (AWS) or Microsoft Azure is being upgraded from release 2.4.1(or below) to release 2.5.0(or above), the AWS/Azure security policies should be manually updated to allow incoming UDP traffic to port 1812.


Upgrading Cisco Business Dashboard or Probe Operating System

Cisco Business Dashboard & Probe versions up to and including version 2.7.x run on the Ubuntu Linux distribution version 20.04 (Focal Fossa).

Future versions of Cisco Business Dashboard will be supported with Ubuntu 22.04 (Jammy Jellyfish) only. As a result, upgrading an existing Cisco Business Dashboard or Probe installation beyond the 2.7.x will require an updated operating system.

Due to the extensive changes between Ubuntu 20.04 and 22.04, separate installers are provided for different operating system versions of Cisco Business Dashboard & Probe. It is not possible to perform an in-place upgrade of the operating system on an existing dashboard or probe installation. The following sections address the recommended approaches for updating the operating system for the dashboard and probe.

Upgrading the Cisco Business Dashboard Operating System

To upgrade an existing Cisco Business Dashboard to a new version of the operating system, use the following process:

  1. Make a backup of the existing Cisco Business Dashboard application.

    1. Log on to the dashboard GUI and from the Navigation pane open System > Backup.

    2. Enter a password to protect the backup in the fields on the screen, and click the Backup & Download button.

  2. Create a new instance of Cisco Business Dashboard running on the updated operating system.

    • If the existing dashboard is running in virtual machine or in a cloud provider such as Amazon Web Services, you should shut down the existing instance, and then create a new instance using the prebuilt Cisco Business Dashboard images.

    • If the existing dashboard is installed directly on an Ubuntu Linux installation running on a server, then you should re-image the server with the updated Ubuntu version, and then install Cisco Business Dashboard.

    For more information on installing Cisco Business Dashboard, refer the installation guides found at https://cisco.com/go/cbd-docs.

  3. Log on to the new instance of Cisco Business Dashboard and restore the backup you created in step 1.

    • Navigate to System > Restore.

    • Enter the password used to protect the backup in the field provided.

    • Click the Upload & Restore button to upload the backup file.

  4. Once the restore process has completed and you have confirmed that the new instance is running correctly, delete the old instance.

    For more information on the backup and restore process, see Backing Up and Restoring the Dashboard Configuration later in this guide.


Note


A Cisco Business Dashboard backup file can be restored to a system running the same version as the system you just backed up, or up to one newer minor release. For example, a backup taken from a system running version 2.2.0 may be restored to a system running 2.3.1, but not to a system running 2.4.0.


Note


When Cisco Business Dashboard is upgraded from release 2.4.1(or below) to release 2.5.0(or above) while running in Amazon Web Services (AWS) or Microsoft Azure, the security policies should be updated to allow incoming UDP traffic to port 1812.


Upgrading the Cisco Business Dashboard Probe Operating System

The Cisco Business Dashboard Probe stores very little configuration data and no long-term statistics. As a result, when upgrading the operating system hosting a probe, Cisco recommends that you remove the existing probe instance and install a new probe instance running on the new operating system. The new probe is then associated with Cisco Business Dashboard, and the existing network record selected during the association process.

For more information on installing the Cisco Business Dashboard Probe software, refer the installation guides located at Cisco Business Dashboard Installation Documents. For more information on associating a probe with Cisco Business Dashboard, refer to the Quick Start Guide located at Cisco Business Quick Start Guide.


Note


When using an embedded probe or direct device management, there is no requirement to upgrade the probe or agent separately from the device operating system. The probe/agent is included in the device firmware and is updated automatically when upgrading the device.