About Network
Access the Network page to see an overview of the location and all the devices in your network. You can also note other networks and devices nearby. You can select the network and then see more details about that network and devices and how they are all working.
The Network page provides an overview of the network as either a geographic map showing the location and status of each site in the network, or as a list of all sites.
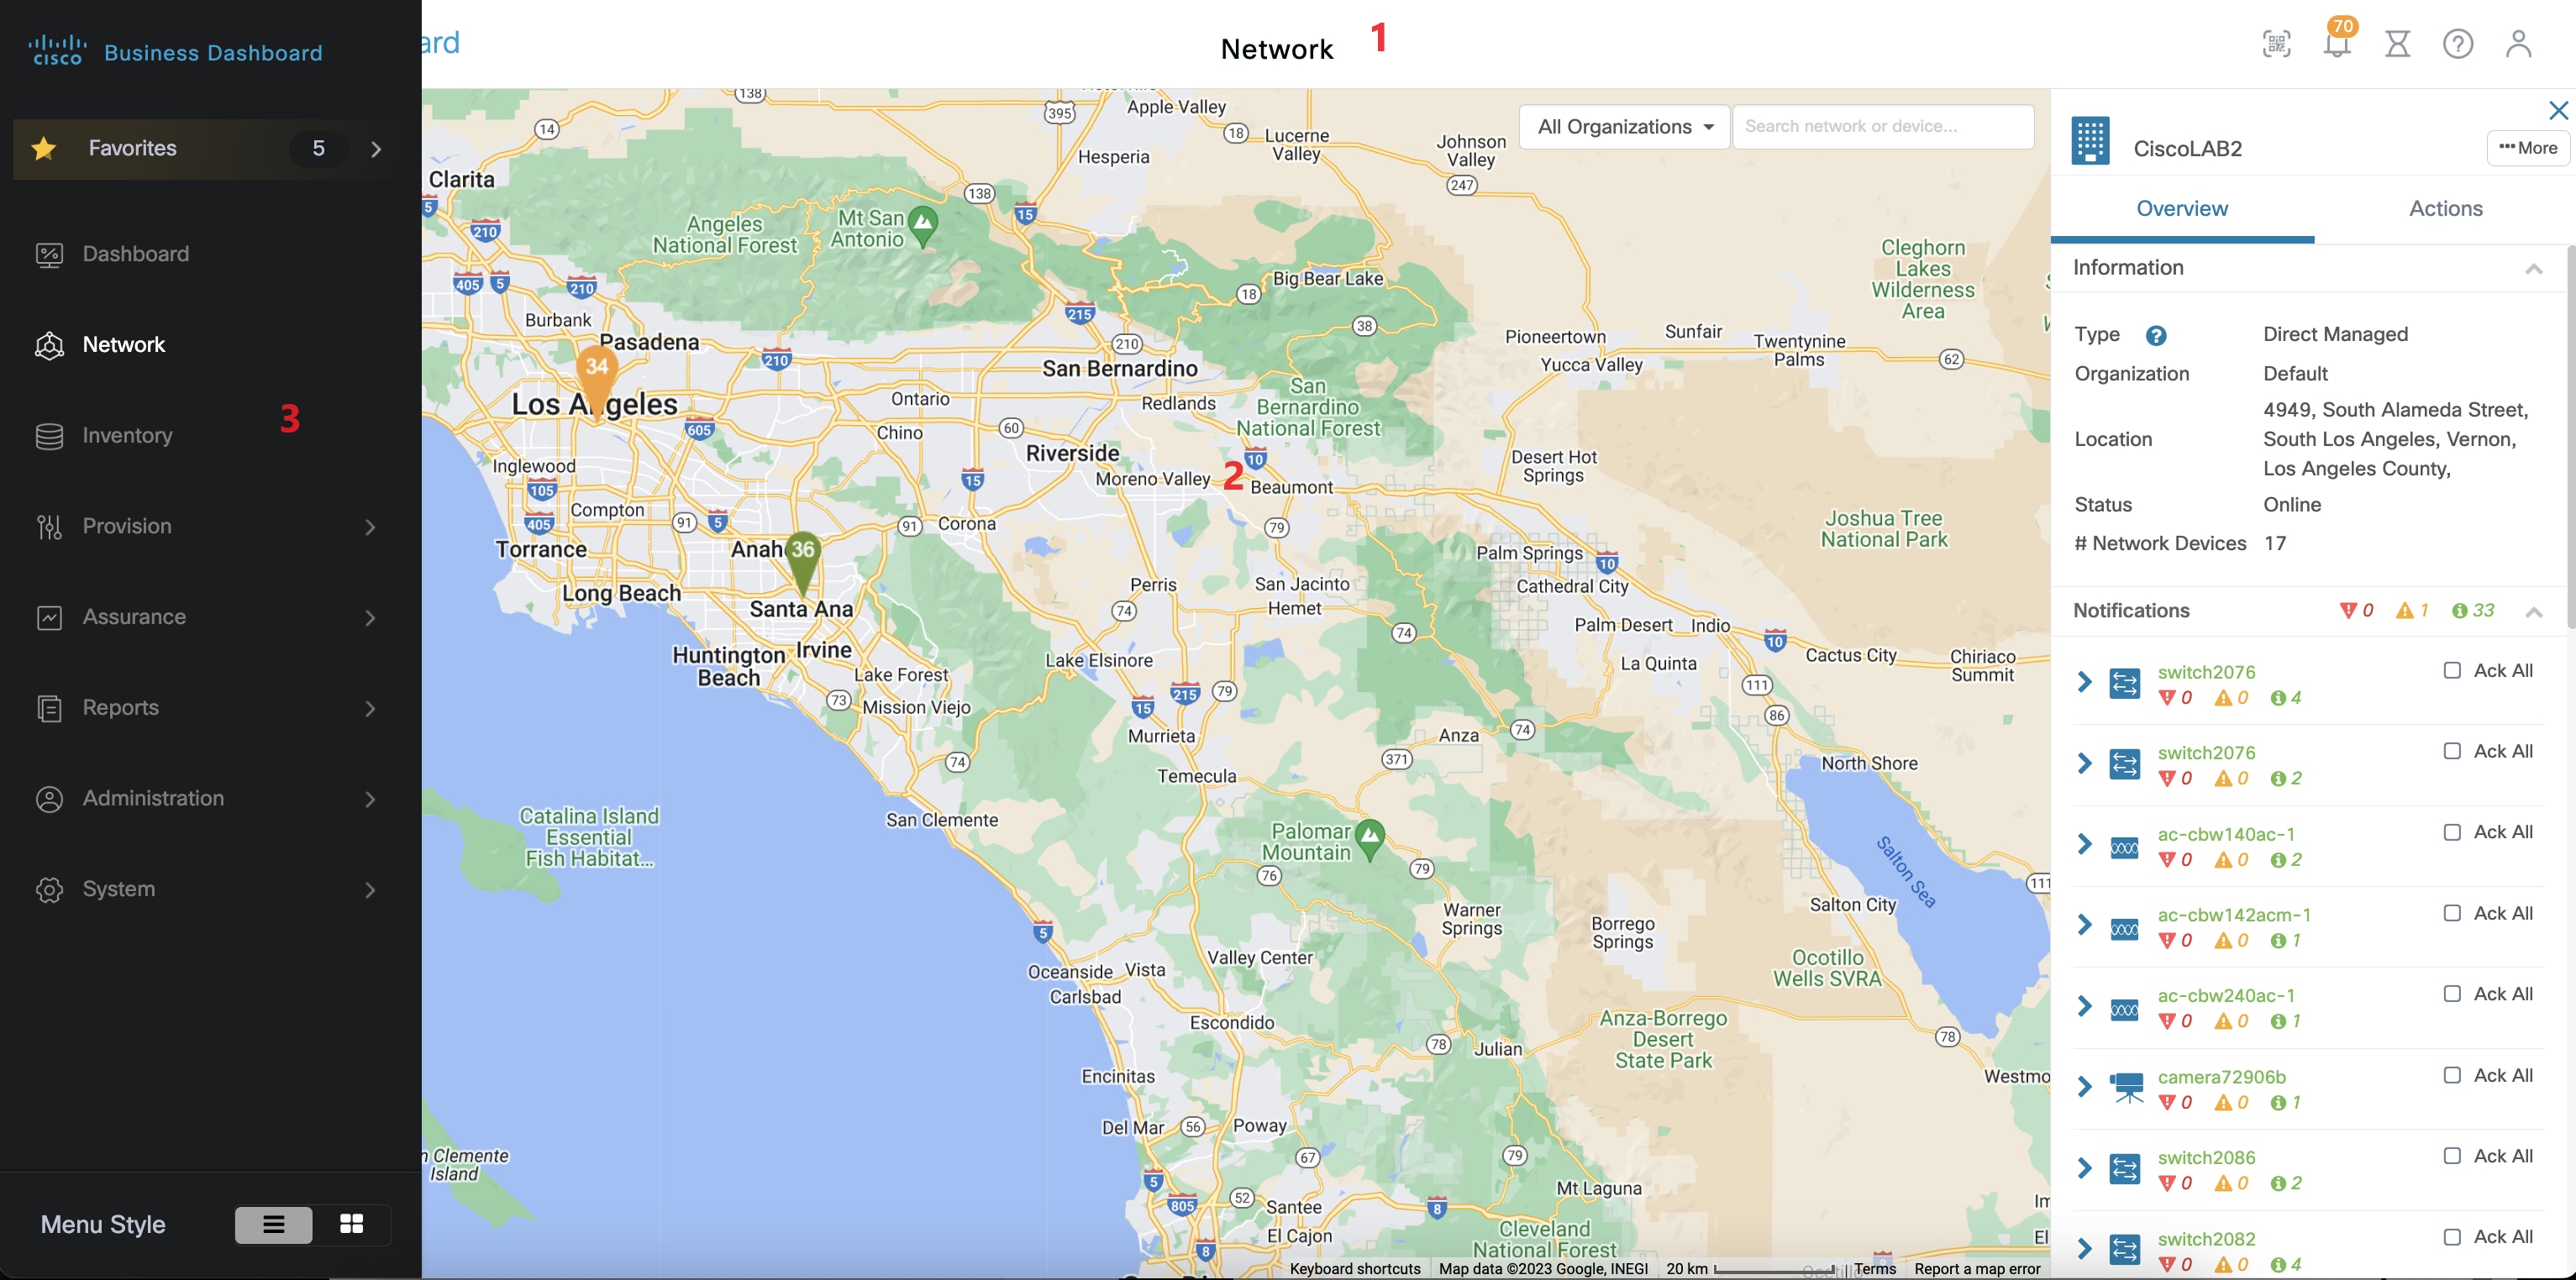
In the Map View, the number displayed on each network icon indicates the number of outstanding notifications that exist for that site, and the color of the icon indicates the highest severity level outstanding.
 Note |
When two or more network icons are positioned too closely on the map to be easily distinguished, they will be replaced with a single cluster icon. Click on the cluster icon to automatically zoom the map to a level where the networks in that cluster can be separated. |
The Network Map offers the following controls:
You can also click and drag anywhere in the map area to move the map in the Work pane.
|
Control Name |
Control Action |
|---|---|
|
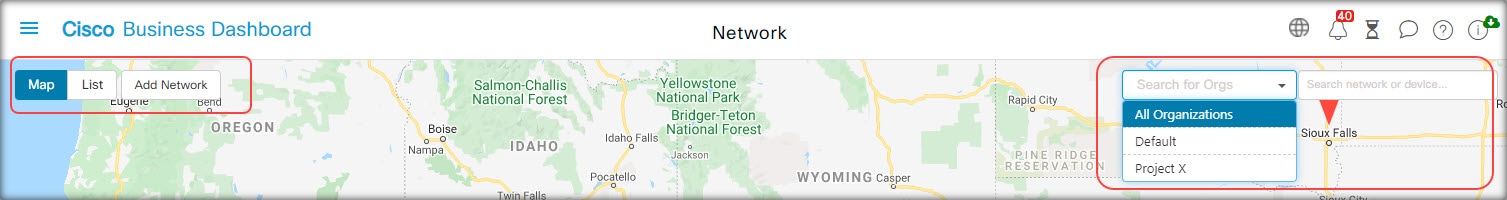
Map/List selection |
Use this control to chose to view networks on a map or in a table. |
|
Add Network button |
Use this button to create a new network record prior to deployment. |
|
Organization drop-down |
Select an individual organization from the drop-down list to limit the networks displayed. |
|
Search box |
Enter all or part of the name, address or IP address of a network to locate that network on the map. Alternatively, you can enter all or part of the name, IP address, serial number or MAC address of a device to identify the network where the device is located. As you type, a list of matches is displayed.
|
|
Zoom controls |
Use these controls to zoom in and out of the map. Click the (✚) plus sign to zoom in and the (━) minus sign to zoom out. |
|
Fit-to-view button |
This button automatically zooms out the map so that all the network markers can be displayed. |
In the List View, the same information can be seen in the last column of the table. To see more information about a network, click on the network icon or on the table row for that site.
In the List View, the following controls are available:
|
Control Name |
Control Action |
|---|---|
|
Map/List selection |
Use this control to chose to view networks on a map or in a table. |
|
Column Select icon |
This icon allows you to select the columns to be displayed. You can click on the column headings to sort the table. |
|
Add Network |
Click the (✚) plus sign to add a new network prior to deploying a probe for that network. |
|
Refresh |
Click the refresh button to update the table and display the most current information. |
|
Organization drop-down |
Select an individual organization from the drop-down list to limit the networks that are displayed. |
|
Search box |
Enter all or part of the name, address or IP address of a network to list only matching networks in the table. |
Click on a network icon or row to bring up the Basic Info panel for that network. The Basic Info panel contains the following information:
-
The name of the network.
-
The organization the network belongs to.
-
The physical address of the network.
-
The Probe IP address for the network and the IP subnet(s) discovered at the network.
-
The software version of the Probe.
-
The connection status.
-
The number of managed devices in this network.
-
A list of all current, unacknowledged notifications for this network.
-
A list of events that occurred for this network in the previous 24 hours.
You can also carry out the following actions for a network from the Basic Info panel:
-
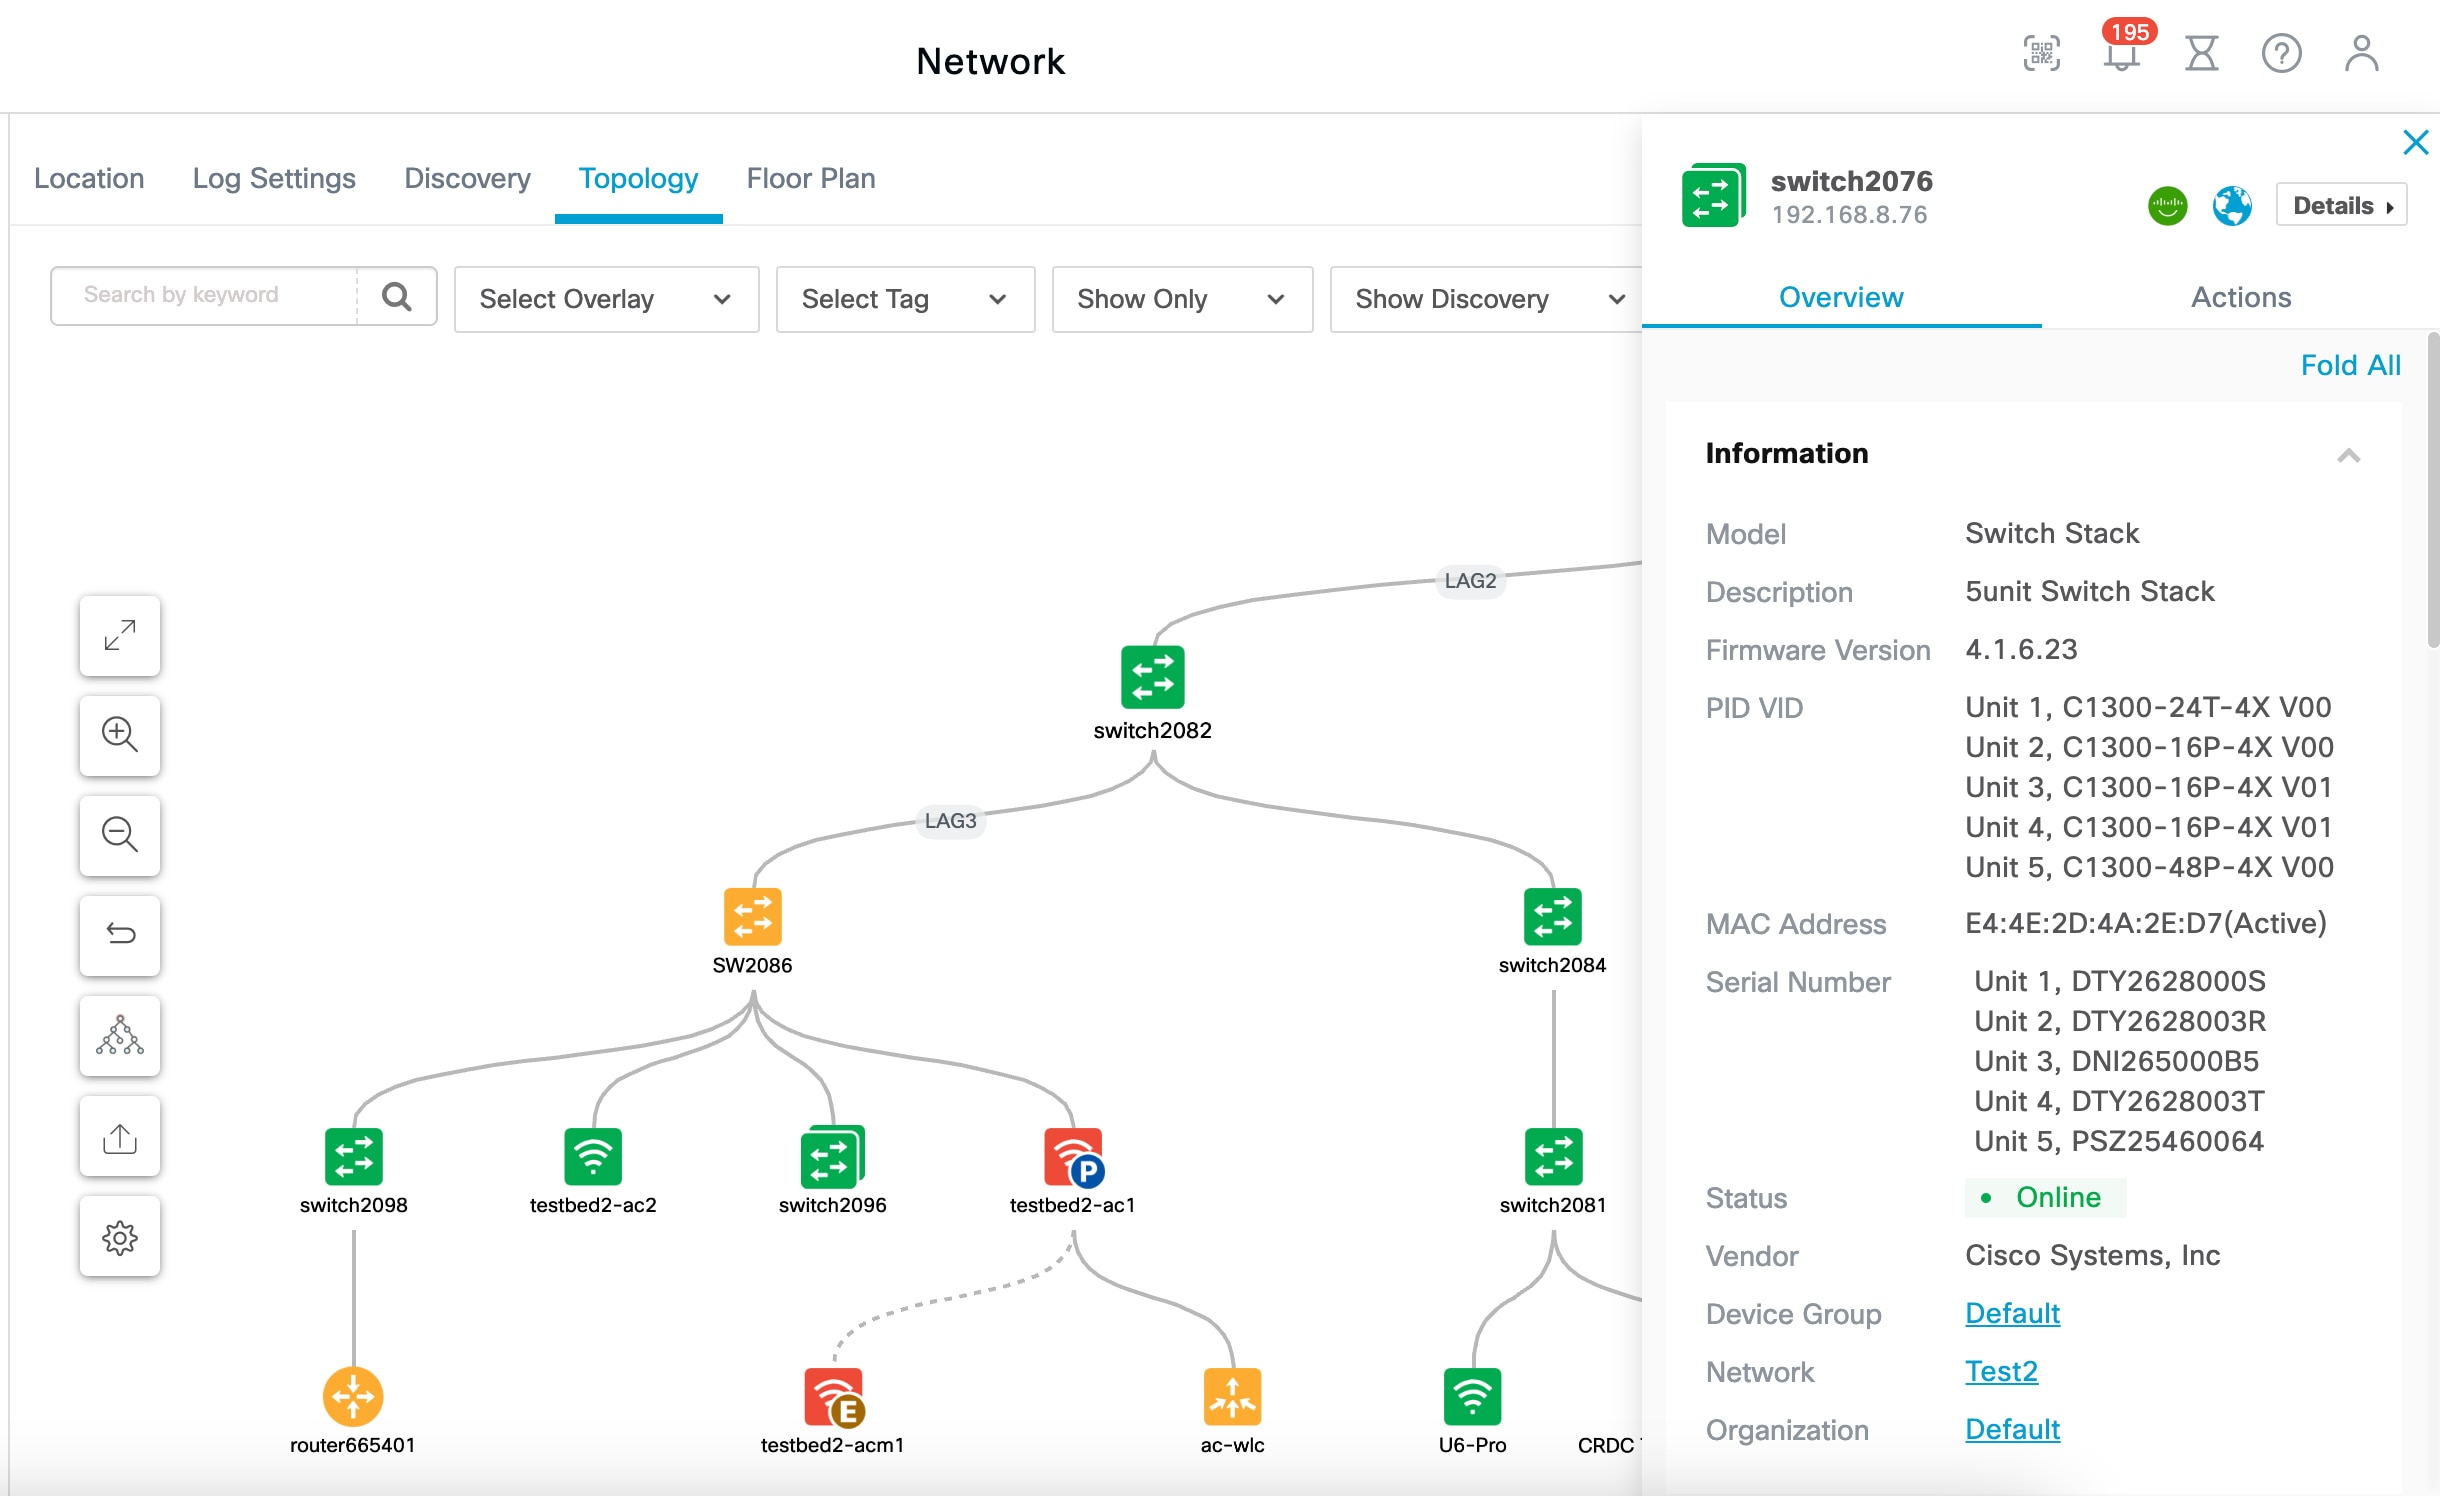
Click Details to view a detailed information about the network including the network topology and floor plans.
-
See the section "About Network Detail" below for more information on the Network Detail panel.
-
Click on the Actions tab to display additional actions available for the network.
-
Click Remove to delete this network and all associated data from the dashboard.
-
Click Upgrade to update the Probe software at this network.
-
Click Show Tech to generate a Network Show Tech archive for this network.
-
Other actions that can be performed on all devices in the network that support that action. For example, you can backup all network device configurations with a single click. Network actions may optionally be scheduled to take place at a later time. Available network actions which can be performed on all network devices are as follows:
-
Backup Network Config
-
Upgrade All Devices Firmware
-
Save Network Running Config
-
Delete Offline Devices
-
-


 Feedback