Troubleshooting

This chapter contains the following sections:

Capturing Network Diagnostic Information

The Network Show Tech feature allows you to easily capture diagnostic information for your network in a form which you can analyze later or send to a support engineer. A Network Show Tech can be generated from the Dashboard UI or directly from the Probe UI in the event you are troubleshooting problems with the Dashboard-Probe connection. To capture a Network Show Tech, follow the steps below.

  1. Navigate to Network and click the check box to select the Network that you want to collect diagnostic information.

  2. Select the Actions tab and click Show Tech.

    Alternatively, log on to the Probe UI and navigate to Troubleshooting > Network Show Tech.

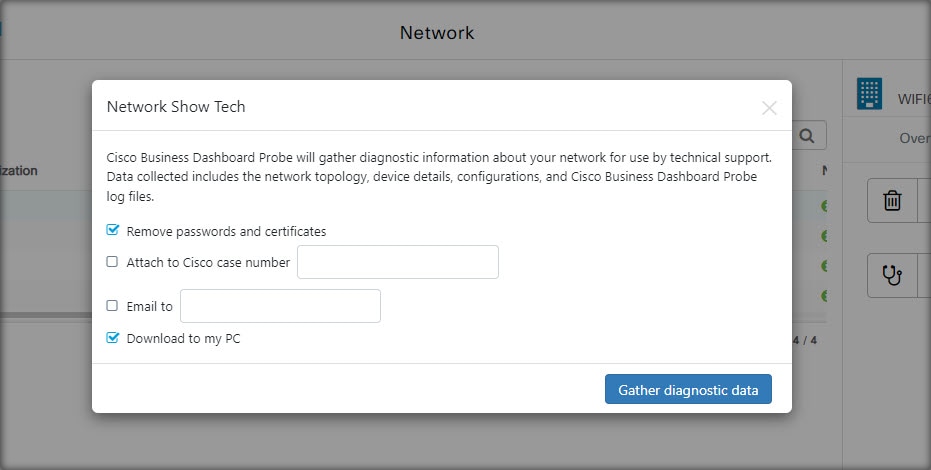
  3. Use the check boxes to control whether or not to exclude passwords and certificates from device configurations, and where the diagnostic information should be sent. The following options are available:

    • Attach the diagnostic information to an existing Cisco support case. To do this, enter the case number in the field provided.

    • Send the diagnostic information using email. Enter a comma-separated list of email addresses in the field provided.

    • Download the diagnostic information to your PC.

    If you are generating the Network Show Tech from the Probe, you do not have the options to email or attach to a support case. You must download the diagnostic information to your PC.

  4. Click Gather diagnostic data.


The diagnostic information is delivered as a zip file, and includes a basic web page to help navigate the collected data. To access the data, follow the steps below.

  1. Unzip the diagnostic information file to your PC.

  2. Use a web browser to open the index.html file located in the directory.

Managing Probe Log Settings

Log Settings for a Probe can be managed from the Dashboard UI or directly from the Probe UI in the event you are troubleshooting problems with the Dashboard-Probe connection. Log settings control what information the Probe will retain in its log files.

This information is important to support engineers diagnosing problems with Cisco Business Dashboard.

To change the log settings for a given network follow the steps below.

  1. Open the Network page and click the check box next to the network that you want to change the settings.

  2. Click the Settings button at the top of the Network overview panel.

  3. Select the Log Settings tab.

    Alternatively, log on to the Probe UI and navigate to Administration > Log Settings.

The available settings include the following parameters:

Table 1. Log Settings

Field

Description

Log Level

The level of detail that should be logged.

  • Error—Error level messages only

  • Warning—Warnings and errors

  • Info(default)—Informational messages and above

  • Debug—all messages including low level debugging messages

Log Module

The module(s) for which messages should be logged.

  • All (default)—All modules

  • Call-home Agent—Communication between the Probe and Dashboard

  • Discovery—Device discovery events and topology discovery

  • Northbound —Communication between the Dashboard and the Probe

  • Services—Message translation between northbound and southbound

  • Southbound—Low level communication between the Probe and devices

  • System—Core system process not covered by any other module

You can select multiple modules as needed.

The Probe log files are included in the Network Show Tech content. For more details on Network Show Tech option, see Capturing Network Diagnostic Information section.