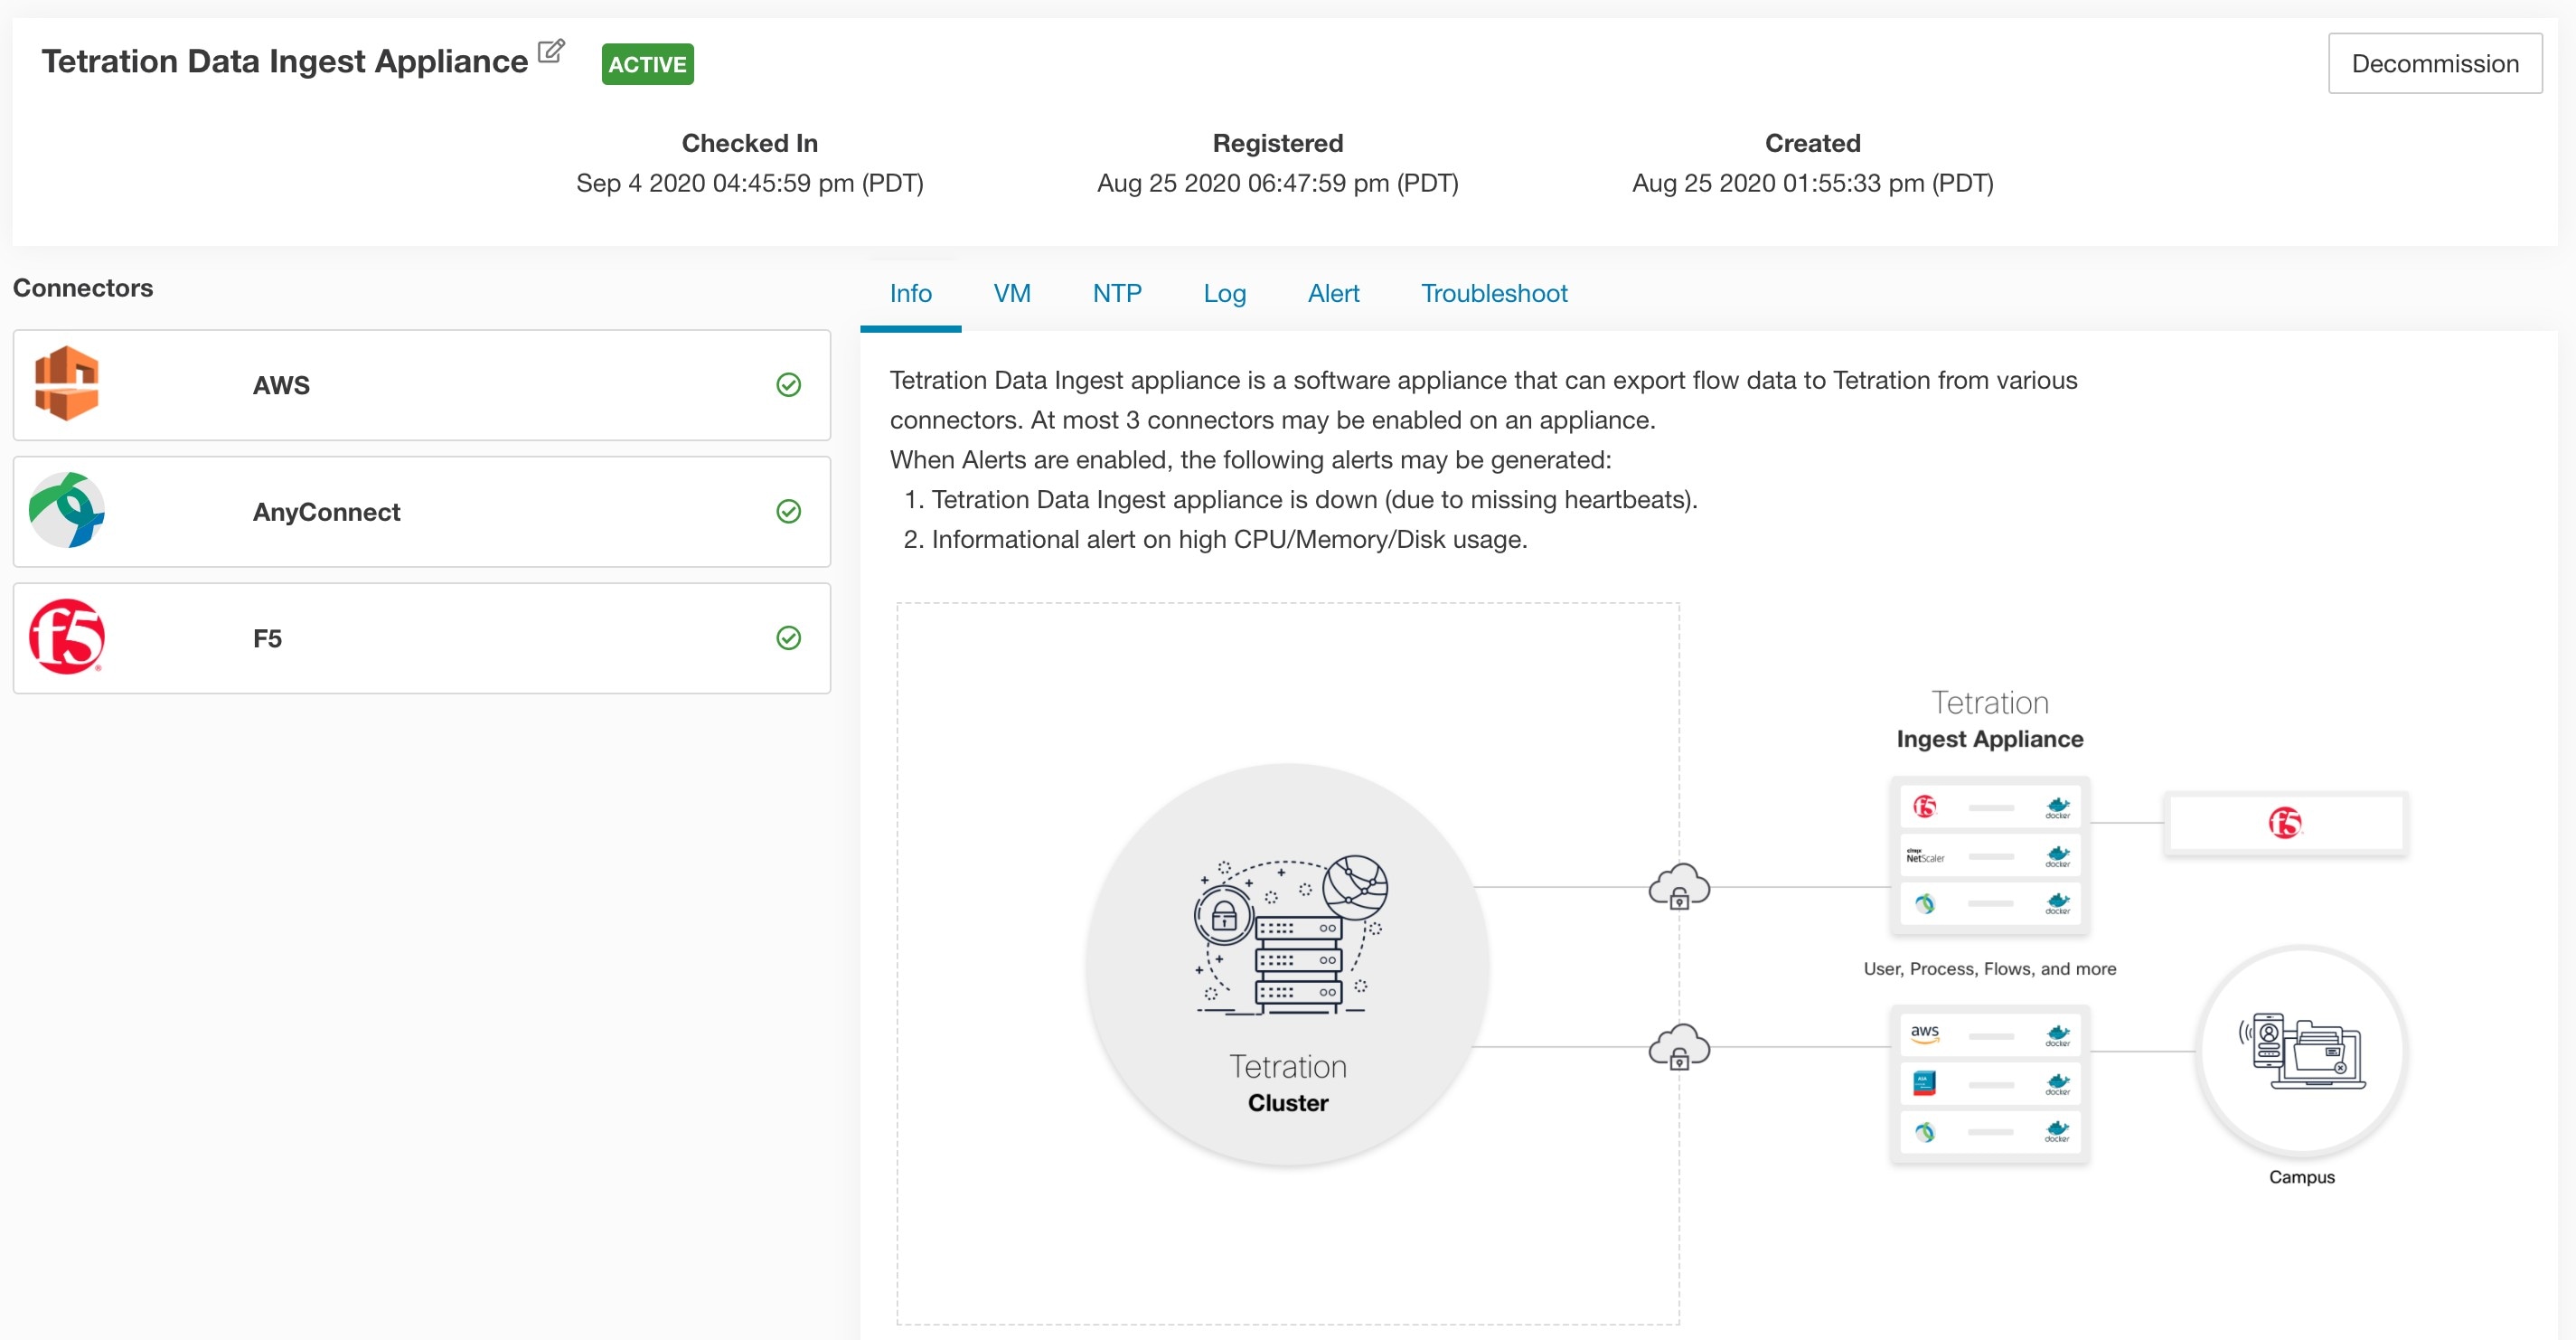
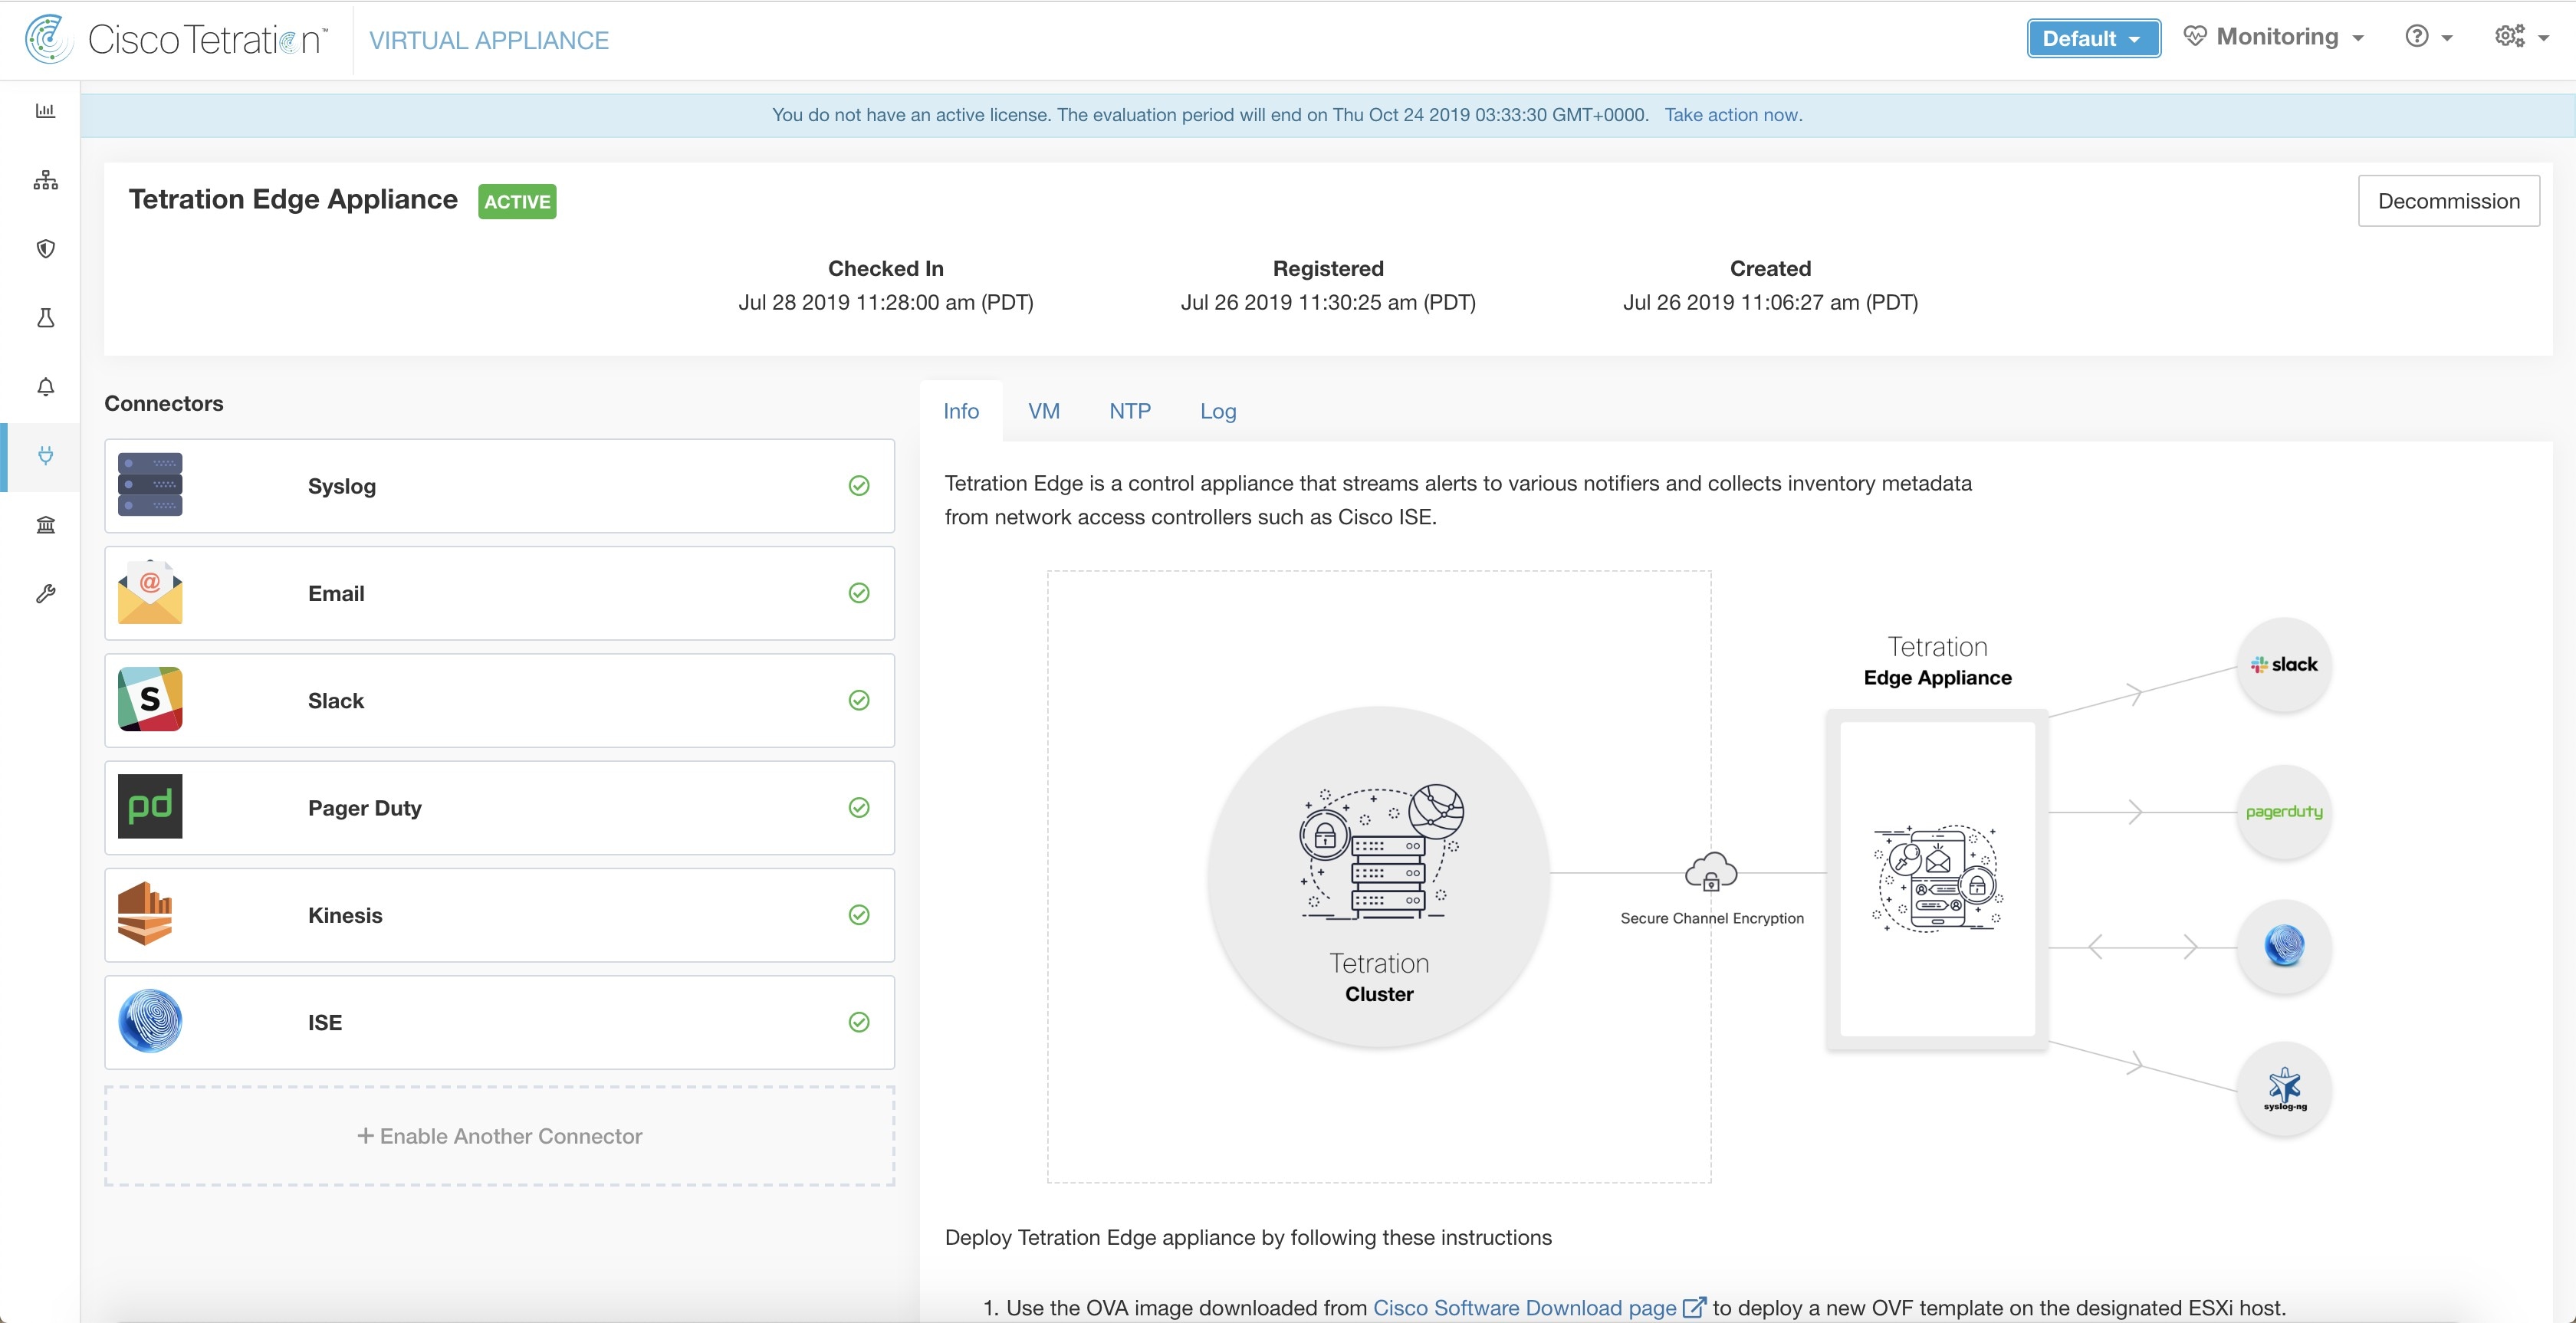
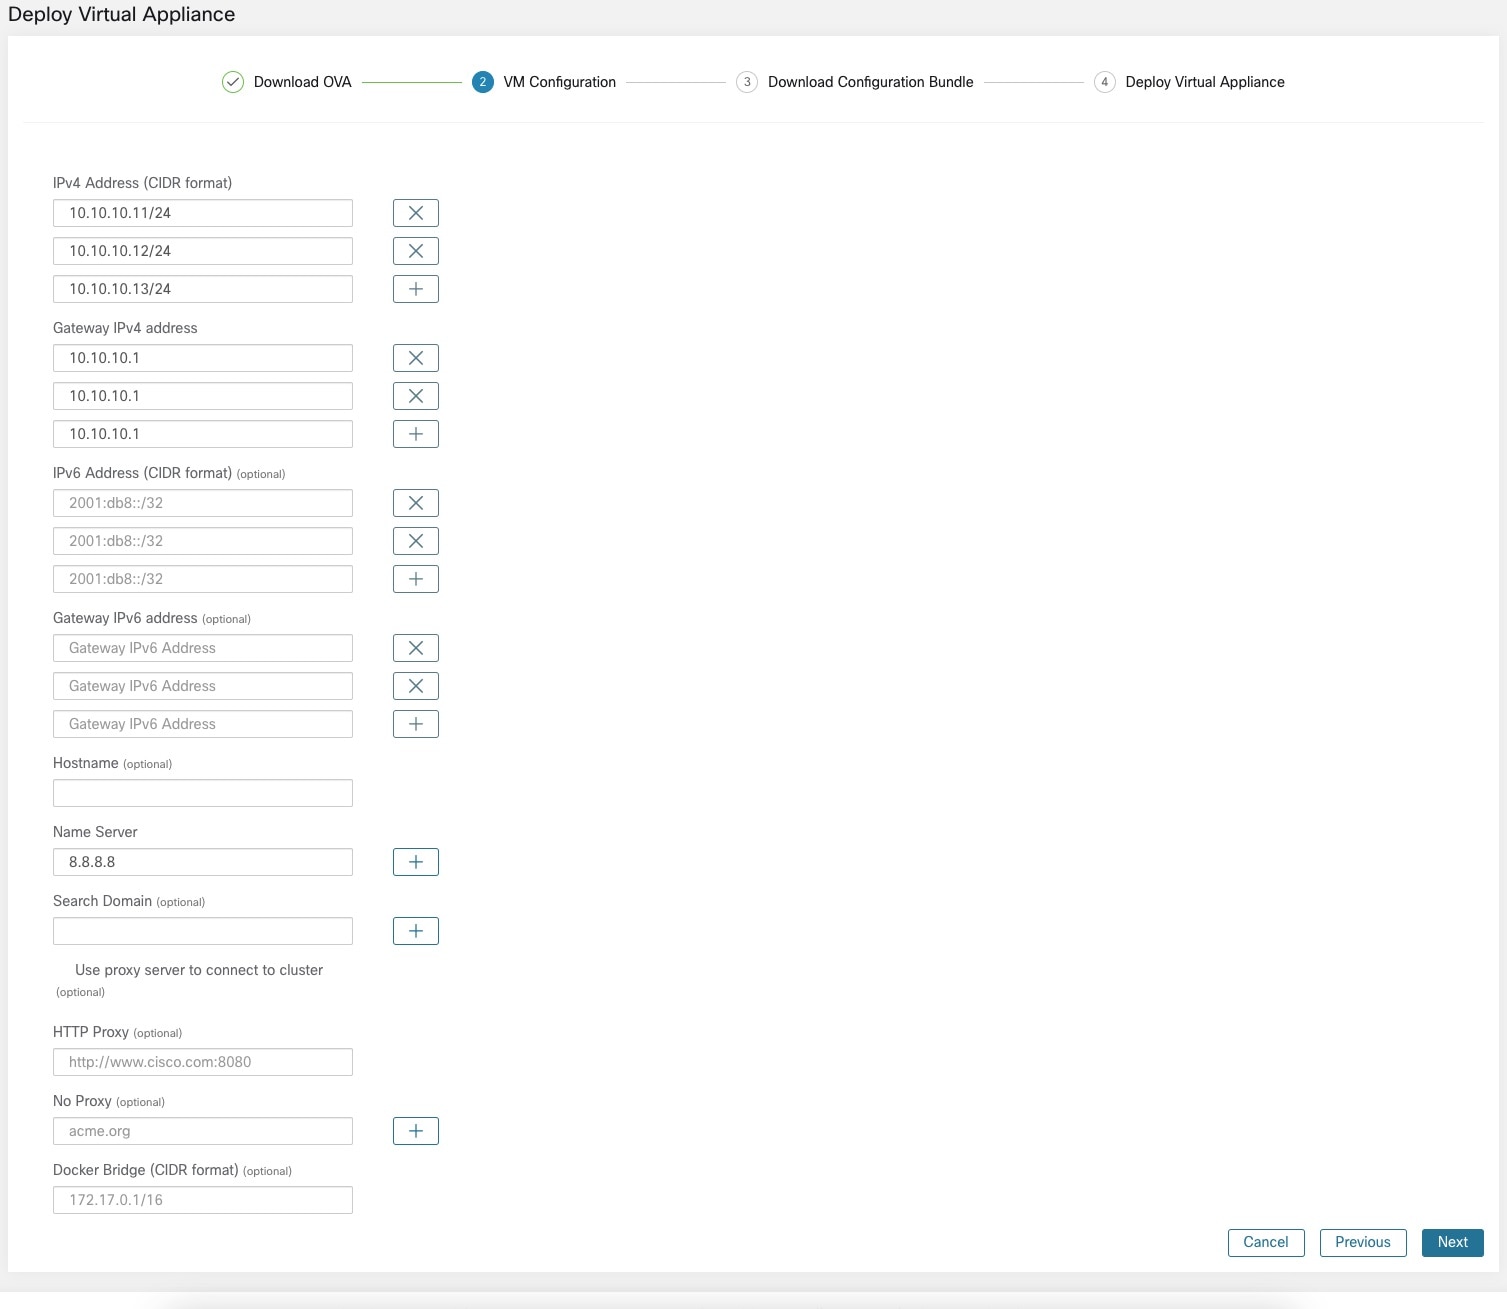
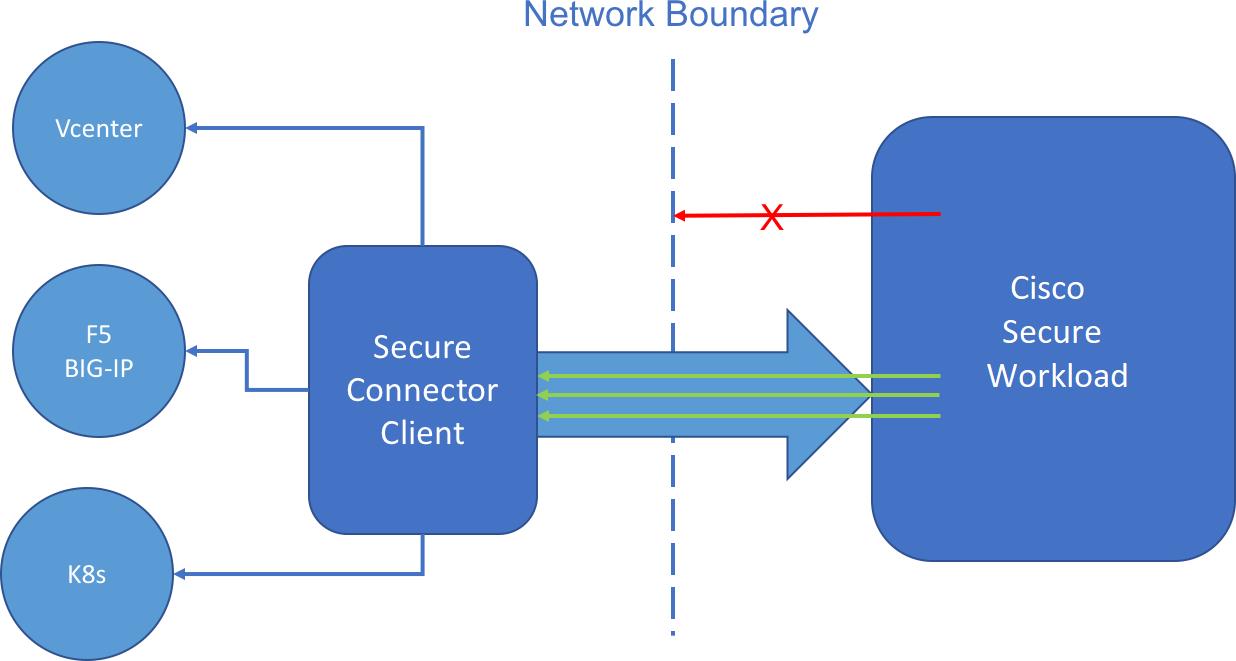
Configure and Manage Connectors for Secure Workload

Connectors enable Secure Workload to integrate with external resources, such as network switches, routers, firewalls, and endpoint management systems, to collect telemetry data, ingest flow observations, and enrich inventory and endpoint context.


Attention


Due to recent GUI updates, some of the images or screenshots used in the user guide may not fully reflect the current design of the product. We recommend using this guide in conjunction with the latest version of the software for the most accurate visual reference.


Table 1. Feature History

Feature Name

Release

Feature Description

Where to Find

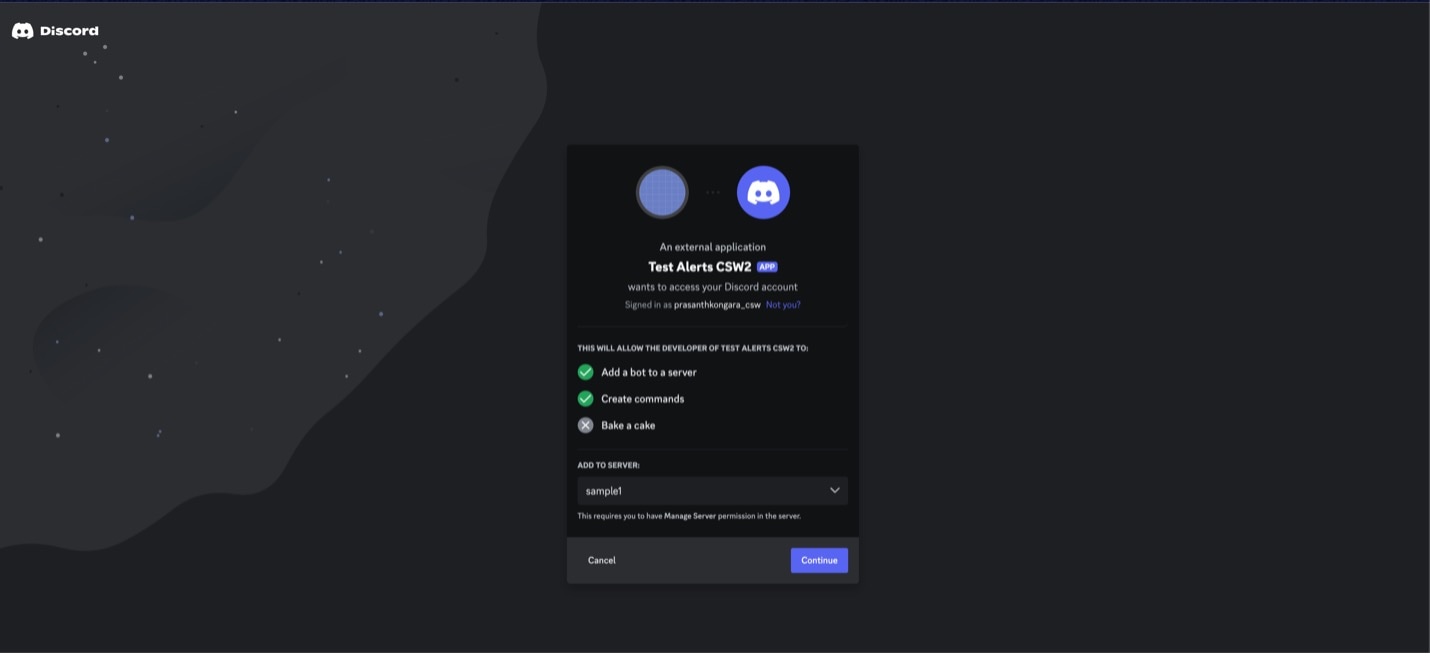
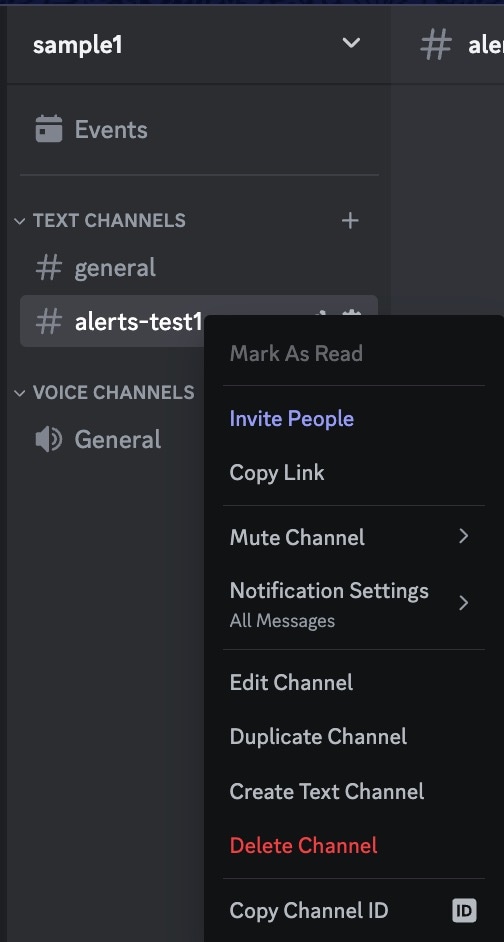
Webex and Discord Connectors

3.10

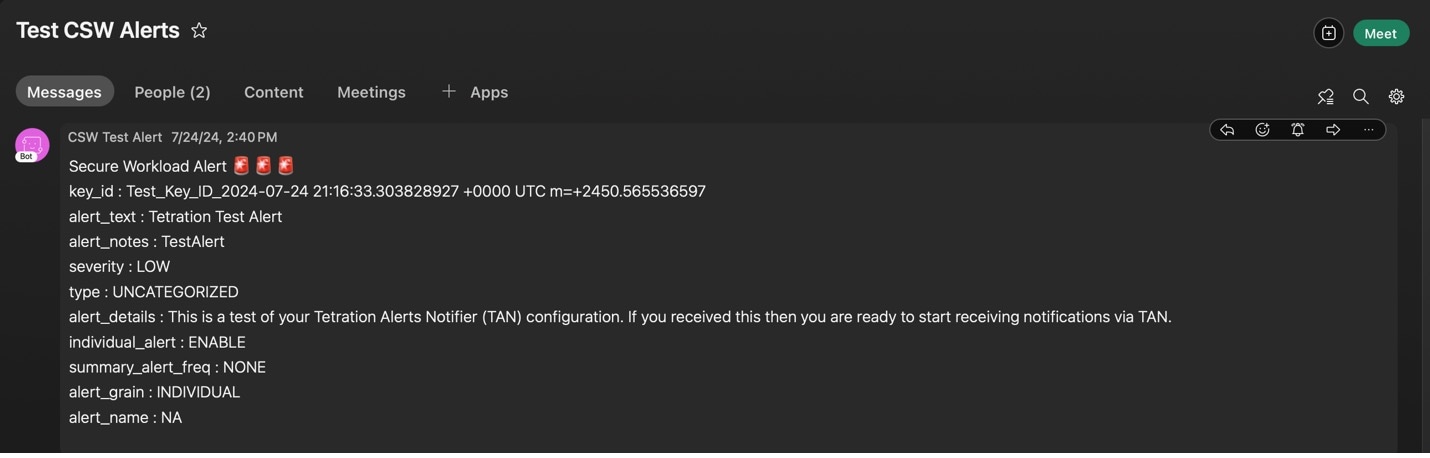
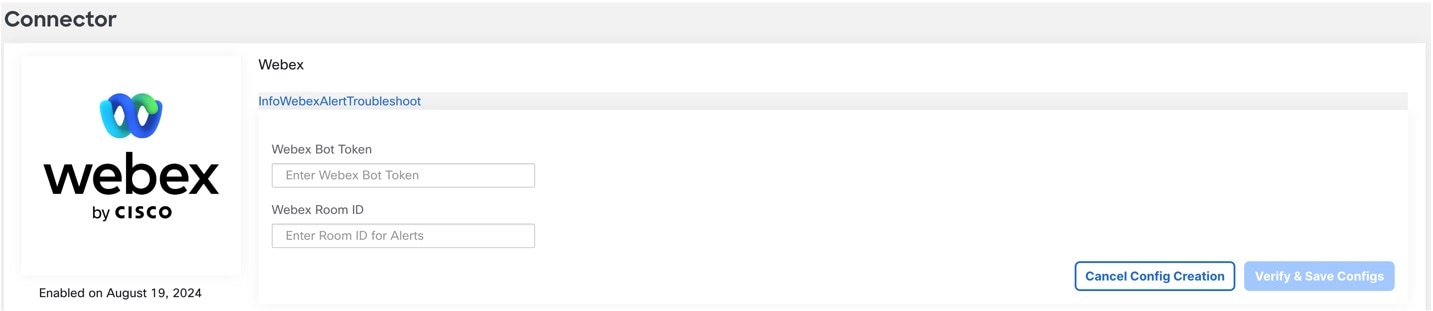
Webex rooms and Discord channels are new connectors to our Alerts framework in Cisco Secure Workload.

Cisco Secure Workload can now send alerts to Webex rooms and Discord channels.
Webex Connectors and Discord Connector

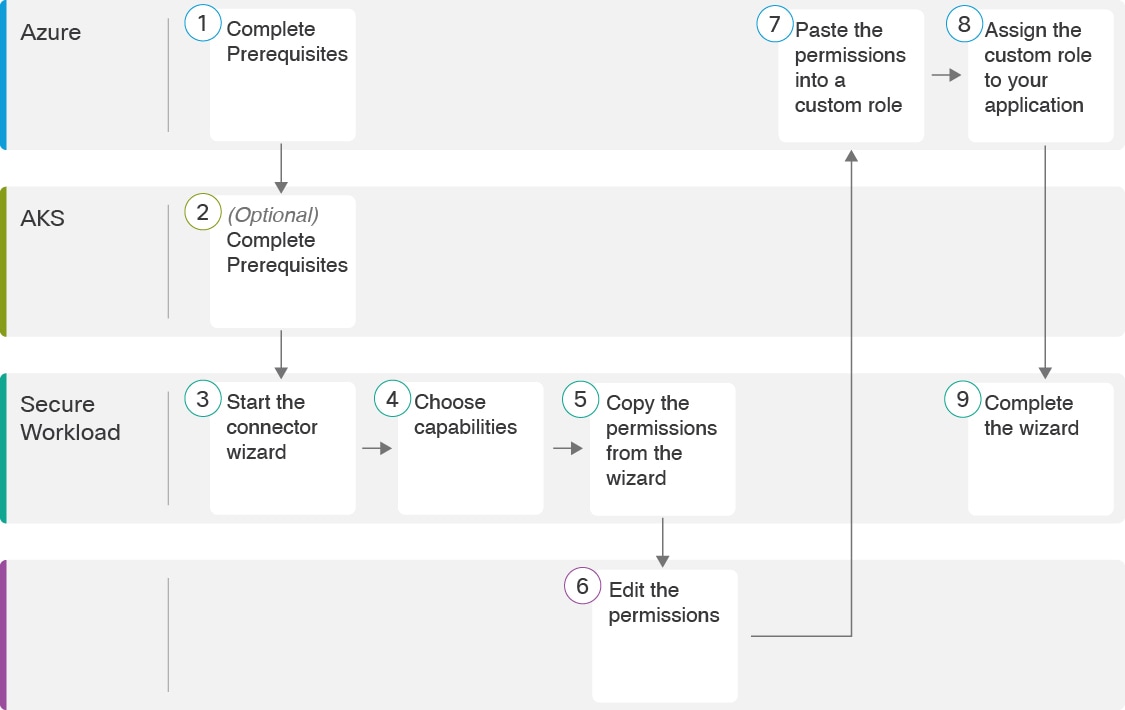
Improved Azure and GCP Connector Workflows

3.10

The workflow of Azure and GCP connectors are improved for ease-of-use and simplicity.

Identity Connector for OpenLDAP

3.9

The Identity Connector serves as a centralized hub for integrating with identity stores, allowing you to seamlessly pull users, user groups, and other attributes from the OpenLDAP server.

Identity Connectors

What are Connectors

A connector is a component of Cisco Secure Workload that

  • facilitates the integration with different resources,

  • enables Secure Workload to gather data from these resources for various purposes.

To configure and work with connectors, choose Manage > Workloads > Connectors from the navigation pane.


Note


Connectors require a virtual appliance. For more information, see Virtual Appliances for Connectors.


Connectors for Flow Ingestion

A flow ingestion connector is a data transmission tool that

  • streams flow observations from network devices like routers and firewalls to a central system,

  • supports multiple protocols like NetFlow v9 and IPFIX, and

  • stitches related client and server flows for integrated analysis.

Connector

Description

Deployed on Virtual Appliance

NetFlow

Collects NetFlow V9 and/or IP-FIX telemetry from network devices such as routers and switches.

Secure Workload Ingest

F5 BIG-IP

Collects telemetry from F5 BIG-IP, stitch client, and server side flows, and enriches client inventory with user attributes.

Secure Workload Ingest

Citrix NetScaler

Collects telemetry from Citrix ADC, stitch client, and server side flows.

Secure Workload Ingest

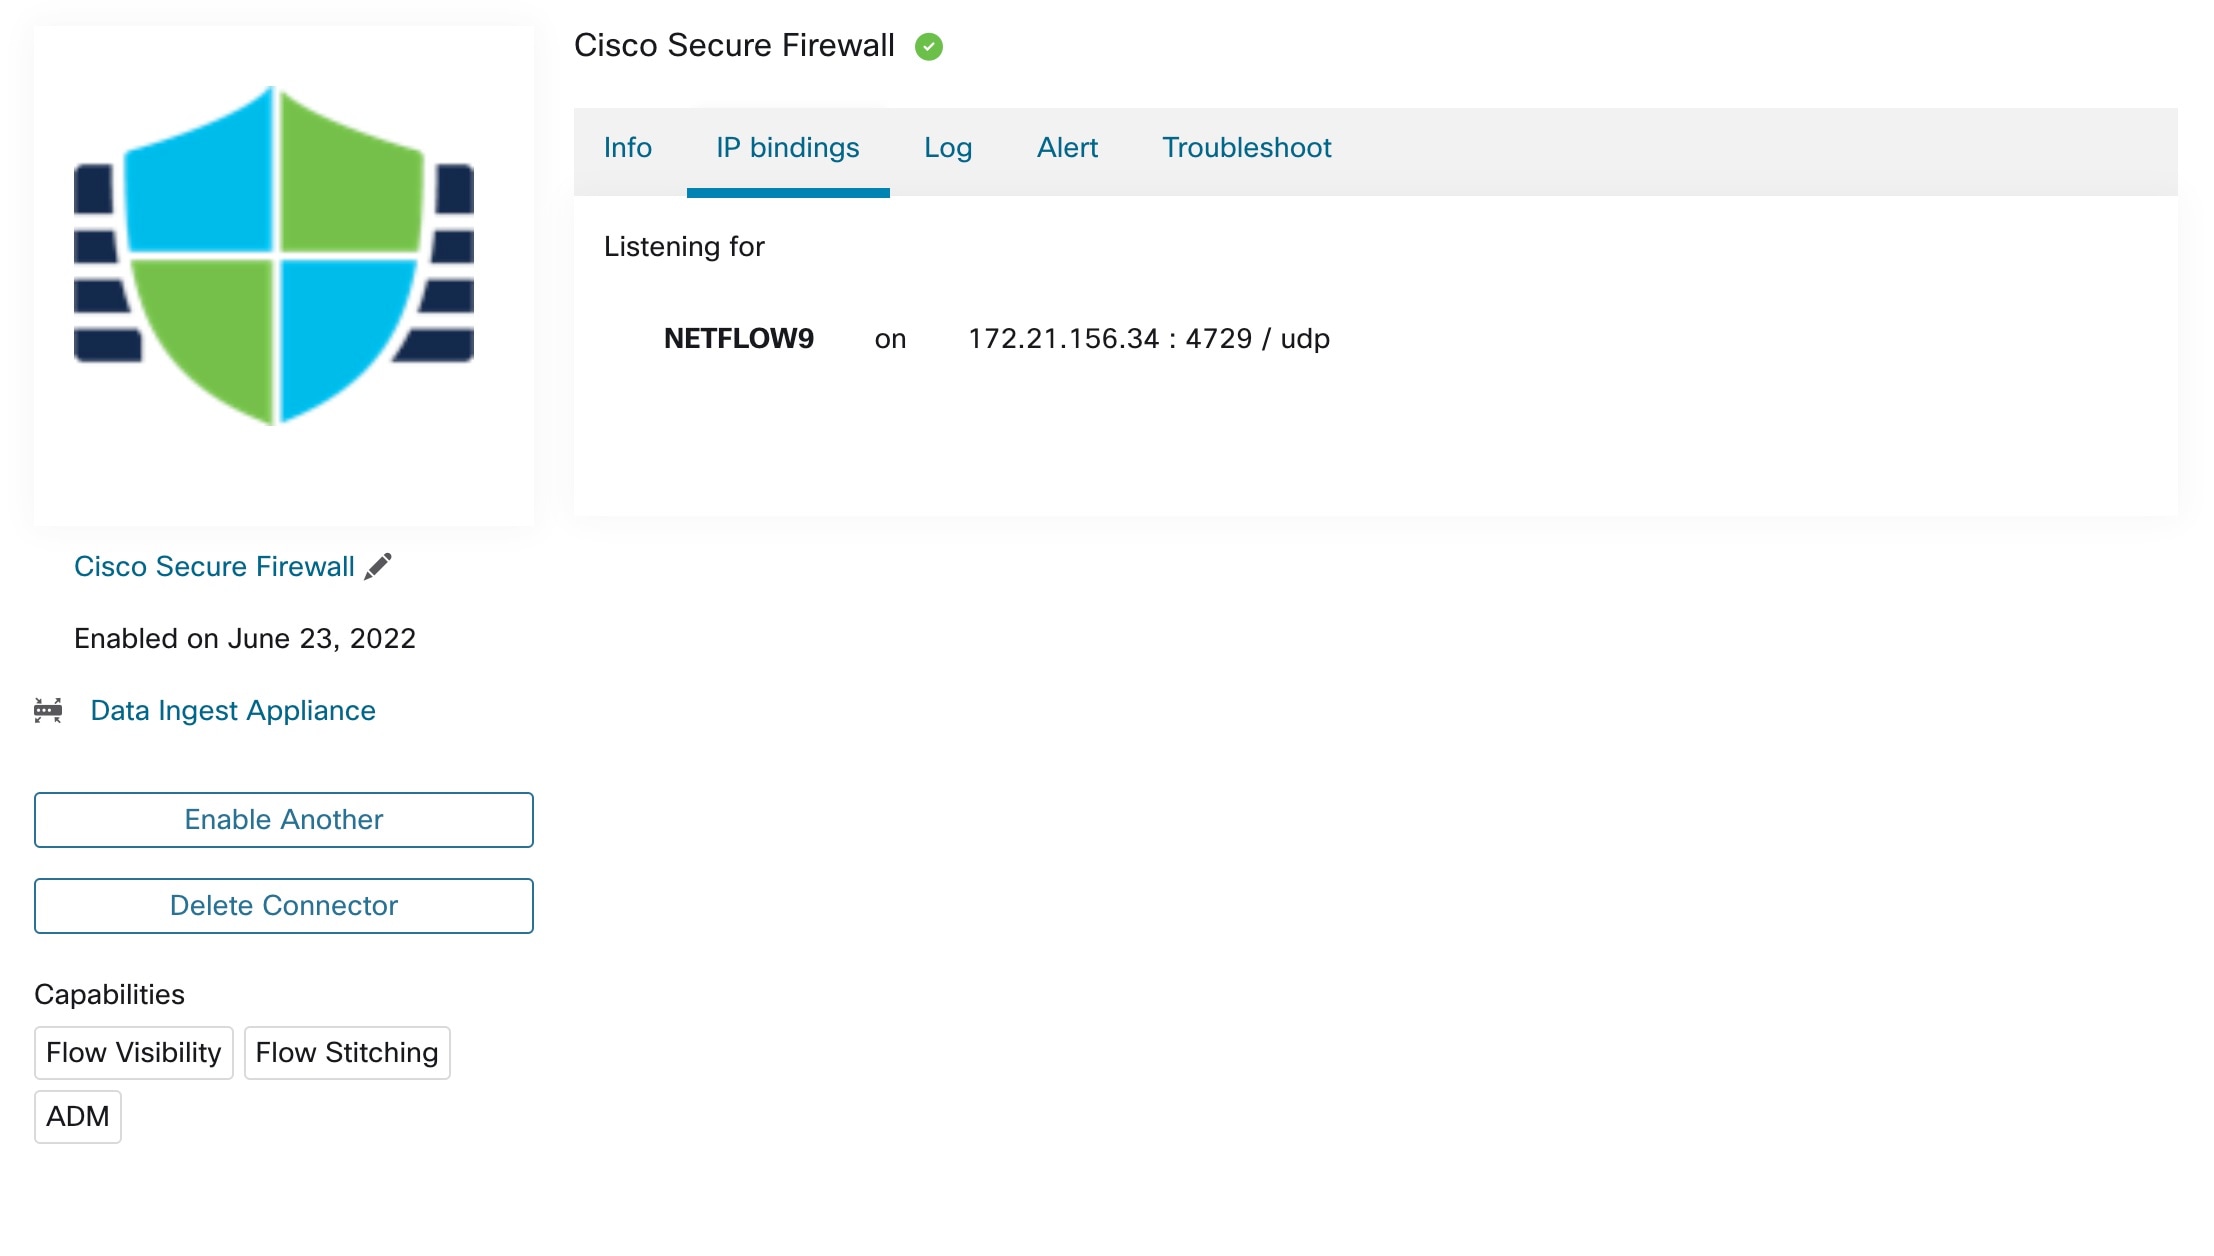
Cisco Secure Connector Firewall

Collects telemetry data from Secure Firewall ASA, Secure Firewall Threat Defense, stitch client, and server side flows.

Secure Workload Ingest

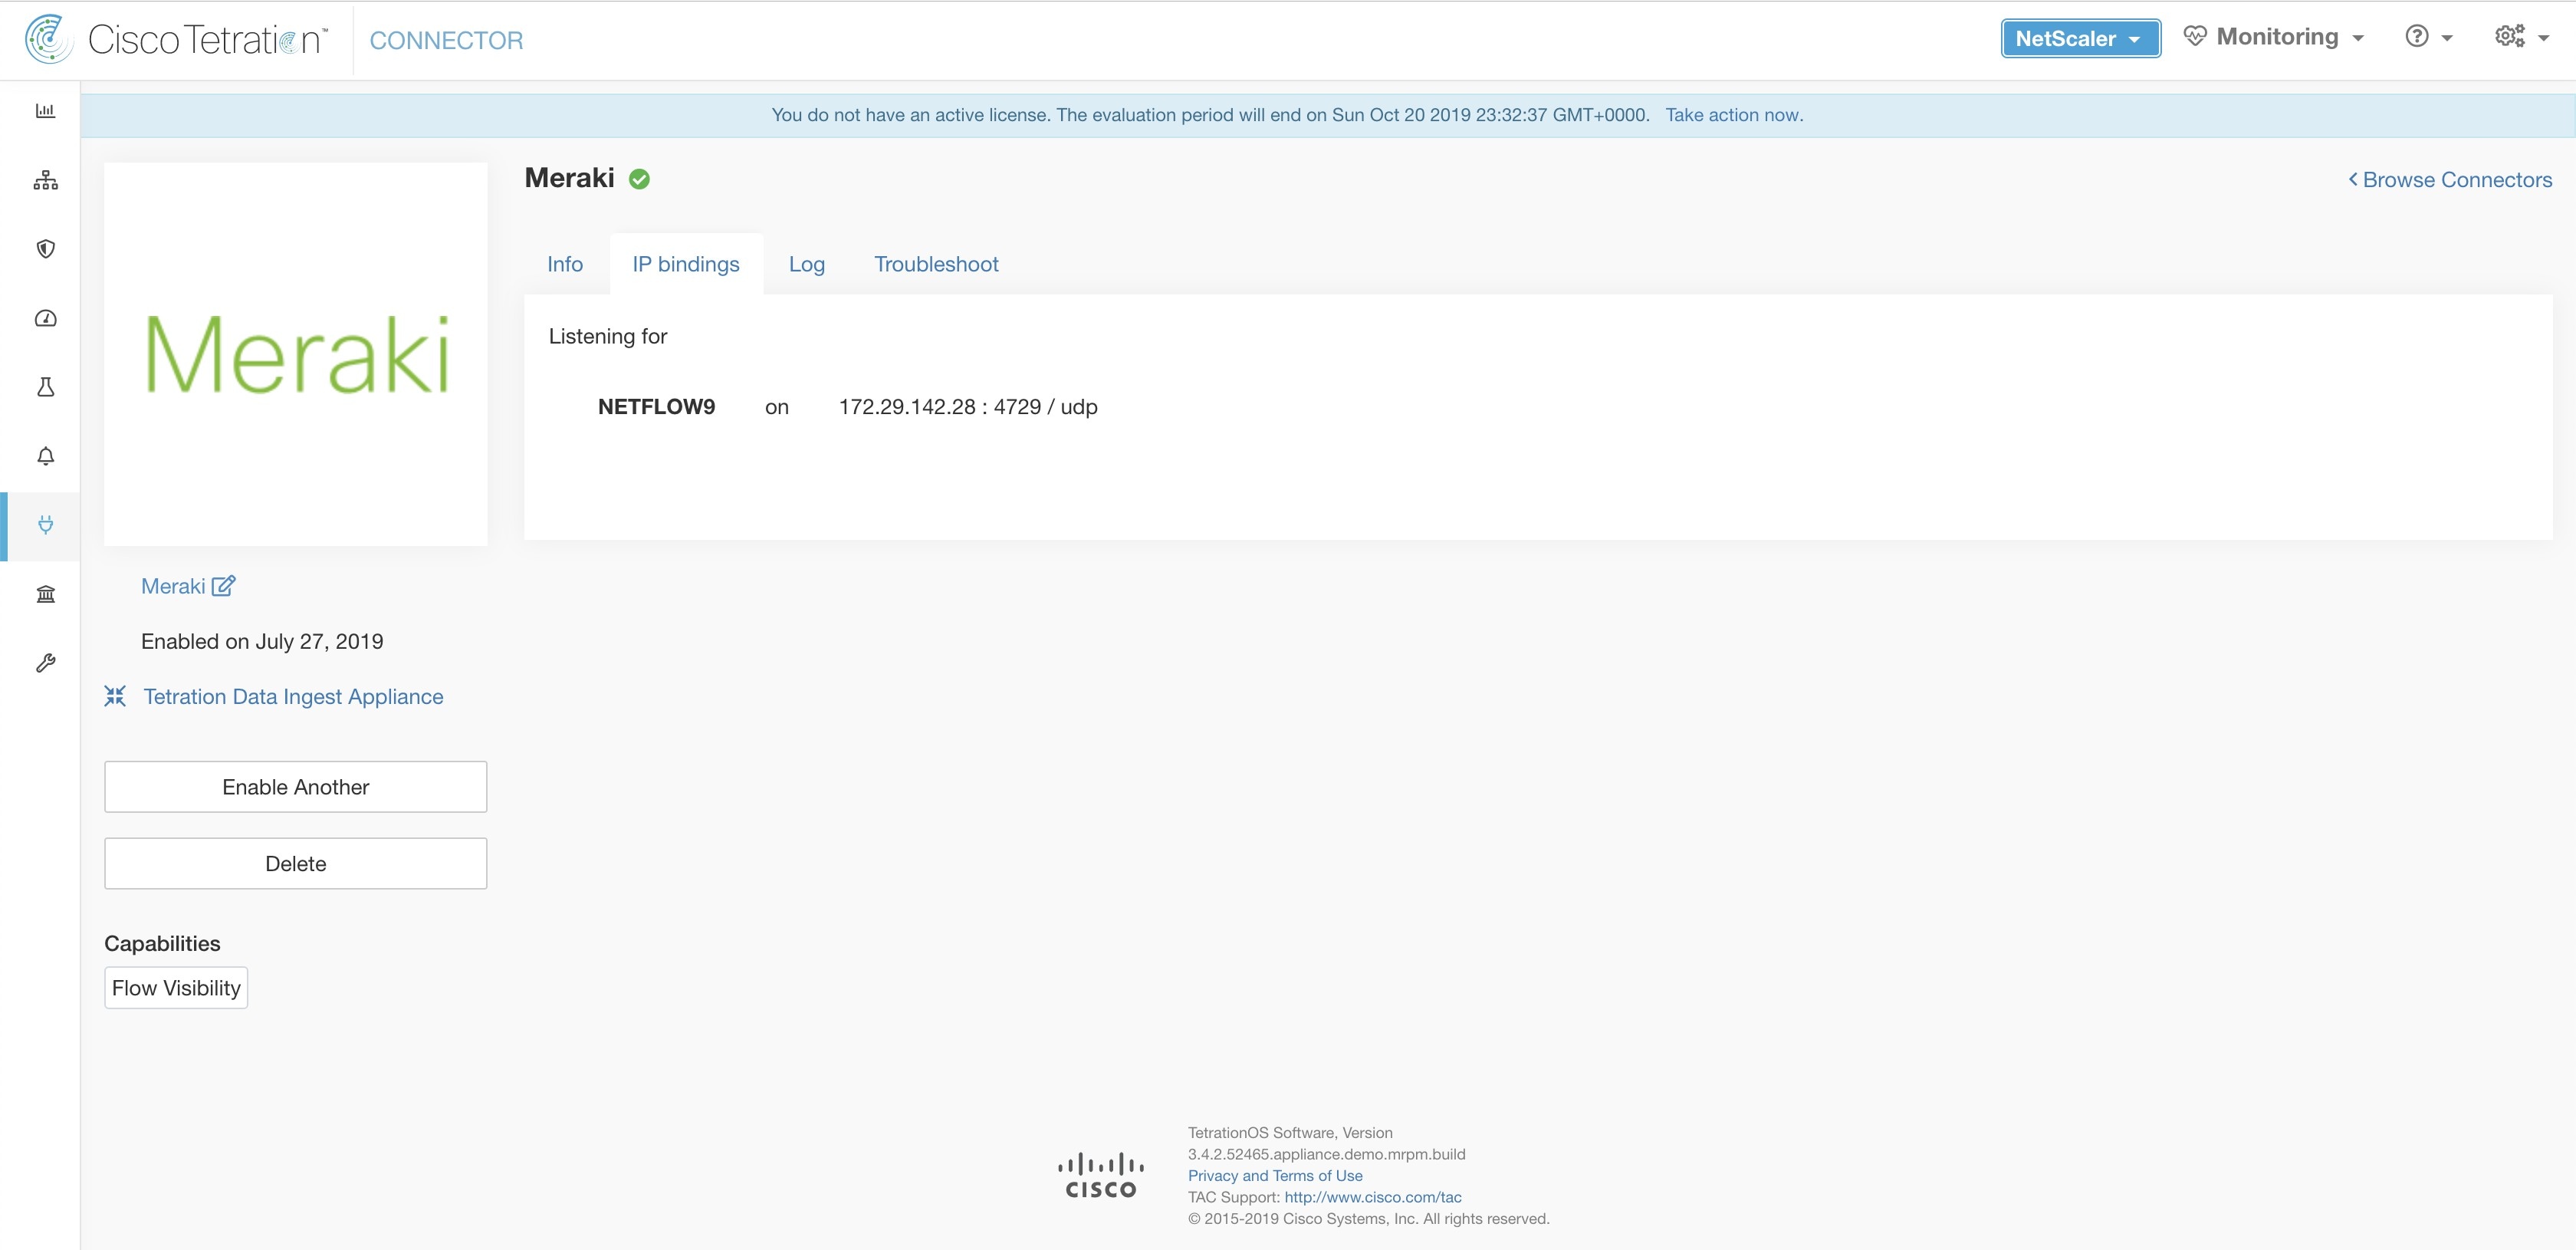
Meraki

Collects telemetry data from Meraki firewalls.

Secure Workload Ingest

ERSPAN

Collects ERSPAN telemetry data from network devices which support ERSPAN.

Secure Workload Ingest

See also

For more information, refer to Cloud Connectors.

For more information about required virtual appliances, refer to Virtual Appliances for Connectors.

NetFlow Connector

The NetFlow connector is a network solution that

  • allows Secure Workload to ingest flow observations from routers and switches in the network.

  • eliminates the need for host software agents, and

  • uses Cisco switches to relay records to the NetFlow connector for processing.

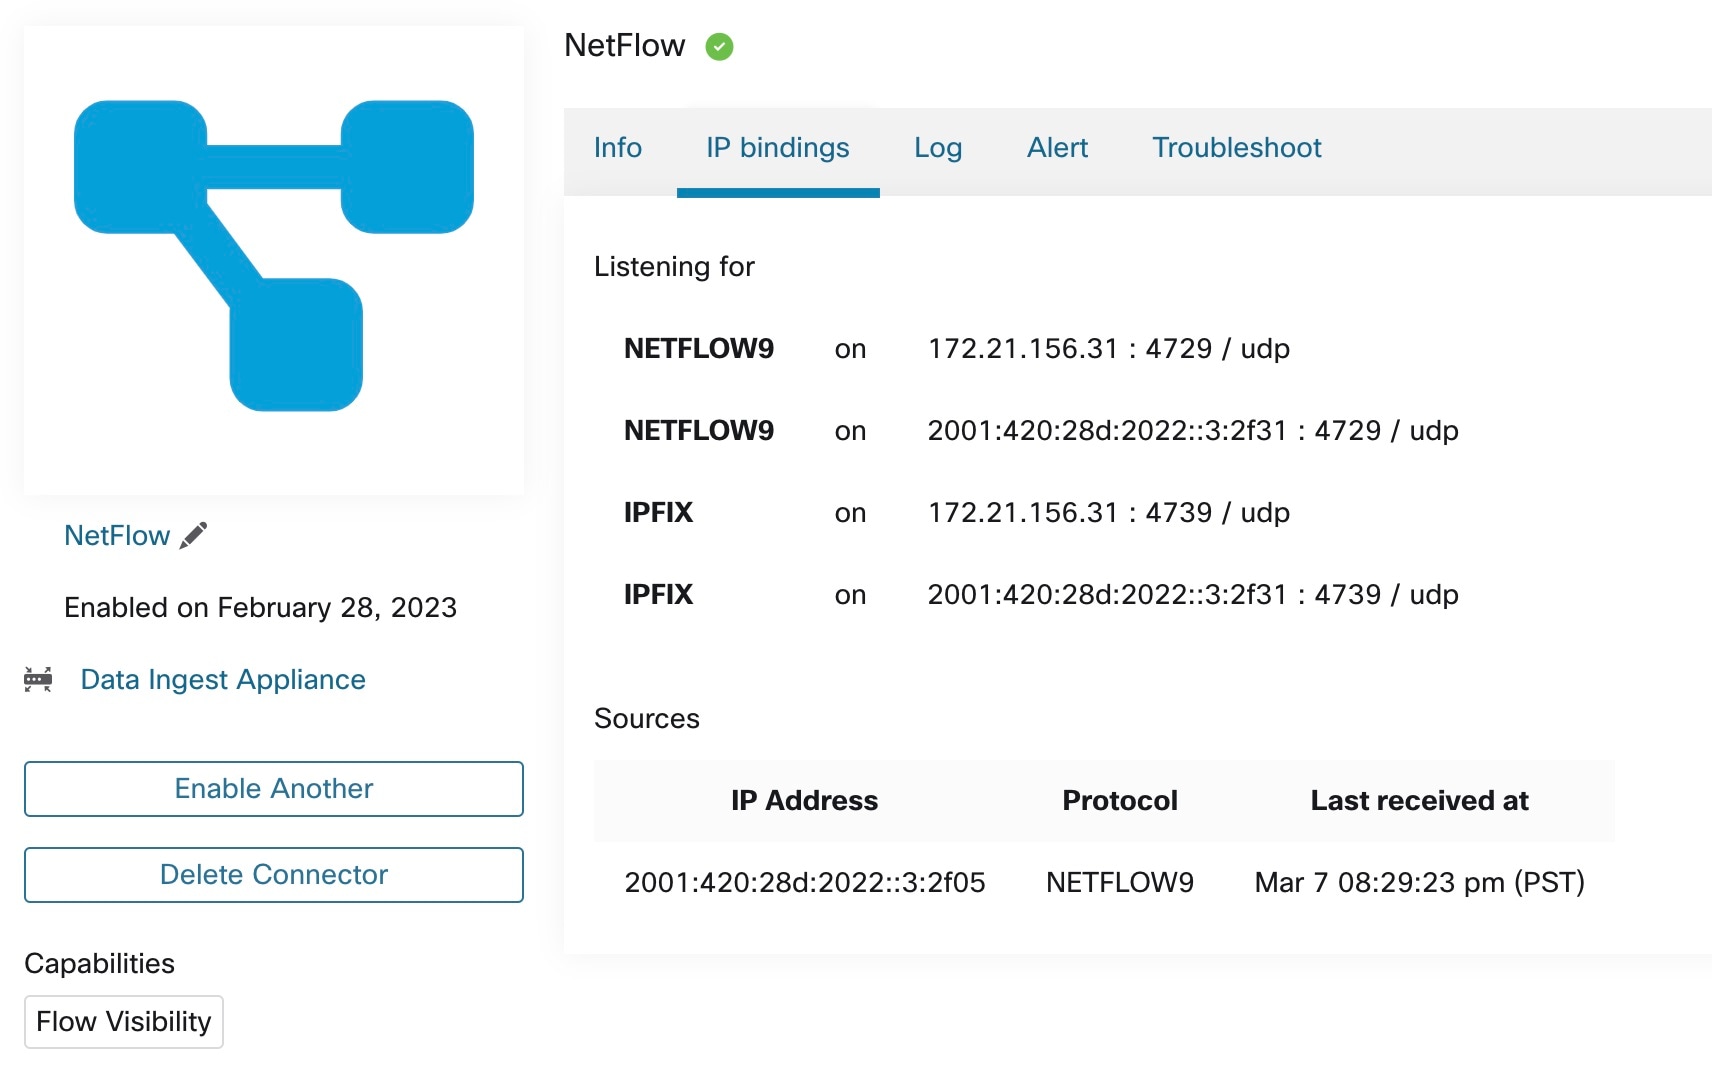
Figure 1. NetFlow connector
NetFlow connectors
What is NetFlow

NetFlow is a network monitoring protocol that:

  • allows routers and switches to aggregate traffic passing through them into flows,

  • enables the export of flow data to a flow collector for storage, and

  • supports offline querying and analysis.

To set up NetFlow, follow these steps:

  1. Enable the NetFlow feature on your network devices. Then, configure the flow templates for export.

  2. Configure the NetFlow Collector Endpoint information on the remote network devices. The NetFlow collector listens to the configured endpoint to receive and process NetFlow flow records.

NetFlow is supported by Cisco routers and switches, providing a method to extensively understand traffic patterns.

Flow ingestion to Secure Workload

A NetFlow connector is a network component that

  • acts as a NetFlow collector,

  • registers as a NetFlow agent, and

  • supports NetFlow v9 and IPFIX protocols.

The NetFlow connector is configured to receive flow records from network devices and forward them to Secure Workload for analysis. You can enable them on a Secure Workload Ingest appliance and run it as a Docker container.

The NetFlow connector registers with Secure Workload as a Secure Workload NetFlow agent. It decapsulates NetFlow protocol packets (that is, flow records); processes flows, and reports them like a standard Secure Workload agent. They focus on reporting flow records without process or interface information, unlike a Deep Visibility Agent.


Note


NetFlow connector supports NetFlow v9 and IPFIX protocols.


Note


Each NetFlow connector should report flows for a single VRF. The flows are exported and placed in the VRF based on the Agent VRF configuration in the Secure Workload cluster.

To configure the VRF for the connector, choose Manage > Agents and click the Configuration tab. Under the Agent Remote VRF Configurations section, click Create Config . Provide the VRF name, the IP subnet of the connector, and the range of port numbers to send flow records to the cluster.


Rate limiting

A rate limit is a threshold that

  • allows the NetFlow connector to accept up to 15,000 flows per second.

  • ensures that if the limit is exceeded, additional flow records are dropped.

  • mandates a correct flow rate for customer support eligibility.

The NetFlow connector can parse packets with multiple flow and template records. It maintain efficiency within specified limits and identifies the flows.

The NetFlow connector accepts up to 15000 flows per second. If the connector parses more than 15000 flows per second, it drops the additional flow records.

The Secure Workload customer supports the NetFlow connector only if the flow rate is within this acceptable limit.

If the flow rate exceeds 15000 flows per second, it is important to adjust the flow rate to within limits and maintain it for at least three days. This helps rule out issues related to a higher incoming flow rate.

If the original issue persists, customer support becomes involved to investigate the problem and develop effective solutions.

Supported Information Elements

The NetFlow connector supports these information elements in NetFlow v9 and IPFIX protocols. For more information, refer to IP Flow Information Export (IPFIX) Entities.

Element ID

Name

Description

Mandatory

1

octetDeltaCount

Number of octets in incoming packets for this flow.

Yes

2

packetDeltaCount

Number of incoming packets for this flow.

Yes

4

protocolIdentifier

The value of the protocol number in the IP packet header.

Yes

6

tcpControlBits

TCP control bits observed for packets of this flow. The agent handles FIN, SYN, RST, PSH, ACK, and URG flags.

No

7

sourceTransportPort

The source port identifier in the transport header.

Yes

8

sourceIPv4Address

The IPv4 source address in the IP packet header.

Either 8 or 27

11

destinationTransportPort

The destination port identifier in the transport header.

Yes

12

destinationIPv4Address

The IPv4 destination address in the IP packet header.

Either 12 or 28

27

sourceIPv6Address

The IPv6 source address in the IP packet header.

Either 8 or 27

28

destinationIPv6Address

The IPv6 destination address in the

IP packet header.

Either 12 or

28

150

flowStartSeconds

The absolute timestamp of the first packet of the flow (in seconds).

No

151

flowEndSeconds

The absolute timestamp of the last packet of the flow (in seconds).

No

152

flowStartMilliseconds

The absolute timestamp of the first packet of the flow (in milliseconds).

No

153

flowEndMilliseconds

The absolute timestamp of the last packet of the flow (in milliseconds).

No

154

flowStartMicroseconds

The absolute timestamp of the first packet of the flow (in microseconds).

No

155

flowEndMicroseconds

The absolute timestamp of the last packet of the flow (in microseconds).

No

156

flowStartNanoseconds

The absolute timestamp of the first packet of the flow (in nanoseconds).

No

157

flowEndNanoseconds

The absolute timestamp of the last packet of the flow (in nanoseconds).

No

NetFlow and NSEL for Cisco Secure Firewall connector

NetFlow Connector enables Secure Workload to ingest NetFlow v9 or IPFIX from Nexus routers or switches. No agents needed on hosts—connector on Ingest appliance processes flows up to 15K per second per conenctor with VRF support.

  • Flow analytics dashboard: View ingested flows in real-time Flow Rate Gauge (green <5K pps, yellow 5-10K, red >10K approaching limit).

  • Color coding:

    Status Color Meaning
    Healthy Green Flows <10K pps, 0 drops
    Warning Yellow 10-14K pps, minor drops
    Critical Red >15K pps, rate limiting active
  • Highlights client-server flow pairs using blue lines for bidirectional flows and orange lines for unidirectional flows.

Cisco Secure Firewall Connector (NSEL)

Ingests NSEL events from Cisco Secure Firewall, Cisco ASA or Secure Firewall Threat Defense to monitor stateful flows. It stitches NATed client-server flows and supports creation, teardown, or denial, or update events.

NSEL events dashboard

  • Event timeline: Interactive chart with color-coded events (green >create, blue >update, orange >teardown, red >denied).

  • Color code:

    Event Color Action in Secure Workload
    Flow created Green Bidirectional flow reported
    Flow updated Blue Incremental bytes/pkts
    Flow denied Red Rejected (ACL/ICMP) disposition
    Flow teardown Orange Termination reason logged
  • NAT stitching matrix: Heatmap shows stitched pairs (intensity by byte count); hover for Element IDs (For example, 225 post-NAT src IP).

  • TCP heuristics overlay: SYN/ACK/FIN flags inferred and visualized as flag badges on flows.

How to configure NetFlow on the Switch

This task is specific to the Cisco Nexus 9000 switch and might slightly differ for other Cisco platforms. Refer to the official Cisco configuration guide for detailed platform-specific settings.

Procedure

Step 1

Enter global configuration mode.

switch# configure terminal

Step 2

Enable the NetFlow feature.

switch(config)# feature netflow

Step 3

Configure a flow record.

This configuration generates five tuple information for flows:


    switch(config)# flow record ipv4-records
    switch(config-flow-record)# description IPv4Flow
    switch(config-flow-record)# match ipv4 source address
    switch(config-flow-record)# match ipv4 destination address
    switch(config-flow-record)# match ip protocol
    switch(config-flow-record)# match transport source-port
    switch(config-flow-record)# match transport destination-port
    switch(config-flow-record)# collect transport tcp flags
    switch(config-flow-record)# collect counter bytes
    switch(config-flow-record)# collect counter packets

Step 4

Configure a flow exporter to specify protocol, template exchange interval, and collector endpoint.

Specify the IP and port on which the NetFlow connector is enabled on a Secure Workload Ingest appliance.


    switch(config)# flow exporter flow-exporter-one
    switch(config-flow-exporter)# description NetFlowv9ToNetFlowConnector
    switch(config-flow-exporter)# destination 172.26.230.173 use-vrf management
    switch(config-flow-exporter)# transport udp 4729
    switch(config-flow-exporter)# source mgmt0
    switch(config-flow-exporter)# version 9
    switch(config-flow-exporter-version-9)# template data timeout 20

Step 5

Configure a flow monitor to associate the flow record and exporter:


    switch(config)# flow monitor ipv4-monitor
    switch(config-flow-monitor)# description IPv4FlowMonitor
    switch(config-flow-monitor)# record ipv4-records
    switch(config-flow-monitor)# exporter flow-exporter-one

Step 6

Apply the flow monitor to an interface.


    switch(config)# interface Ethernet 1/1
    switch(config-if)# ip flow monitor ipv4-monitor input

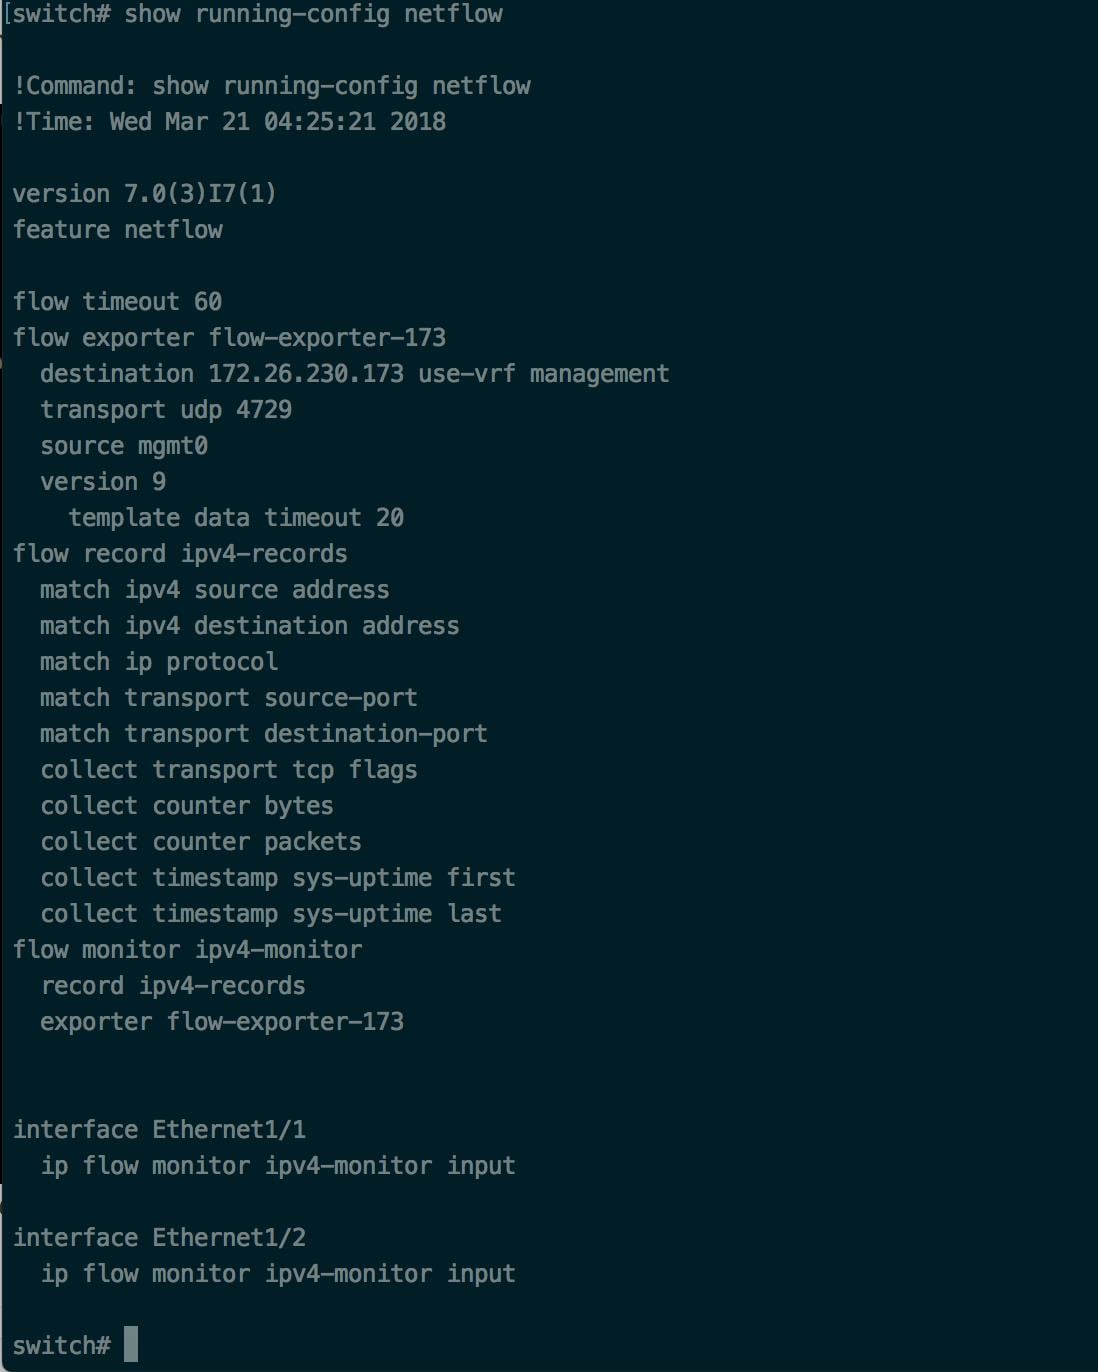
NetFlow on the Nexus 9000 exports NetFlow v9 protocol packets for ingress traffic through interface 1/1. It sends flow records to 172.26.230.173:4729 using UDP protocol. Each flow record includes five-tuple traffic information and the byte/packet count of the flow.

Figure 2. Running configuration of NetFlow on Cisco Nexus 9000 Switch
Running configuration of NetFlow on Cisco Nexus 9000 Switch

How to configure the connector

For information about required virtual appliances, refer to Virtual Appliances for Connectors. For NetFlow connectors, IPv4 and IPv6 (dual stack mode) addresses are supported. However, note that dual stack support is currently a beta feature.

You can configure the connector with the following options:

In addition, you can update the listening ports of IPFIX protocol on the connector through the Docker container in Secure Workload Ingest appliance using an allowed command. You can issue this command on the appliance by providing the connector ID of the connector, the type of the port to be update, and the new port information. You can find the connector ID on the connector page in Secure Workload user interface. For more information, see update-listening-ports.

Limits

Metric

Limit

Maximum number of NetFlow connectors on a single Secure Workload Ingest appliance

3

Maximum number of NetFlow connectors on one Tenant (root scope)

10

Maximum number of NetFlow connectors on Secure Workload

100

F5 Connector

An F5 connector is a network tool that:

  • allows Cisco Secure Workload to ingest flow observations from F5 BIG-IP ADCs,

  • enables remote monitoring of flow observations on these F5 devices, and

  • provides annotation of client-side and server-side flows, including user details that are available.

Using F5 connectors eliminates the need for software agents on hosts. Configure F5 BIG-IP ADC to export of IPFIX records to the F5 connector.

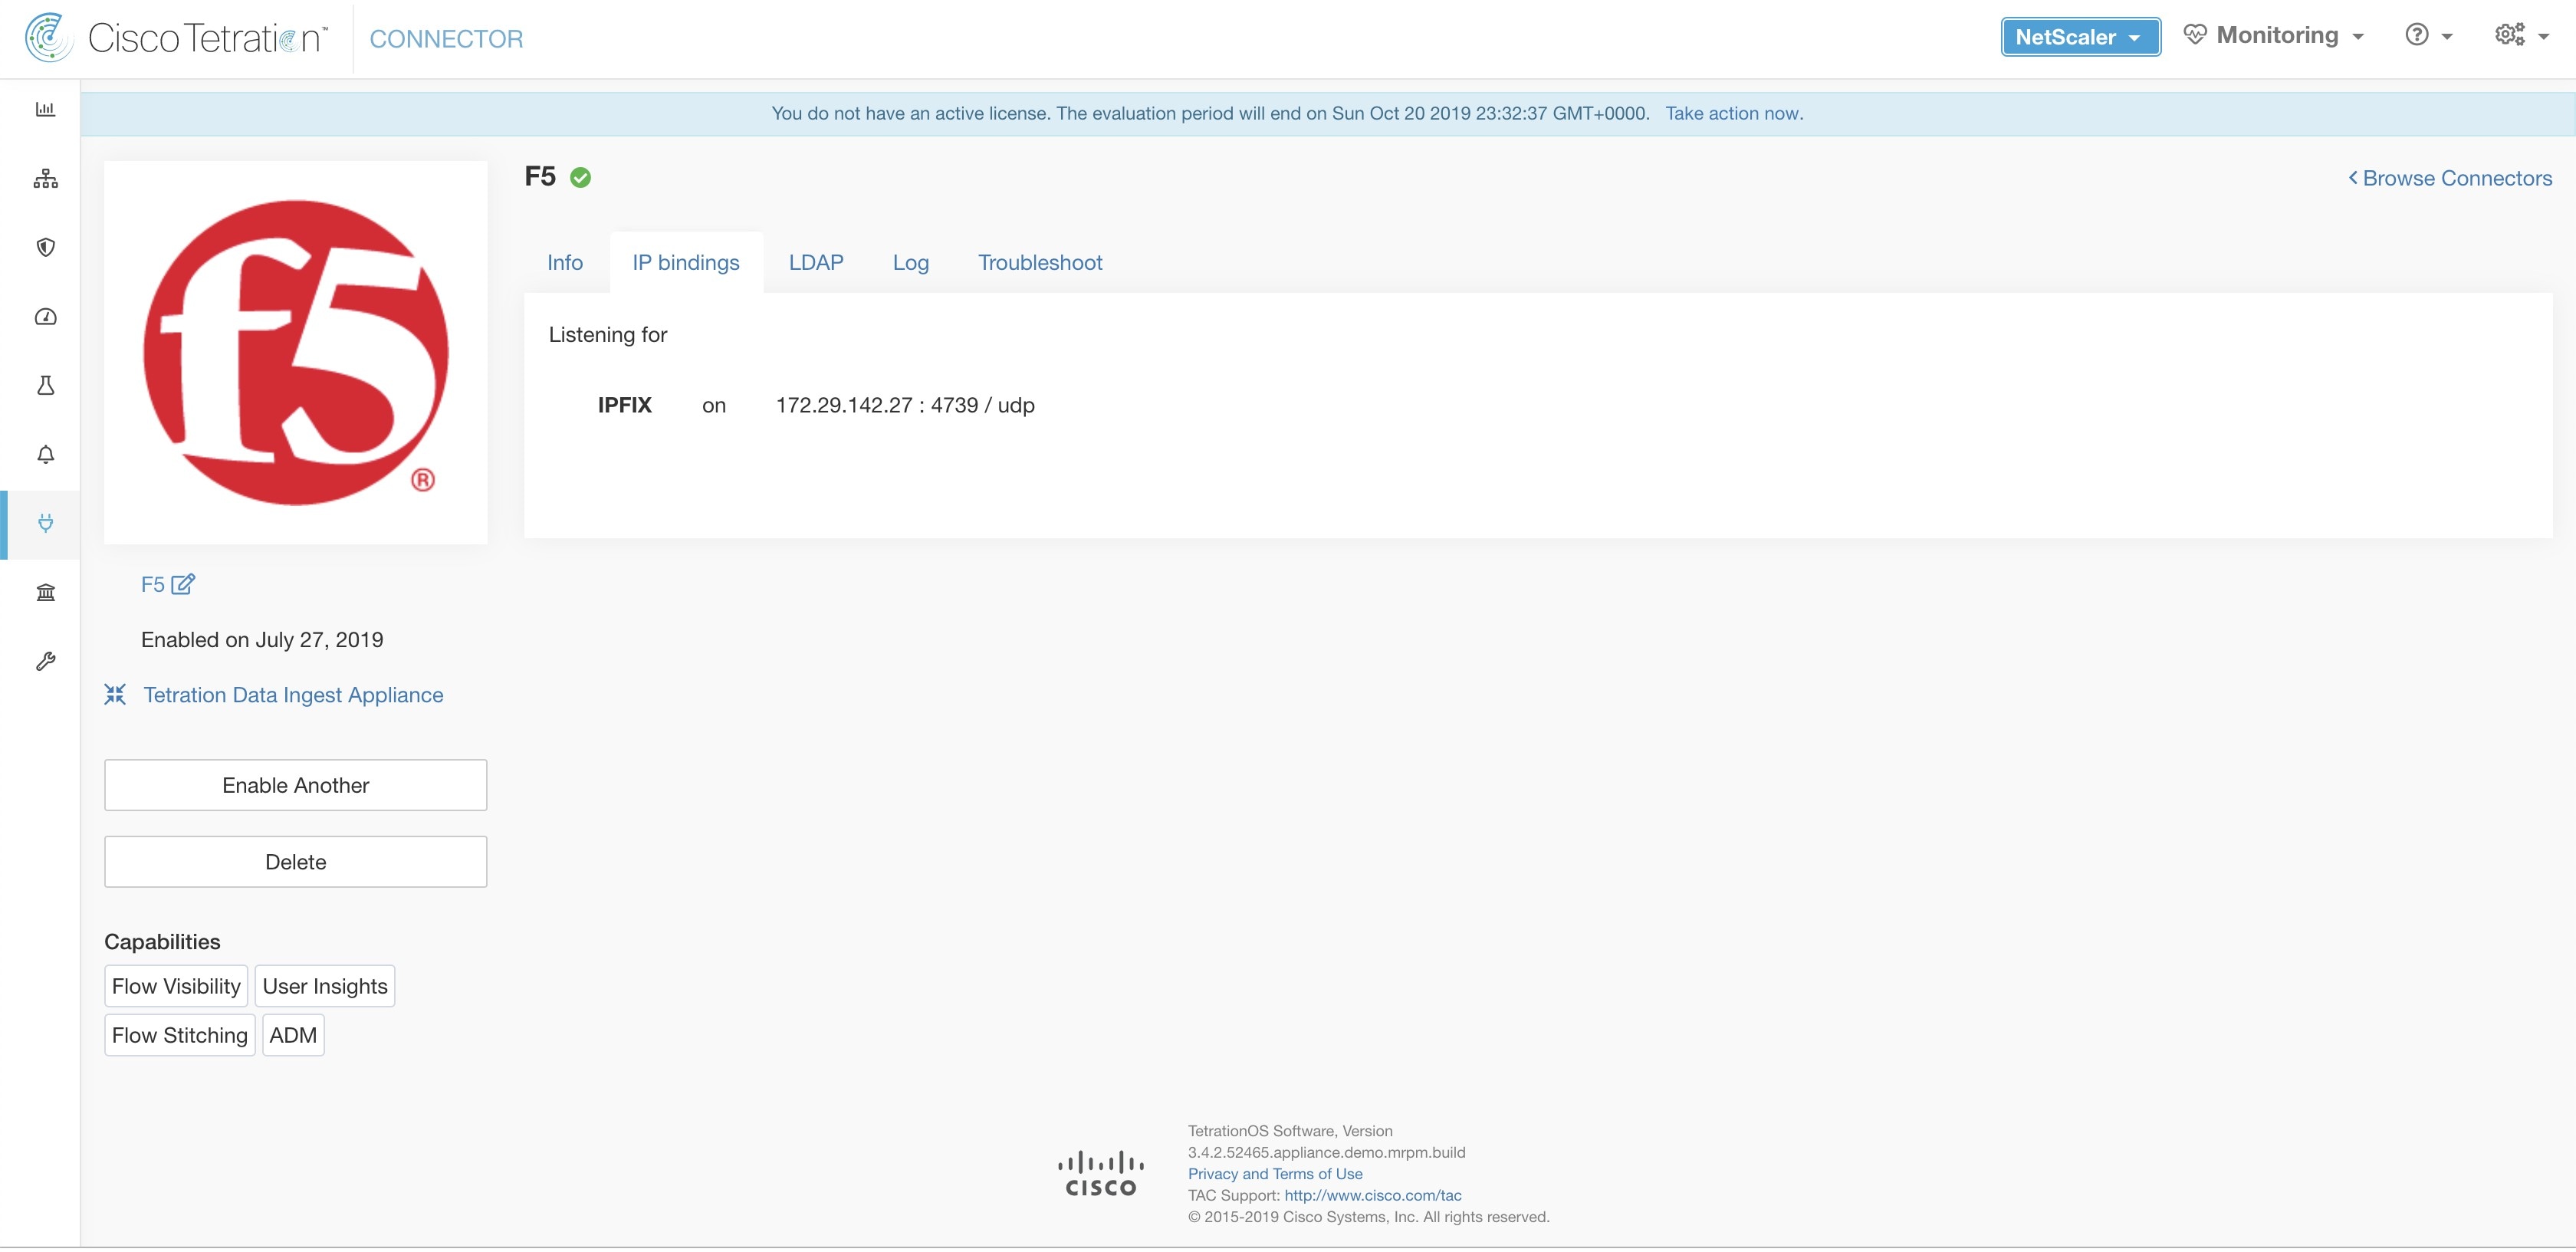
Figure 3. F5 connector
F5 connector
What is F5 BIG-IP IPFIX

BIG-IP IPFIX logging is a feature on F5 appliances that:

  • collects flow data detailing traffic navigating the F5 BIG-IP infrastructure,

  • exports IPFIX records to designated flow collectors, and

  • operates with F5 BIG-IP software version 12.1.2 and later.

For more information, refer to F5 BIG-IP IPFIX logging.

The setup involves these steps:

  1. Create the IPFIX Log-Publisher on the F5 BIG-IP appliance.

  2. Configure the IPFIX Log-Destination on the F5 BIG-IP appliance, which listens on the configured endpoint to receive and process flow records.

  3. Create an F5 iRule that publishes IPFIX flow records to the log-publisher.

  4. Add the F5 iRule to the virtual server of interest.


    Note


    F5 connector supports F5 BIG-IP software version 12.1.2 and above.


Flow ingestion to Secure Workload

An F5 BIG-IP connector is a component that

  • acts as an IPFIX collector,

  • stitches NATed flows for forwarding to Secure Workload, and

  • configures LDAP attributes for transactions if authentication is managed by F5.


Note


F5 connector supports only the IPFIX protocol.


Note


Each F5 connector reports only flows for a single VRF. Based on the Agent VRF configuration in the Cisco Secure Workload cluster, the connector assigns the flows to the VRF .

  1. To configure the VRF for the connector, choose Manage > Agents.

  2. Click the Configuration tab.

  3. Under the Agent Remote VRF Configurations section, click Create Config.

  4. Provide details such as the VRF name, IP subnet of the connector, and the range of port numbers that can send flow records to the cluster.


How to configure IPFIX on F5 BIG-IP

The following steps are for F5 BIG-IP load balancer. For more information, refer to Configuring F5 BIG-IP for IPFIX.

Purpose

Description

1. Create a pool of IPFIX collectors.

On a F5 BIG-IP appliance, create the pool of IPFIX collectors. These are the IP addresses associated with F5 connectors on a Secure Workload Ingest appliance. F5 connectors run in Docker containers on the VM listen on port 4739 for IPFIX packets.

2. Create a log-destination.

The log destination configuration on a F5 BIG-IP appliance specifies the actual pool of IPFIX collectors that are used.

3. Create a log-publisher.

A log publisher specifies where F5 BIG-IP sends the IPFIX messages. The publisher binds to a log-destination.

4. Add a F5 and Secure Workload approved iRule.

Secure Workload and F5 developed iRules that will export flow records to F5 connectors. These iRules export complete information about a given transaction, including all endpoints, byte counts, packet counts, and flow start and end times (in milliseconds). F5 connectors will create four independent flows, matching each with its related flow.

5. Add the iRule to the virtual server.

In the iRule settings of a virtual server, add the Secure Workload, approved iRule to the virtual server.

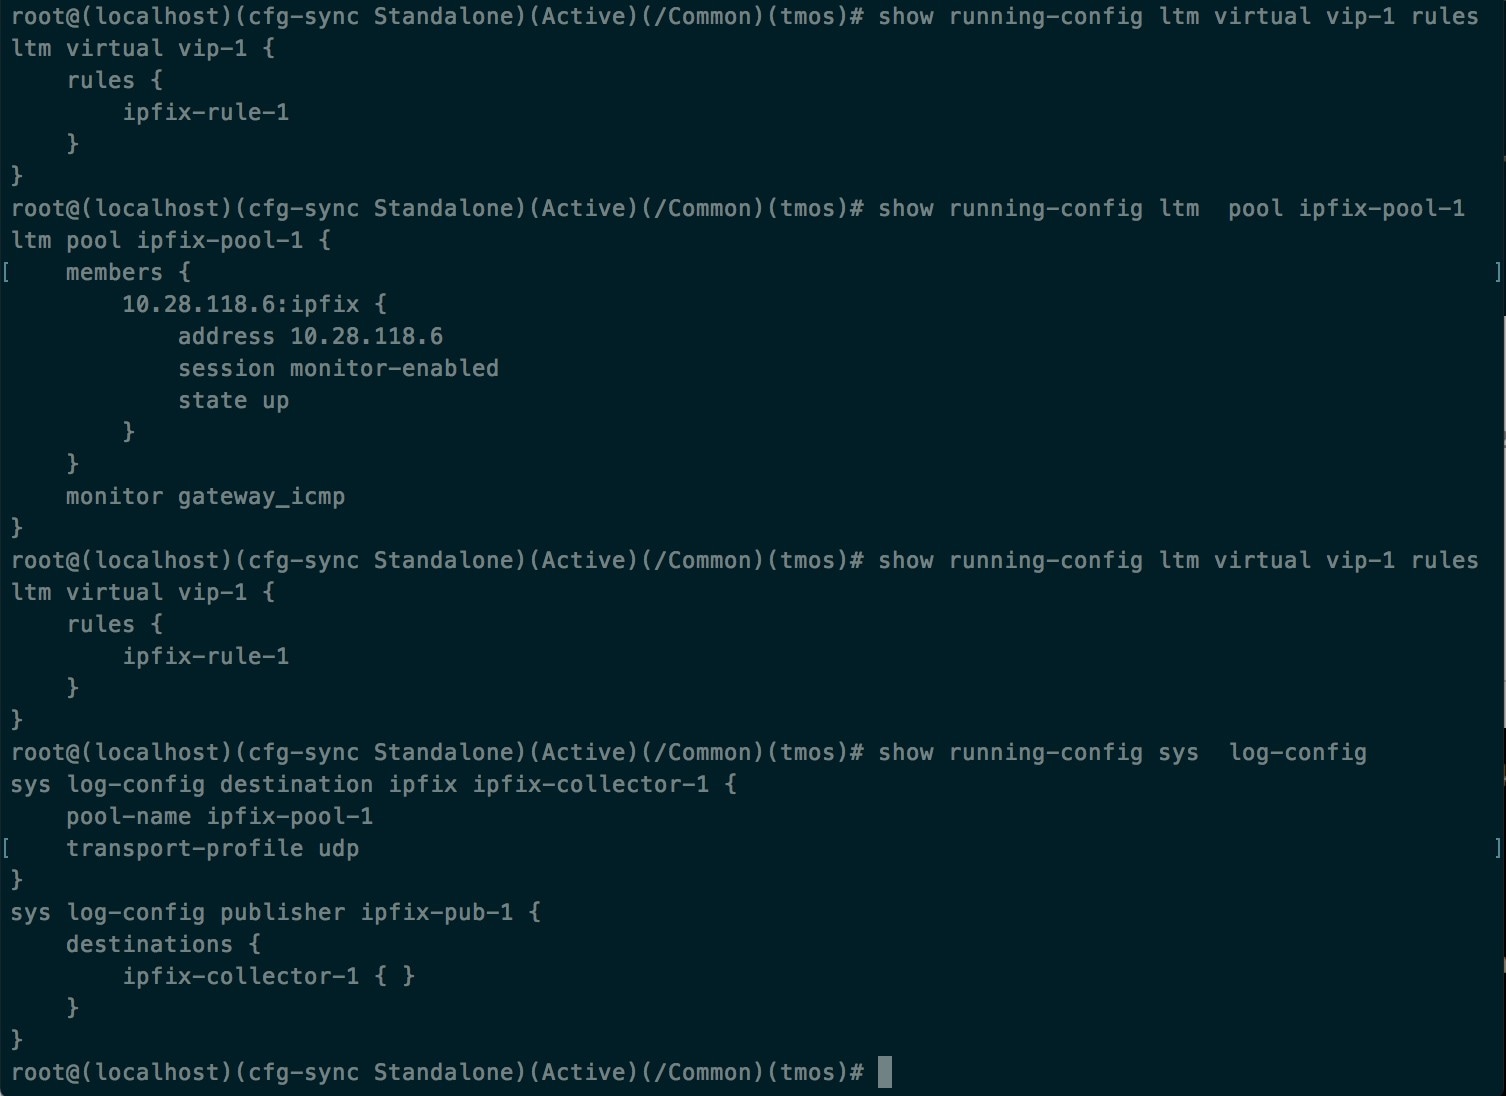
These steps configures IPFIX on the F5 BIG-IP load balancer to export IPFIX protocol packets for traffic traveling through the appliance. Here is a sample config of F5.

Figure 4. Running configuration of IPFIX on F5 BIG-IP load balancer
Running configuration of IPFIX on F5 BIG-IP load balancer

In this example, flow records will be published to ipfix-pub-1. ipfix-pub-1 is configured with log-destination ipfix-collector-1 which sends the IPFIX messages to IPFIX pool ipfix-pool-1. ipfix-pool-1 has 10.28.118.6 as one of the IPFIX collectors. The virtual server vip-1 is configured with IPFIX iRule ipfix-rule-1 which specifies the IPFIX template and how the template gets filled and sent.


Note


Before using the iRule downloaded from this guide, update the log-publisher to point to the log-publisher configured in the F5 connector where you add the iRule.


Note


F5 has published a GitHub repository, f5-tetration, to help you to start with flow-stitching. The iRules for publishing IPFIX records to the F5 connector for various protocol types are available at: f5-tetration/irules.

Visit the site for the latest iRule definitions. In addition, F5 also develops a script to:

  1. Install the correct iRule for the virtual servers.

  2. Add a pool of IPFIX collector endpoints (where F5 connectors listen for IPFIX records).

  3. Configure the log-collector and log-publisher.

  4. Bind the correct iRule to the virtual servers.

This tool enables flow-stitching use-case, minimizing manual configuration and reducing user error. The script is available at f5-tetration/scripts.


How to configure the connector

A configuration connector is a component that

  • facilitates LDAP and log configuration,

  • enables updating IPFIX listening ports, and

  • supports a range of virtual appliances for connectivity.

For information about required virtual appliances, refer to Virtual Appliances for Connectors.

LDAP Configuration

The LDAP configuration supports discovery of LDAP attributes, provides a workflow to pick the relevant attribute for username identification and allows the fetching of up to six attributes per user for integration.

Log Configuration

For more information on log-related settings and to ensure correct integration with your system, refer to Log Configuration .

IPFIX Protocol Updates

You can update the IPFIX protocol listening ports on a Docker container through the Secure Workload Ingest appliance using a command that is allowed to be run on the container. You need the connector ID and new port data, which can be easily found on the connector page in Secure Workload user interface. For more information, refer to update-listening-ports.

Limits

Metric

Limit

Maximum number of F5 connectors on one Secure Workload Ingest appliance

3

Maximum number of F5 connectors on one Tenant (rootscope)

10

Maximum number of F5 connectors on Secure Workload

100

NetScaler Connector

A NetScaler connector is a monitoring solution that

  • enables Secure Workload to ingest flow observations from Citrix ADCs

  • allows remote monitoring and stitching of client-side and server-side flows, and

  • removes the need for hosts to run software agents.

With this setup, configure Citrix ADCs to export IPFIX records directly to the NetScaler connector for processing.

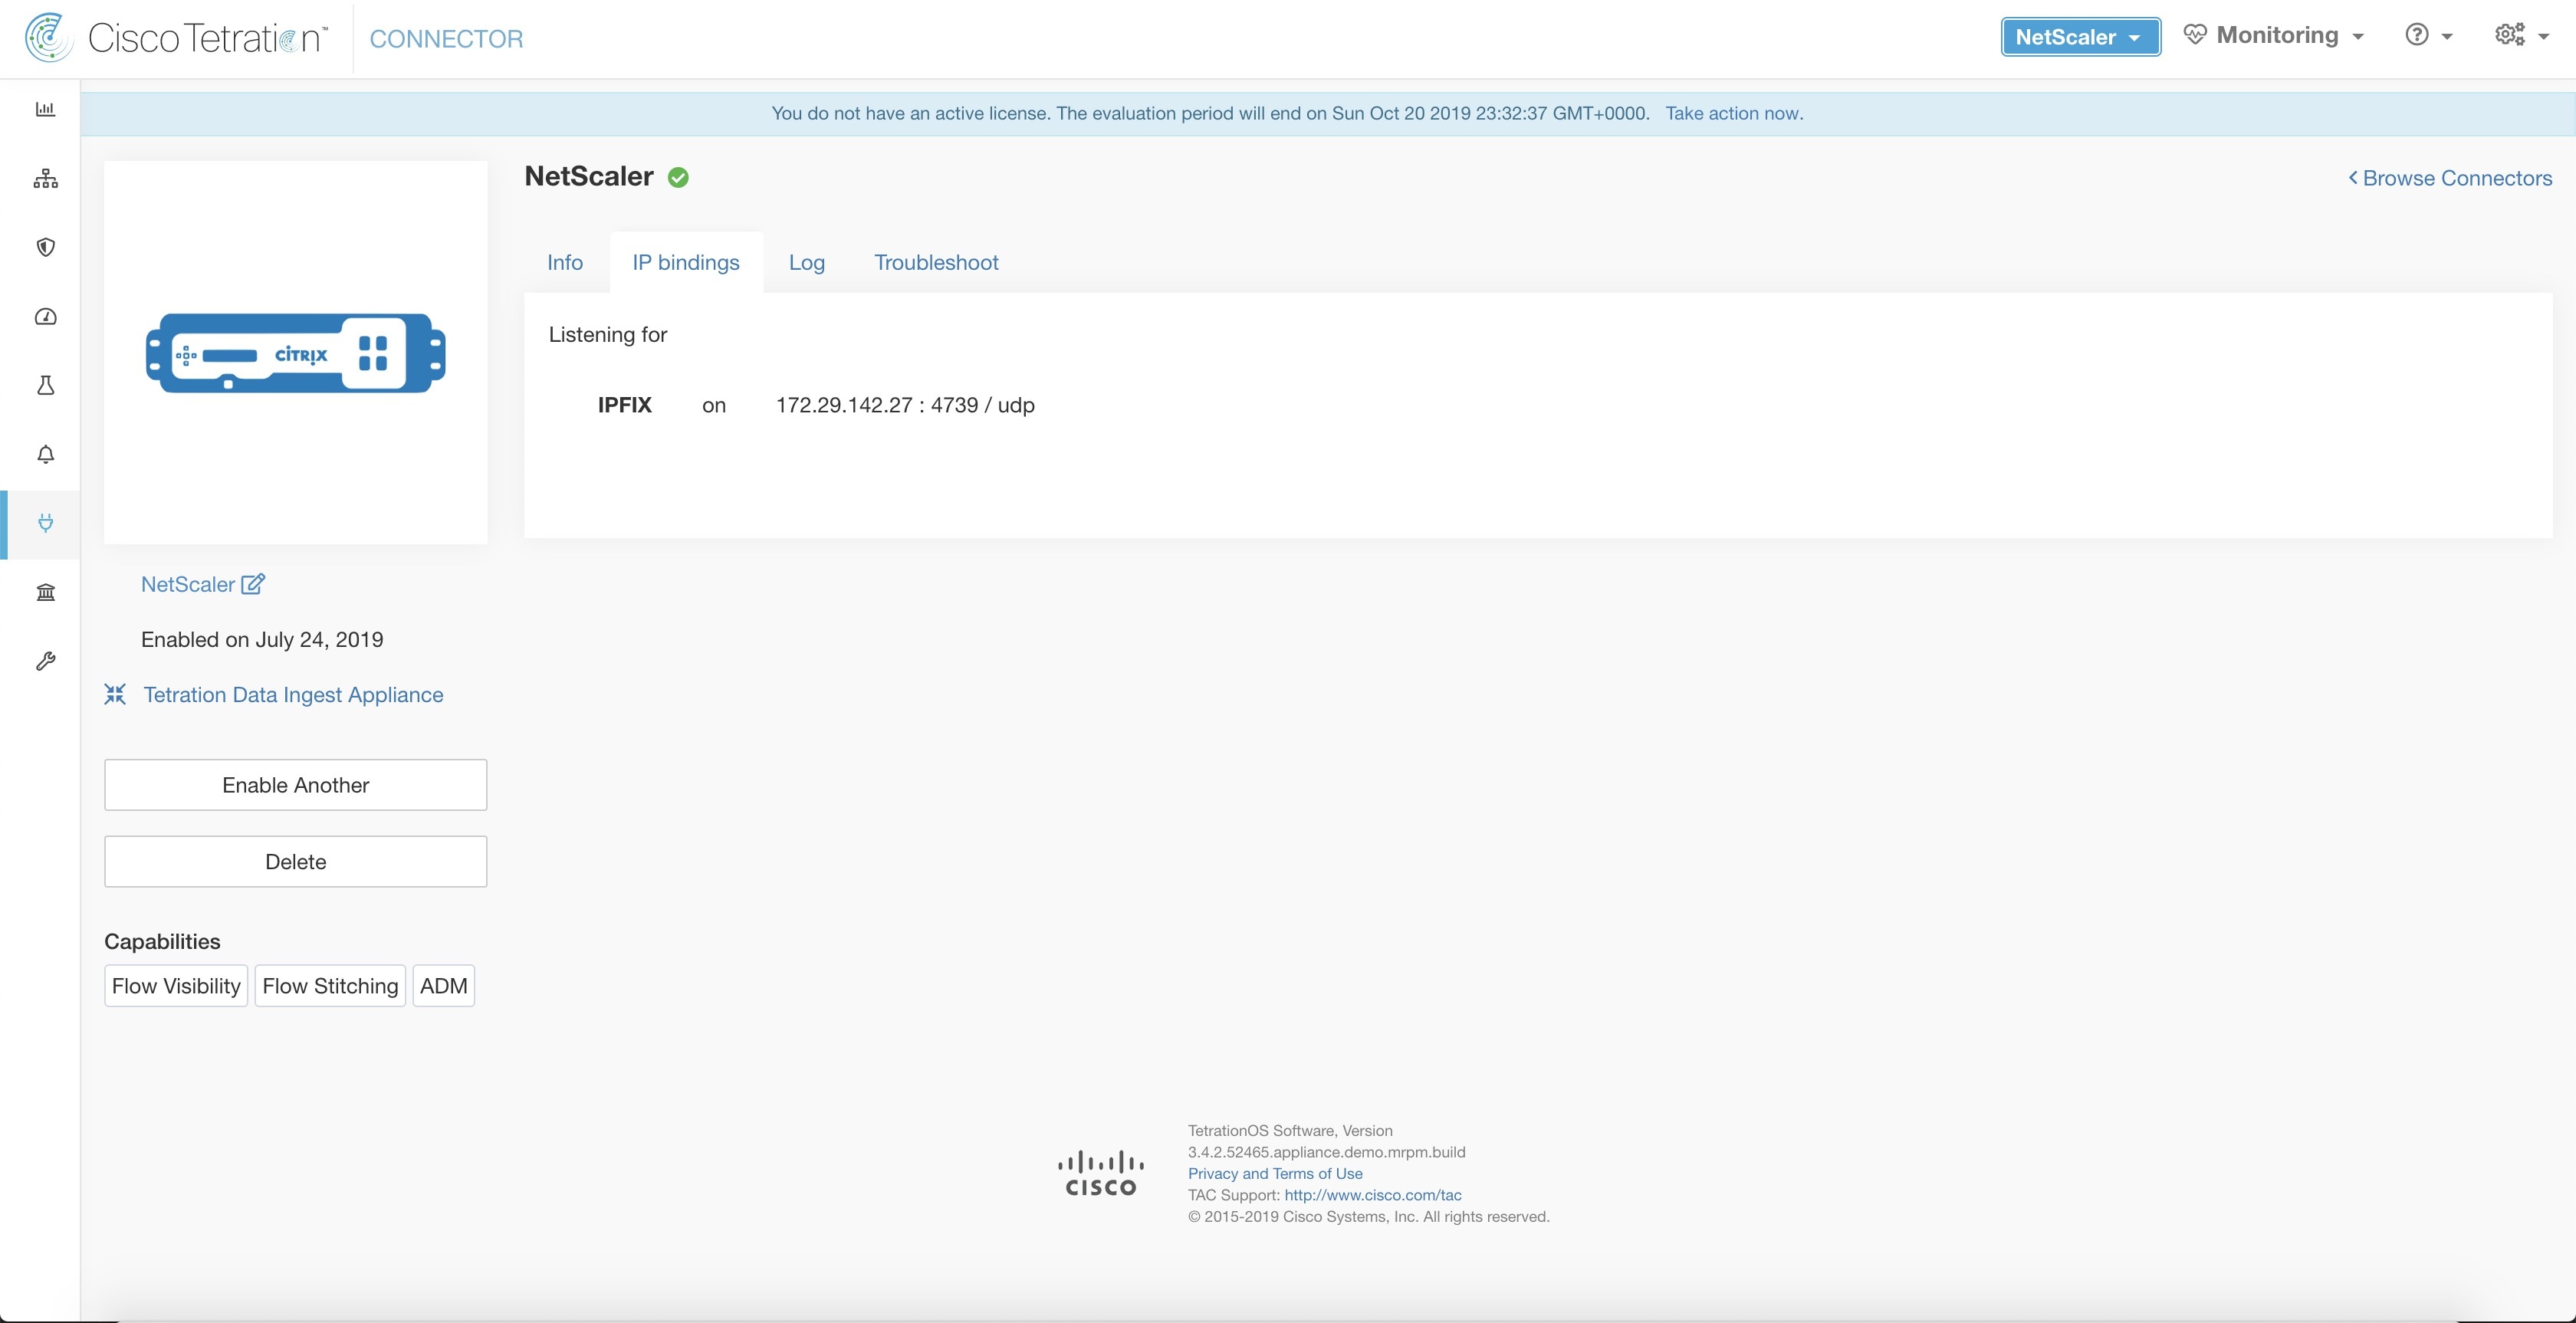
Figure 5. NetScaler connector
NetScaler connector
What is Citrix NetScaler AppFlow

The Citrix NetScaler AppFlow is a traffic management feature that:

  • collects flow data for traffic moving through the NetScaler,

  • exports IPFIX records to flow collectors, and

  • operates using the IPFIX protocol supported in Citrix NetScaler load balancers.

Citrix AppFlow is supported in Citrix NetScaler load balancers.

For more information about Citrix NetScaler AppFlow, refer to Citrix NetScaler AppFlow.

The setup for Citrix NetScaler AppFlow involves these steps:

  1. Enable the AppFlow feature on one or more Citrix NetScaler instances.

  2. Configure the AppFlow collector endpoint information on remote network devices. This AppFlow collector listens on the configured endpoint to receive and process flow records.

  3. Configure AppFlow actions and policies to export flow records to AppFlow collectors.


Note


The NetScaler connector supports Citrix ADC software version 11.1.51.26 and higher.


Flow Ingestion to Secure Workload

Flow ingestion is a network process that

  • gathers data from Citrix ADC devices,

  • utilizes Docker containers on Cisco Ingest appliances, and

  • registers as a NetScaler agent with the secure workload platform for analysis.

NetScaler connector is essentially a Citrix AppFlow (IPFIX) collector receiving flow records, stitching NATed flows, and forwarding them to Secure Workload for flow analysis. A NetScaler connector can be enabled on a Cisco Secure Workload Ingest appliance and runs as a Docker container. The NetScaler connector registers with Secure Workload as a Secure Workload NetScaler agent.


Note


NetScaler connector supports only IPFIX protocol.


Note


Each NetScaler connector should report flows only for one VRF. The flows exported by the connector are placed in the VRF based on the Agent VRF configuration in the Secure Workload cluster.

To configure the VRF for the connector, perform these steps:

  • Choose Manage > Agents.

  • Click the Configuration tab.

  • Under Agent Remote VRF Configurations section, click Create Config.

  • Provide the details such as the name of the VRF, IP subnet of the connector, and range of port numbers to send flow records to the cluster.


How to configure AppFlow on NetScaler

Set up AppFlow on Citrix NetScaler to enable traffic monitoring and reporting through IPFIX protocol packets.

Configure AppFlow on Citrix NetScaler by completing these steps:

Procedure

Step 1

Enable the AppFlow feature on your NetScaler.


     enable ns feature appflow

Step 2

Add AppFlow collector endpoints to receive records.

The collector receives the AppFlow records from NetScaler. Specify the IP and port of NetScaler connector enabled on a Secure Workload Ingest appliance as an AppFlow collector.


     add appflow collector c1 -IPAddress 172.26.230.173 -port 4739

Step 3

Configure an AppFlow action.

This lists the collectors that will get AppFlow records when the associated AppFlow policy matches.


     add appflow action a1 -collectors c1

Step 4

Configure an AppFlow policy.

This rule must match for an AppFlow record to be generated.


     add appflow policy p1 CLIENT.TCP.DSTPORT(22) a1
     add appflow policy p2 HTTP.REQ.URL.SUFFIX.EQ("jpeg") a1

Step 5

Bind AppFlow policy to virtual server.

Evaluate whether the traffic hitting the IP of the virtual server (VIP) matches the AppFlow policy. On a match, a flow record is generated and sent to all collectors listed in the associated AppFlow action.


     bind lb vserver lb1 -policyname p1 -priority 10

Step 6

Optionally, bind AppFlow policy globally (for all virtual servers).

An AppFlow policy can also be bound globally to all virtual servers. This policy applies to all traffic that flows through Citrix ADC.


     bind appflow global p2 1 NEXT -type REQ_DEFAULT

Step 7

Optionally, template refresh interval.

The default value for template refresh is 60 seconds.

     set appflow param -templatereferesh 60

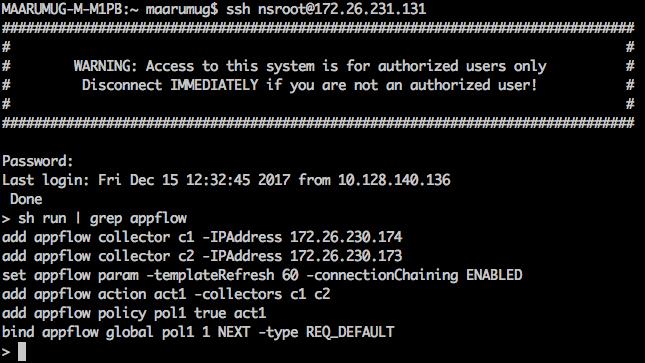
These steps configure AppFlow on Citrix NetScaler load balancer to export IPFIX protocol packets for traffic going through NetScaler. The flow records will be sent to either 172.26.230.173:4739 (for traffic going through vserver lb1) and to 172.26.230.184:4739 (for all traffic going through the NetScaler). Each flow record includes 5 tuple information of the traffic and the byte/packet count of the flow.

Figure 6. Running configuration of AppFlow on Citrix NetScaler load balancer
Running configuration of AppFlow on Citrix NetScaler load balancer

For more information, refer to Configuring AppFlow.


How to configure the connector

A connector is a network device that

  • allows specific log configurations,

  • update listening ports on the IPFIX protocol,

  • has identifiable connector IDs

For information about required virtual appliances, refer to Virtual Appliances for Connectors. The following configurations are allowed on the connector.

For more information, refer to Log Configuration .

To update the listening ports of IPFIX protocol on the connector, use the allowed command on the Docker container in Secure Workload Ingest appliance. This command is issued on the appliance by providing the connector ID, the type of port to be updated, and the new port information. The connector ID is available on the connector page in the Secure Workload user interface. For more information, see update-listening-ports.

Limits
Table 2. Limits

Metric

Limit

Maximum number of NetScaler connectors on one Secure Workload Ingest appliance

3

Maximum number of NetScaler connectors on one Tenant (rootscope)

10

Maximum number of NetScaler connectors on Secure Workload

100

Cisco Secure Firewall Connector

Definition:

The Cisco Secure Firewall Connector (formerly known as the ASA Connector) is a flow ingestion solution that

  • allows Secure Workload to ingest flow observations from Secure Firewall ASA (formerly Cisco ASA) and Secure Firewall Threat Defense (formerly Firepower Threat Defense or FTD),

  • eliminates the need for hosts to run software agents because Cisco switches relay NetFlow Secure Event Logging (NSEL) records to the connector for processing, and

  • is hosted in a Secure Workload Ingest appliance for processing.
Starting with Secure Workload Release 4.0, a second connector variant is available:

  • Cisco Secure Firewall Connector (On-Premises): The original connector that integrates with an on-premises FMC or directly with Secure Firewall ASA and FTD devices. Requires manual credential entry and Secure Connector deployment.

  • cdFMC Connector (Cloud-Delivered): A new cloud-based variant that integrates with a Cloud-Delivered FMC (cdFMC) managed through Cisco Security Cloud Control (SCC). Provides zero-touch onboarding with no credentials or Secure Connector required. See Cloud-Delivered Firewall Management Center (cdFMC) Connector.

NetFlow Secure Event Logging Details

Cisco Secure Firewall ASA NetFlow Secure Event Logging (NSEL) provides a stateful, IP flow monitoring that exports significant events in a flow to a NetFlow collector. When an event causes a state change on a flow, an NSEL event is triggered that sends the flow observation along with the event that caused the state change to the NetFlow collector. The flow collector receives these flow records and stores them in their flow storage for offline querying and analysis.

Typically, the setup involves the following steps:

  1. Enable NSEL on Secure Firewall ASA and/or Secure Firewall Threat Defense (FTD).

  2. Configure the connector endpoint information on Secure Firewall ASA and/or FTD. The connector listens on the configured endpoint to receive and process NSEL records.


Note


For customers who have migrated their FMC to the cloud and use Cisco Security Cloud Control (SCC), the cdFMC Connector is the recommended choice. Customers with only on-premises FMC deployments should continue to use the Cisco Secure Firewall Connector.


Cloud-Delivered Firewall Management Center Connector
Definition:

The Cloud-Delivered Firewall Management Center (cdFMC) connector is a cloud-native enhancement to Cisco Secure Workload that

  • integrates with a Cloud-Delivered Firewall Management Center (cdFMC) instance provisioned and managed through Cisco Security Cloud Control (SCC),

  • eliminates the need for manual credential entry, hostname configuration, or Secure Connector deployment because both and cdFMC operate within the same SCC organization, and

  • provides the same flow ingestion and enforcement functionality as the existing Cisco Secure Firewall Connector after onboarding is complete.

Cisco Security Cloud Control (SCC) and cdFMC

Cisco Security Cloud Control (SCC) is Cisco's unified cloud management platform. When both Secure Workload and Cisco Secure Firewall Management Center are subscribed and operational within the SCC organization, Secure Workload can automatically discover and connect to the cdFMC instance without requiring any additional credentials or network tunneling.


Note


The cdFMC connector is available post Cisco Secure Workload Release 4.0.4.17.


cdFMC connector vs. Cisco Secure Firewall connector
Definition:

The cdFMC Connector and the Cisco Secure Firewall Connector share identical post-onboarding functionality but differ in their deployment model and onboarding experience. The following table summarizes the key differences:

Attribute

Cisco Secure Firewall Connector (On-Premises)

cdFMC Connector (Cloud-Delivered)

FMC Deployment

On-premises FMC

Cloud-hosted FMC via SCC

Onboarding Method

Manual—requires entering hostname, port, and credentials Automatic—auto-discovered within the same SCC organization

Credentials Required

Yes No

Secure Connector Required

Yes (for connectivity) No (cloud-native connectivity)

Supported Customers

Customers with on-premises FMC who have not migrated to cloud Customers with cdFMC enabled on SCC

Post-Onboarding Functionality

Full flow ingestion, enforcement, and policy management Identical to on-premises FMC connector
Choosing the Right Connector

Use the following guidance to select the appropriate connector for your deployment:

  • If your Firewall Management Center is deployed on-premises and you have not subscribed to Cisco Security Cloud Control (SCC), use the Cisco Secure Firewall Connector.

  • If your Firewall Management Center is cloud-delivered through SCC and is in the same SCC organization, use the cdFMC Connector for automated, zero-touch integration.


Note


Both connectors can coexist within the same Cisco Secure Workload tenant to support hybrid deployments.


How to configure the connector
Definition:

The configuration process differs between the two connector variants only during the initial onboarding step. All post-onboarding configuration options are identical. For information about required virtual appliances, refer the Virtual Appliances for Connectors section.

Cisco Secure Firewall Connector (On-Premises)

Use this procedure for customers with an on-premises Cisco Secure Firewall Management Center (FMC) who have not yet migrated to Cisco Security Cloud Control (SCC).

  1. From the Secure Workload navigation pane, choose Manage > Workloads > Connectors.

  2. Click New Connector and select Cisco Secure Firewall.

  3. Manually enter the FMC hostname or IP address, port number, and authentication credentials.

  4. Deploy a Secure Connector client to establish connectivity between Secure Workload and the on-premises FMC.

  5. Complete the configuration and click Apply.

After the onboarding, configure connector logging settings. For more information, refer Log Configuration.

In addition, the listening ports of the connector can be updated on the Docker container in the Secure Workload Ingest appliance using the allowed update-listening-ports command. Provide the connector ID (found on the connector page in the Secure Workload UI, the type of port to update, and the new port information.

Use this procedure for customers with cdFMC enabled on Cisco Security Cloud Control (SCC). The onboarding is automated when both Secure Workload and cdFMC are in the same SCC organization.

  1. From the Secure Workload navigation pane, choose Manage > Workloads > Connectors.

  2. Click New Connector and select Cisco Secure Firewall.

  3. Click Create. Secure Workload automatically discovers the cdFMC instance within the same SCC organization and populates all connection details, including hostname and port. No credentials or manual network configuration are required.

  4. Review the auto-populated configuration and confirm.


Note


A Secure Connector client is not required for the cdFMC Connector. Because both Secure Workload and cdFMC are cloud services operating within the same SCC organization, connectivity is established natively within the cloud platform.


After the onboarding, configure connector logging settings. For more information, refer the Log Configuration section.

In addition, the listening ports of the connector can be updated on the Docker container in the Secure Workload ingest appliance using the allowed update-listening-ports command. Provide the connector ID (found on the connector page in the Secure Workload UI, the type of port to update, and the new port information.

Flow ingestion to Secure Workload
Definition:

Both the Cisco Secure Firewall Connector and the cdFMC Connector are essentially NetFlow collectors. Each connector

  • receives NSEL records from Secure Firewall ASA and/or Secure Firewall Threat Defense (FTD) devices,

  • forwards the flow observations to Cisco Secure Workload for flow analysis,

  • can be enabled on a Secure Workload Ingest appliance and runs as a Docker container,

  • registers with Secure Workload as a Secure Workload agent,

  • decapsulates the NSEL protocol packets (flow records) and processes and reports the flows like a regular Secure Workload agent, and

  • does not report any process or interface information, unlike a Deep Visibility Agent

    .
Forward Flow Observation

Note


Both the Cisco Secure Firewall Connector and the cdFMC Connector support the NetFlow v9 protocol.


Note


Each connector (Cisco Secure Firewall Connector or cdFMC Connector) should report only flows for one VRF. The flows exported by the connector are placed into the VRF based on the Agent VRF configuration in the Secure Workload cluster.

To configure the VRF for the connector, navigate to Manage > Agentsand click the Configuration tab. Under the Agent Remote VRF Configurations section, click Create Config and provide the following details:

  • Name of the VRF

  • IP subnet of the connector

  • Range of port numbers that can potentially send flow records to the cluster


NSEL flow records are bidirectional. Each connector sends both a forward flow and a reverse flow to Secure Workload. The following table shows the NSEL element mappings for the forward flow:

Field NSEL Element ID NSEL Element Name
Protocol 4 NF_F_PROTOCOL
Source Address (IPv4) 8 NF_F_SRC_ADDR_IPV4
Source Address (IPv6) 27 NF_F_SRC_ADDR_IPV6
Source Port 7 NF_F_SRC_PORT
Destination Address (IPv4) 12 NF_F_DST_ADDR_IPV4
Destination Address (IPv6) 28 NF_F_DST_ADDR_IPV6
Destination Port 11 NF_F_DST_PORT
Flow Start Time 152 NF_F_FLOW_CREATE_TIME_MSEC
Byte Count 231 NF_F_FWD_FLOW_DELTA_BYTES
Packet Count 298 NF_F_FWD_FLOW_DELTA_PACKETS
Field NSEL Element ID NSEL Element Name
Protocol 4 NF_F_PROTOCOL
Source Address (IPv4) 12 NF_F_DST_ADDR_IPV4
Source Address (IPv6) 28 NF_F_DST_ADDR_IPV6
Source Port 11 NF_F_DST_PORT
Destination Address (IPv4) 8 NF_F_SRC_ADDR_IPV4
Destination Address (IPv6) 27 NF_F_SRC_ADDR_IPV6
Destination Port 7 NF_F_SRC_PORT
Flow Start Time 152 NF_F_FLOW_CREATE_TIME_MSEC
Byte Count 232 NF_F_REV_FLOW_DELTA_BYTES
Packet Count 299 NF_F_REV_FLOW_DELTA_PACKETS
Flow ingestion to Secure Workload
Definition:

Both the Cisco Secure Firewall Connector and the cdFMC Connector are essentially NetFlow collectors. Each connector

  • receives NSEL records from Secure Firewall ASA and/or Secure Firewall Threat Defense (FTD) devices,

  • forwards the flow observations to Cisco Secure Workload for flow analysis,

  • can be enabled on a Secure Workload Ingest appliance and runs as a Docker container,

  • registers with Secure Workload as a Secure Workload agent,

  • decapsulates the NSEL protocol packets (flow records) and processes and reports the flows like a regular Secure Workload agent, and

  • does not report any process or interface information, unlike a Deep Visibility Agent

    .
Forward Flow Observation

Note


Both the Cisco Secure Firewall Connector and the cdFMC Connector support the NetFlow v9 protocol.


Note


Each connector (Cisco Secure Firewall Connector or cdFMC Connector) should report only flows for one VRF. The flows exported by the connector are placed into the VRF based on the Agent VRF configuration in the Secure Workload cluster.

To configure the VRF for the connector, navigate to Manage > Agentsand click the Configuration tab. Under the Agent Remote VRF Configurations section, click Create Config and provide the following details:

  • Name of the VRF

  • IP subnet of the connector

  • Range of port numbers that can potentially send flow records to the cluster


NSEL flow records are bidirectional. Each connector sends both a forward flow and a reverse flow to Secure Workload. The following table shows the NSEL element mappings for the forward flow:

Field NSEL Element ID NSEL Element Name
Protocol 4 NF_F_PROTOCOL
Source Address (IPv4) 8 NF_F_SRC_ADDR_IPV4
Source Address (IPv6) 27 NF_F_SRC_ADDR_IPV6
Source Port 7 NF_F_SRC_PORT
Destination Address (IPv4) 12 NF_F_DST_ADDR_IPV4
Destination Address (IPv6) 28 NF_F_DST_ADDR_IPV6
Destination Port 11 NF_F_DST_PORT
Flow Start Time 152 NF_F_FLOW_CREATE_TIME_MSEC
Byte Count 231 NF_F_FWD_FLOW_DELTA_BYTES
Packet Count 298 NF_F_FWD_FLOW_DELTA_PACKETS
Field NSEL Element ID NSEL Element Name
Protocol 4 NF_F_PROTOCOL
Source Address (IPv4) 12 NF_F_DST_ADDR_IPV4
Source Address (IPv6) 28 NF_F_DST_ADDR_IPV6
Source Port 11 NF_F_DST_PORT
Destination Address (IPv4) 8 NF_F_SRC_ADDR_IPV4
Destination Address (IPv6) 27 NF_F_SRC_ADDR_IPV6
Destination Port 7 NF_F_SRC_PORT
Flow Start Time 152 NF_F_FLOW_CREATE_TIME_MSEC
Byte Count 232 NF_F_REV_FLOW_DELTA_BYTES
Packet Count 299 NF_F_REV_FLOW_DELTA_PACKETS
Handle NetFlow records

Based on the NetFlow record, Meraki connector sends flow observation to Secure Workload. Meraki NetFlow flow records are bidirectional. So, Meraki connector sends 2 flows: forward flow and reverse flow to Secure Workload.

Here are the details about flow observation sent by Meraki connector to Secure Workload.

Forward flow observation

Field

Element ID

Element Name

Protocol

4

protocolIdentifier

Source Address

8

sourceIPv4Address

Source Port

7

sourceTransportPort

Destination Address

12

destinationIPv4Address

Destination Port

11

destinationTransportPort

Byte Count

1

octetDeltaCount

Packet Count

2

packetDeltaCount

Flow Start Time

Set based on when the NetFlow record for this flow is received on the connector

Reverse flow information

Field

Element ID

Protocol

4

protocolIdentifier

Source Address

8

sourceIPv4Address

Source Port

7

sourceTransportPort

Destination Address

12

destinationIPv4Address

Destination Port

11

destinationTransportPort

Byte Count

23

postOctetDeltaCount

Packet Count

24

postPacketDeltaCount

Flow Start Time

Set based on when the NetFlow

record for this flow is received on the connector

Handle NetFlow records

Based on the NetFlow record, Meraki connector sends flow observation to Secure Workload. Meraki NetFlow flow records are bidirectional. So, Meraki connector sends 2 flows: forward flow and reverse flow to Secure Workload.

Here are the details about flow observation sent by Meraki connector to Secure Workload.

Forward flow observation

Field

Element ID

Element Name

Protocol

4

protocolIdentifier

Source Address

8

sourceIPv4Address

Source Port

7

sourceTransportPort

Destination Address

12

destinationIPv4Address

Destination Port

11

destinationTransportPort

Byte Count

1

octetDeltaCount

Packet Count

2

packetDeltaCount

Flow Start Time

Set based on when the NetFlow record for this flow is received on the connector

Reverse flow information

Field

Element ID

Protocol

4

protocolIdentifier

Source Address

8

sourceIPv4Address

Source Port

7

sourceTransportPort

Destination Address

12

destinationIPv4Address

Destination Port

11

destinationTransportPort

Byte Count

23

postOctetDeltaCount

Packet Count

24

postPacketDeltaCount

Flow Start Time

Set based on when the NetFlow

record for this flow is received on the connector

Configure the connector

For information about required virtual appliances, see Virtual Appliances for Connectors. This reference provides configuration options available on the connector. For more information, refer Log Configuration .

In addition, the listening ports of IPFIX protocol on the connector can be updated on the Docker container in Secure Workload Ingest appliance using a an allowed command. This command can be issued on the appliance by providing the connector ID of the connector, type of the port to be update, and the new port information. The connector ID can be found on the connector page in Secure Workload UI. For more information, see update-listening-ports.

Meraki connector

A Meraki connector is a network device that:

  • Enables Secure Workload to ingest flow observations from Meraki firewalls.

  • Facilitates the process without the need for software agents on hosts.

  • Relays NetFlow records to an Ingest appliance for processing.

Figure 7. Meraki connector
Meraki connector
What is NetFlow

A NetFlow protocol is a network monitoring standard that:

  • allows aggregation of traffic data by network devices,

  • enables export of flow data to collectors for storage, and

  • assists in offline querying and analysis of network traffic.

For more information, refer to Meraki Firewall.

Set up the system by completing these steps:

  1. Enable NetFlow statistics reporting on Meraki Firewall.

  2. Configure the Meraki Firewall with the endpoint information for NetFlow collectors.

Flow ingestion to Secure Workload

A Meraki connector is a NetFlow collector that:

  • Receives flow records from the configured Meraki firewalls to export NetFlow traffic statistics.

  • Processes the NetFlow records.

  • Sends the flow observations reported by Meraki firewalls to Secure Workload for flow analysis.

You can enable a Meraki connector on a Secure Workload Ingest appliance and run it as a Docker container.

The Meraki connector registers with Secure Workload as a Secure Workload Meraki agent. It decapsulates the NetFlow protocol packets, processes and reports flows as a regular Secure Workload agent. Unlike a Deep Visibility Agent, it does not report any process or interface information.


Note


The Meraki connector supports the NetFlow v9 protocol.


Note


Each Meraki connector should report flows for a single VRF. The flows exported by the connector are placed in the VRF based on the Agent VRF configuration in Secure Workload cluster.

To configure the VRF for the connector, complete these steps:

  1. Choose Manage > Agents.

  2. Click the Configuration tab.

  3. Under the Agent Remote VRF Configurations section, click Create Config.

  4. Provide the VRF name, IP subnet of the connector, and a range of port numbers that can send flow records to the cluster.


Handling NetFlow Records

Based on the NetFlow record, Meraki connector sends flow observation to Secure Workload. Meraki NetFlow flow records are bidirectional. So, Meraki connector sends 2 flows: forward flow and reverse flow to Secure Workload.

Here are the details about flow observation sent by Meraki connector to Secure Workload.

Forward Flow observation

Field

Element ID

Element Name

Protocol

4

protocolIdentifier

Source Address

8

sourceIPv4Address

Source Port

7

sourceTransportPort

Destination Address

12

destinationIPv4Address

Destination Port

11

destinationTransportPort

Byte Count

1

octetDeltaCount

Packet Count

2

packetDeltaCount

Flow Start Time

Set based on when the NetFlow record for this flow is received on the connector

Reverse Flow Information

Field

Element ID

Protocol

4

protocolIdentifier

Source Address

8

sourceIPv4Address

Source Port

7

sourceTransportPort

Destination Address

12

destinationIPv4Address

Destination Port

11

destinationTransportPort

Byte Count

23

postOctetDeltaCount

Packet Count

24

postPacketDeltaCount

Flow Start Time

Set based on when the NetFlow

record for this flow is received on the connector

How to configure NetFlow on Meraki firewall

you set up NetFlow traffic reporting on the Meraki Firewall by configuring specific settings via the Meraki UI console.

Follow these steps to configure NetFlow reporting on the Meraki firewall.

Procedure

Step 1

Log in to the Meraki UI console.

Step 2

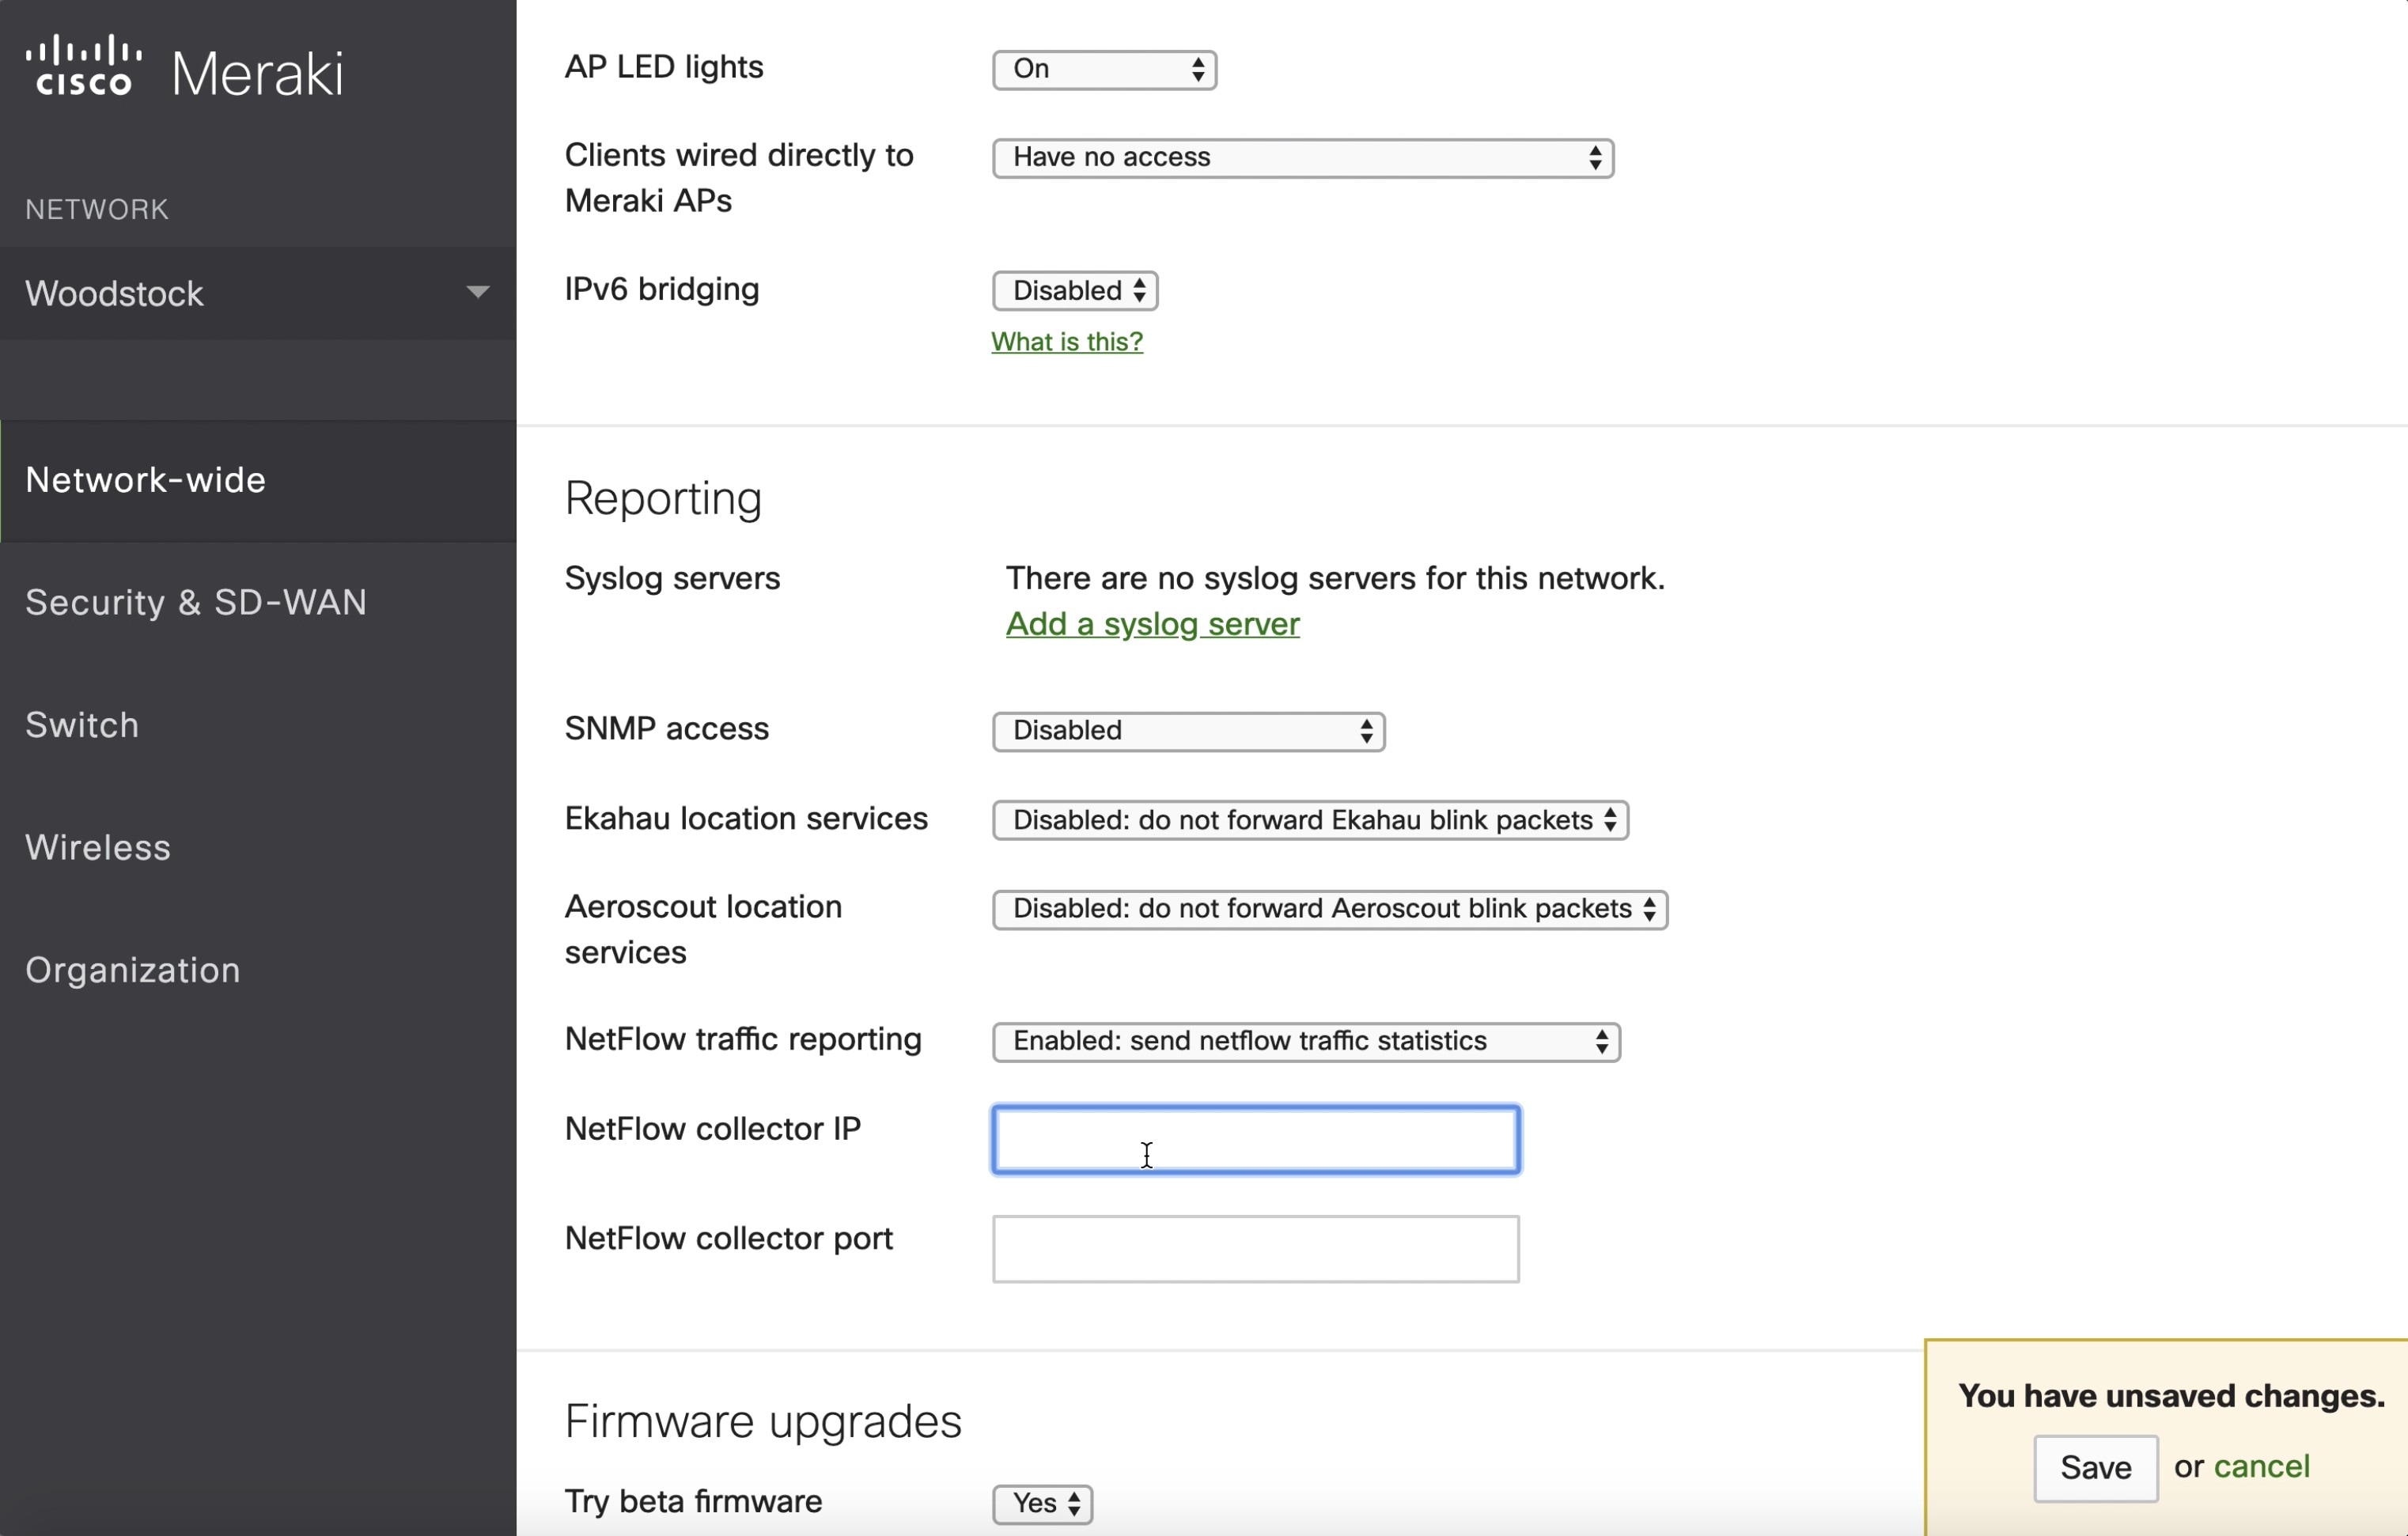
Choose Network-wide > General. In Reporting settings, enable NetFlow traffic reporting and ensure that it is set to Enabled: send NetFlow traffic statistics.

Step 3

Configure the NetFlow collector IP and NetFlow collector port to point to the IP and port where the Meraki connector listens on the Secure Workload Ingest appliance.

Note


Default port on which Meraki connector listens for NetFlow records is 4729.

Step 4

Save the changes.

Figure 8. Enabling NetFlow on a Meraki Firewall
Enabling NetFlow on a Meraki Firewall

How to configure the connector

A connector is a configuration tool that

  • allows specific authorized configurations,

  • enables updates to listening ports, and

  • provides necessary integration with virtual appliances.

For information about required virtual appliances, refer to Virtual Appliances for Connectors.

For more information, refer to Log Configuration .

Listening ports of NetFlow v9 protocol on the connector can be updated on the Docker container in Secure Workload Ingest appliance using authorized command. This involves providing the connector ID, type of the port to be update, and the new port information. You can find the connector ID on the connector page in the Secure Workload user interface. For more information, see update-listening-ports.

Limits

Metric

Limit

Maximum number of Meraki connectors on one Secure Workload Ingest appliance

1

Maximum number of Meraki connectors on one Tenant (rootscope)

10

Maximum number of Meraki connectors on Secure Workload

100

ERSPAN Connector

An ERSPAN connector is a network tool that

  • Enables Cisco Secure Workload to ingest flow observations.

  • Eliminates the need for hosts to run software agents.

  • Relies on Cisco switches to relay host traffic for processing.

ERSPAN connectors streamline the flow observation process by efficiently ingesting network traffic from hosts without additional software layers. This approach enhances network efficiency and reduces dependency on host configurations.

The development of ERSPAN connectors also supports better traffic management, enabling seamless integration with existing Cisco systems.

What is ERSPAN

A ERSPAN is a network feature that

  • mirrors frames observed by network devices,

  • encapsulates them into IP packets, and

  • sends the packets to a remote traffic analyzer.

Encapsulated Remote Switch Port Analyzers typically involve these steps:

  • Configure monitoring sessions for source ERSPAN on network devices.

  • Use a remote network device that is directly connected to a traffic analyzer for destination monitoring.

The Secure Workload ERSPAN connector provides destination ERSPAN session and traffic analyzer functionalities, negating the need to configure destination sessions on the switches with the Secure Workload solution.

What are the SPAN agents

A SPAN agent is a network monitoring component that

  • registers with each ERSPAN connector within a cluster,

  • processes only ERSPAN packets, and

  • performs traffic analysis without interface or process reporting like regular agents do.

Like Cisco destination ERSPAN sessions, SPAN agents decapsulate the mirrored frames. Then, they process and report the flows like a regular Secure Workload agent. SPAN agents differ from Deep Visibility Agents by not reporting process or interface information.

What is the ingest appliance for ERSPAN

An ingest appliance for ERSPAN is a virtual machine (VM) that

  • internally runs three ERSPAN Secure Workload connectors

  • uses the same OVA or QCOW2 as a standard Ingest appliance

  • assigns one vNIC and two vCPU cores to each connector without a limiting quota.

Each connector operates inside a dedicated Docker container to register a SPAN agent with the cluster. The container hostname is formatted as <VM hostname>-<interface IP address>. Connectors and agents are maintained upon VM, Docker daemon, or Docker container crashes/reboots.


Note


The ERSPAN connector’s status is reported on the Connector page. Check to the Agent List page and review the corresponding SPAN agent's state.


For more information on the required virtual appliances, refer to Virtual Appliances for Connectors. ERSPAN connectors support IPv4 and IPv6 addresses in dual stack mode, though dual stack support is currently a beta feature.

How to configure the source ERSPAN session

A source ERSPAN session is a network feature that

  • allows the mirroring of ingress and egress frames on an interface,

  • uses GRE packets to transport mirrored frames,

  • and requires a source and destination IP address.

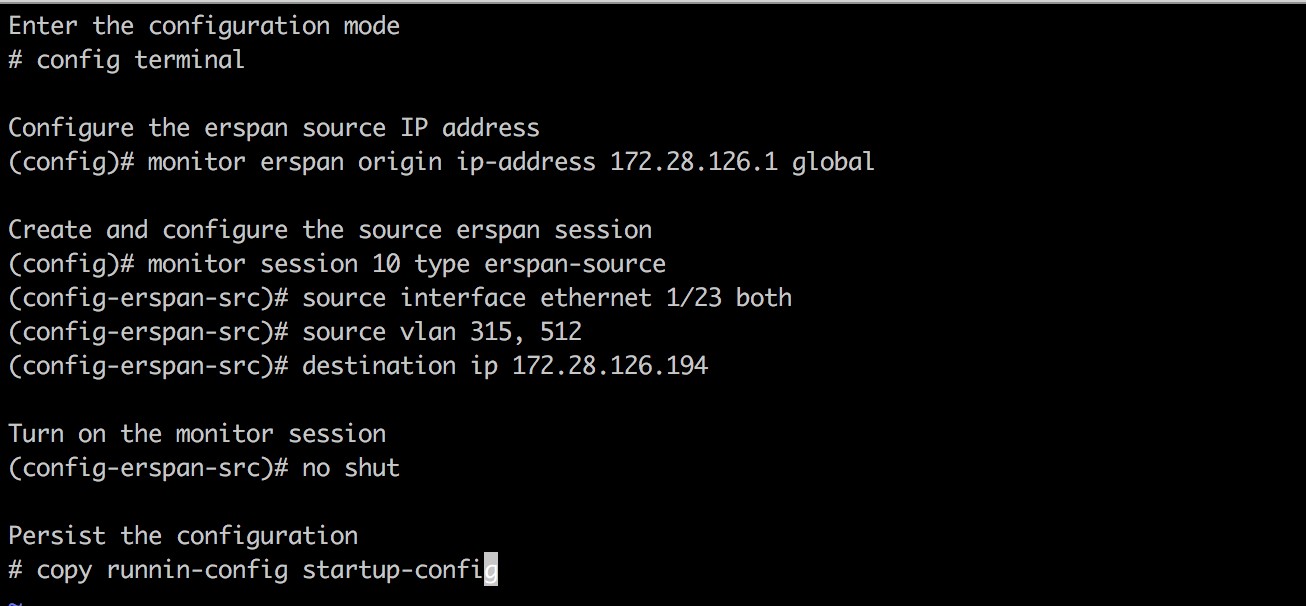
When configuring a source ERSPAN session on a Cisco Nexus 9000 switch, follow platform-specific configurations which you can find in the Cisco Secure Workload User Guide. Ensure that the L3 interface on the switch is the source and matches the IP address on the ERSPAN VM.

Figure 9. Configuring ERSPAN source on Cisco Nexus 9000
Configuring ERSPAN source on Cisco Nexus 9000

You create a source ERSPAN session with ID 10. The switch mirrors the frames ingressing and egressing (both) the interface eth1/23 and those on VLANs 315 and 512. The outer GRE packet carrying the mirrored frame will have source IP 172.28.126.1 (must be the address of a L3 interface on this switch) and destination IP 172.28.126.194. This is one of the IP addresses configured on the ERSPAN VM.

Supported ERSPAN formats

The Secure Workload SPAN Agents can process ERSPAN type I, II, and III packets as described in the proposed ERSPAN RFC. SPAN agents process ERSPAN packets generated by Cisco devices and, among non-RFC compliant formats, those generated by VMware vSphere Distributed Switch (VDS).

Performance considerations when configuring ERSPAN source

An ERSPAN source is a configuration aspect of ERSPAN that:

  • Selects port/VLAN lists carefully to avoid overwhelming the SPAN agent.

  • Utilizes Access Control List (ACL) policies for fine-grained frame selection.

  • Allows for MTU modifications to manage bandwidth without affecting SPAN agent processing load.

The ERSPAN source session can modify the Maximum Transport Unit (MTU) of the ERSPAN packet, which commonly defaults to 1500 bytes. Decreasing the MTU will limit ERSPAN bandwidth usage without affecting the SPAN Agent load, as the agent’s workload is on a per-packet basis. Reduce the MTU to make a 160-byte allowance for the mirrored frame. For more information on ERSPAN header overhead, review the proposed ERSPAN RFC.

Three versions of ERSPAN exist, each providing varying overhead and functionalities such as QOS policies on versions II and III. The smaller the version, the lower the ERSPAN header overhead. Version II and III allow for applying QOS policies to the ERSPAN packets, and provide some VLAN info. Version III carries even more settings. Cisco switches default to Version II, while Secure Workload SPAN Agents support all versions, although they do not utilize extra information from ERSPAN versions II and III packets.

Security considerations

The Ingest Virtual Machine for ERSPAN uses CentOS 7.9, from which OpenSSL server/clients packages were removed.


Note


CentOS 7.9 is the guest operating system for Ingest and Edge virtual appliances in Secure Workload 3.8.1.19 and earlier releases. For releases starting from 3.8.1.36, it transitions to AlmaLinux 9.2.


After booting the VM and deploying the SPAN agent containers, all network interfaces except the loopback are unavailable, so the console remains the only access method.

Agent and Container Configuration

The VM network interfaces are encapsulated within Docker containers that use a centos:7.9.2009 based Docker image with no open TCP/UDP ports.

Containers run with base privileges, have added NET_ADMIN capabilities, and do not use the --privileged option.

Security Implications

In a container is compromised, guest OS security remains intact.

The same security measures applicable to other Agents in Secure Workload apply to the Secure Workload SPAN Agents within Docker containers.

Troubleshooting

When SPAN Agents show as active in the cluster Monitoring/Agent Overview page, no action is needed on the ERSPAN Virtual Machine. Users do not need to log in to it. If the SPAN Agents do not show as active or the flows are not reported to the cluster, this information will help pinpoint deployment problems.

Under normal conditions on the VM, these conditions should be verified:

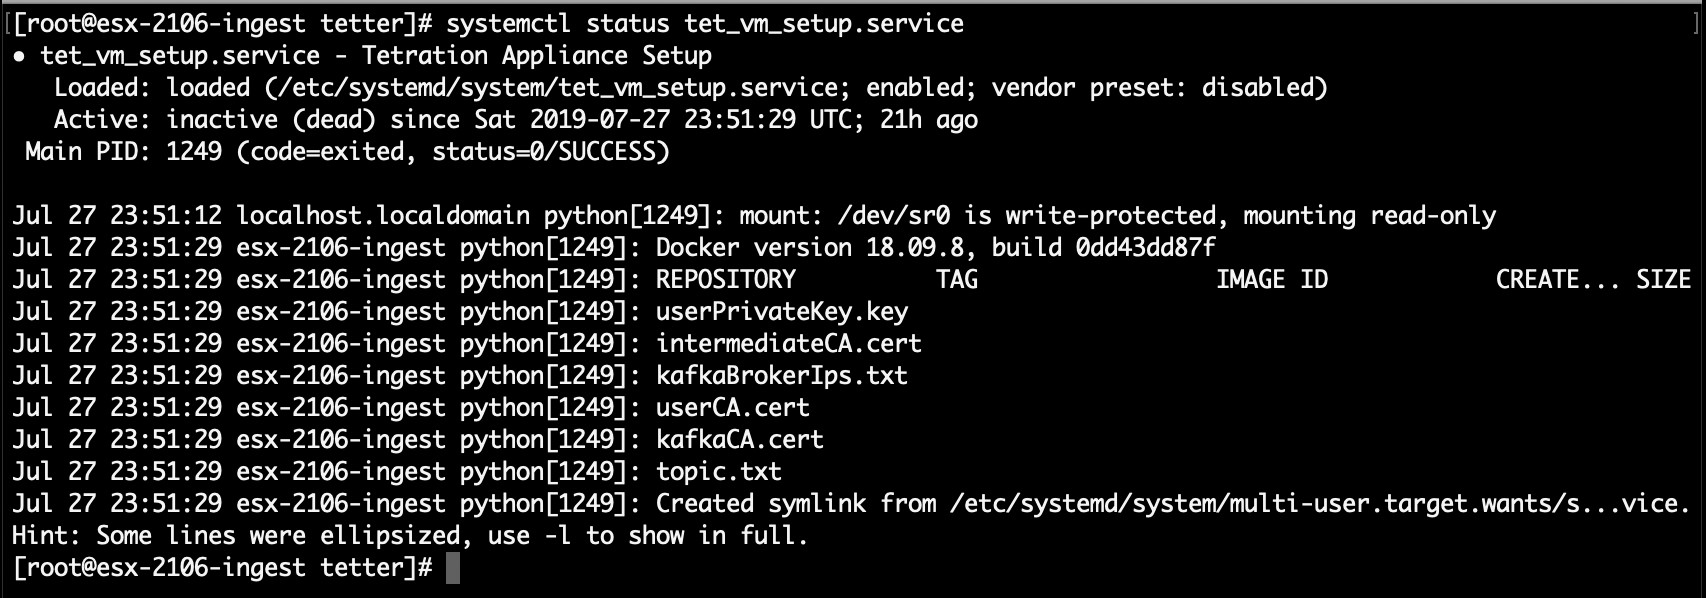
  • systemctl status tet_vm_setup reports an inactive service with SUCCESS exit status;

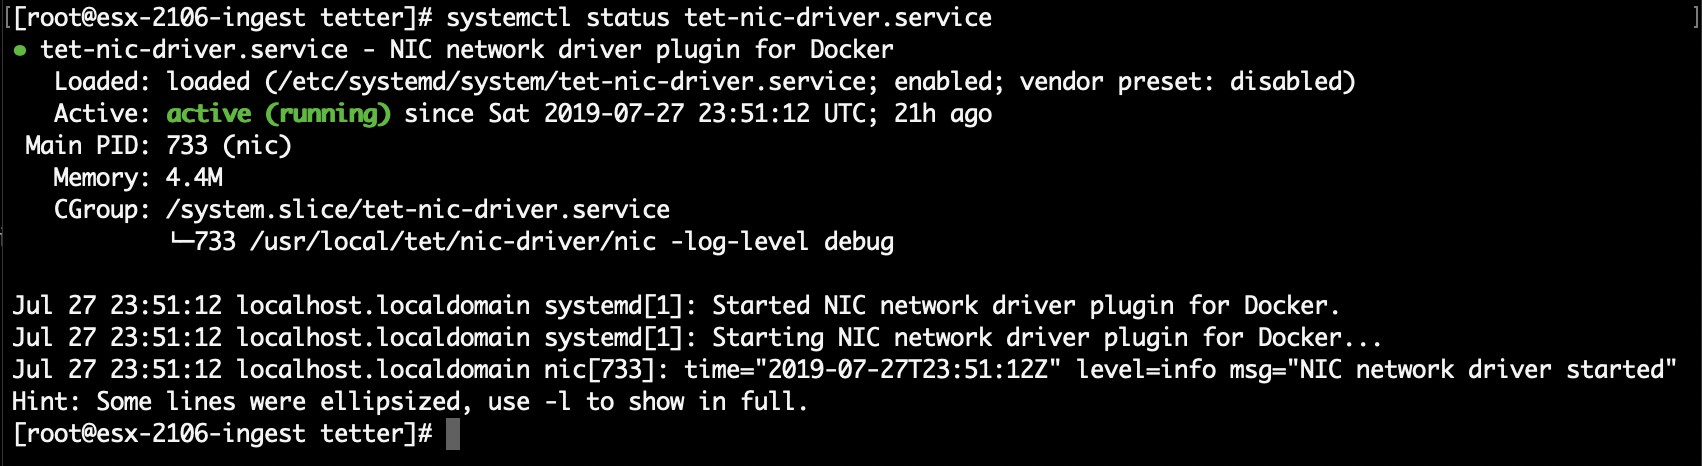
  • systemctl status tet-nic-driver reports an active service;

  • docker network ls reports five networks including host, none and three erspan-<iface name>;

  • ip link only reports the loopback interface;

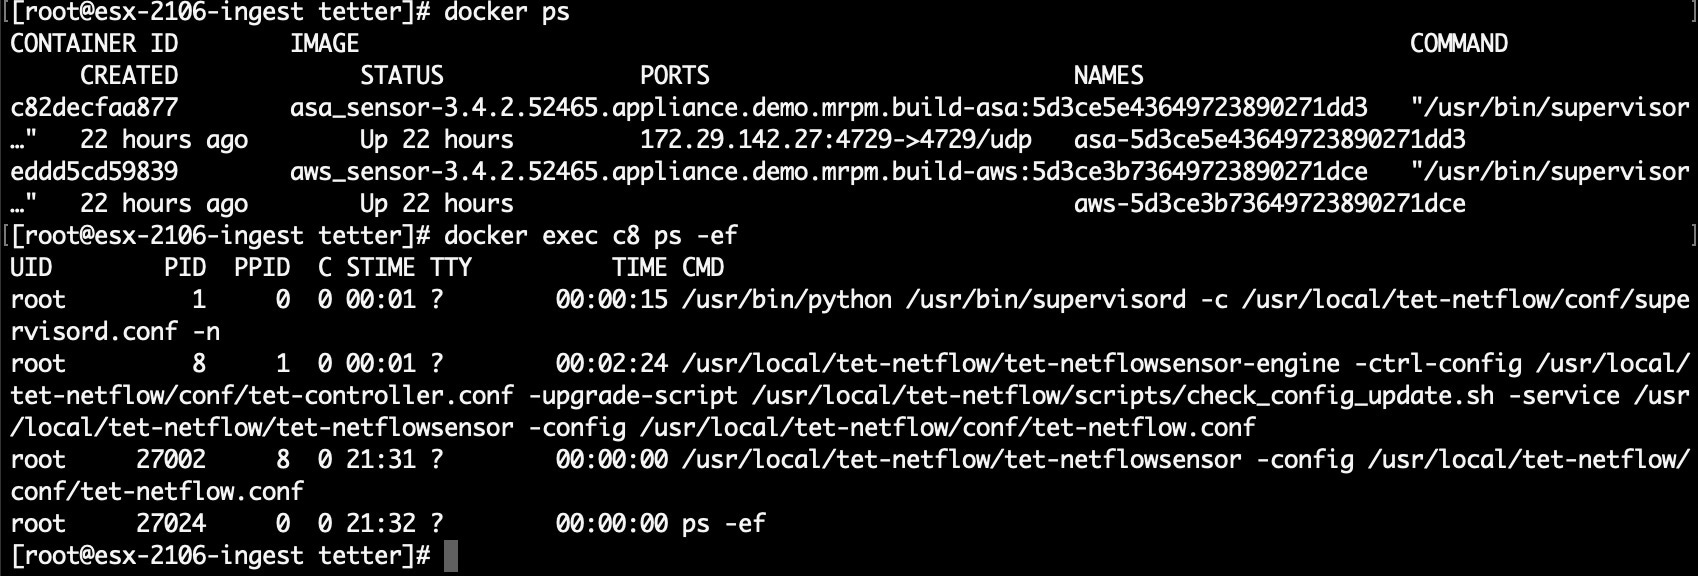
  • docker ps reports three running containers;

  • docker logs <cid> for each container contains the message:INFO success: tet-sensor entered RUNNING state, process has stayed up for > than 1 seconds (startsecs)

  • docker exec <cid> ifconfig reports only one interface, besides the loopback;

  • docker exec <cid> route -n reports the default gateway;

  • docker exec <cid> iptables -t raw -S PREROUTING reports the rule: -A PREROUTING -p gre -j DROP;

In the case of discrepancies, check the deployment script logs in /local/tetration/logs/ tet_vm_setup.log.

For further agent troubleshooting:

  • Use docker exec <cid> ps -ef, which reports two instances of tet-engine, tet-engine check_conf and two /usr/local/tet/tet-sensor -f /usr/local/tet/conf/.sensor_config instances, one with root user and other with tet-sensor user, along with the process manager /usr/bin/ python /usr/bin/supervisord -c /etc/supervisord.conf -n instance.

  • Use docker exec <cid> cat /usr/local/tet/log/tet-sensor.log to view the agent’s logs;

  • Use docker exec <cid> cat /usr/local/tet/log/fetch_sensor_id.log to view the agent’s registration logs;

  • Use docker exec <cid> cat /usr/local/tet/log/check_conf_update.log to view the configuration update polling logs;

    Use tcpdump in the container’s network namespace to monitor traffic.

    To monitor specific container traffic:

    1. Retrieve the container’s network namespace (SandboxKey) using docker inspect <cid> | grep SandboxKey;

    2. Enter the container’s network namespace with nsenter --net=/var/run/docker/netns/...;

    3. Use tcpdump -i eth0 -n to monitor eth0 traffic.

Limits

Metric

Limit

Maximum number of ERSPAN connectors on one Secure Workload Ingest appliance

3

Maximum number of ERSPAN connectors on one Tenant (rootscope)

24 (12 for TaaS)

Maximum number of ERSPAN connectors on Secure Workload

450

Connectors for endpoints

Connectors for endpoints provide endpoint context for Secure Workload.

Connector

Description

Deployed on Virtual Appliance

AnyConnect

Collects telemetry data from Cisco AnyConnect Network Visibility Module (NVM) and enriches endpoint inventories with user attributes

Secure Workload Ingest

ISE

Collects information about endpoints and inventories managed by Cisco ISE appliances and enriches endpoint inventories with user attributes and secure group labels (SGL).

Secure Workload Edge

For more information about required virtual appliances, refer to Virtual Appliances for Connectors.

AnyConnect connector

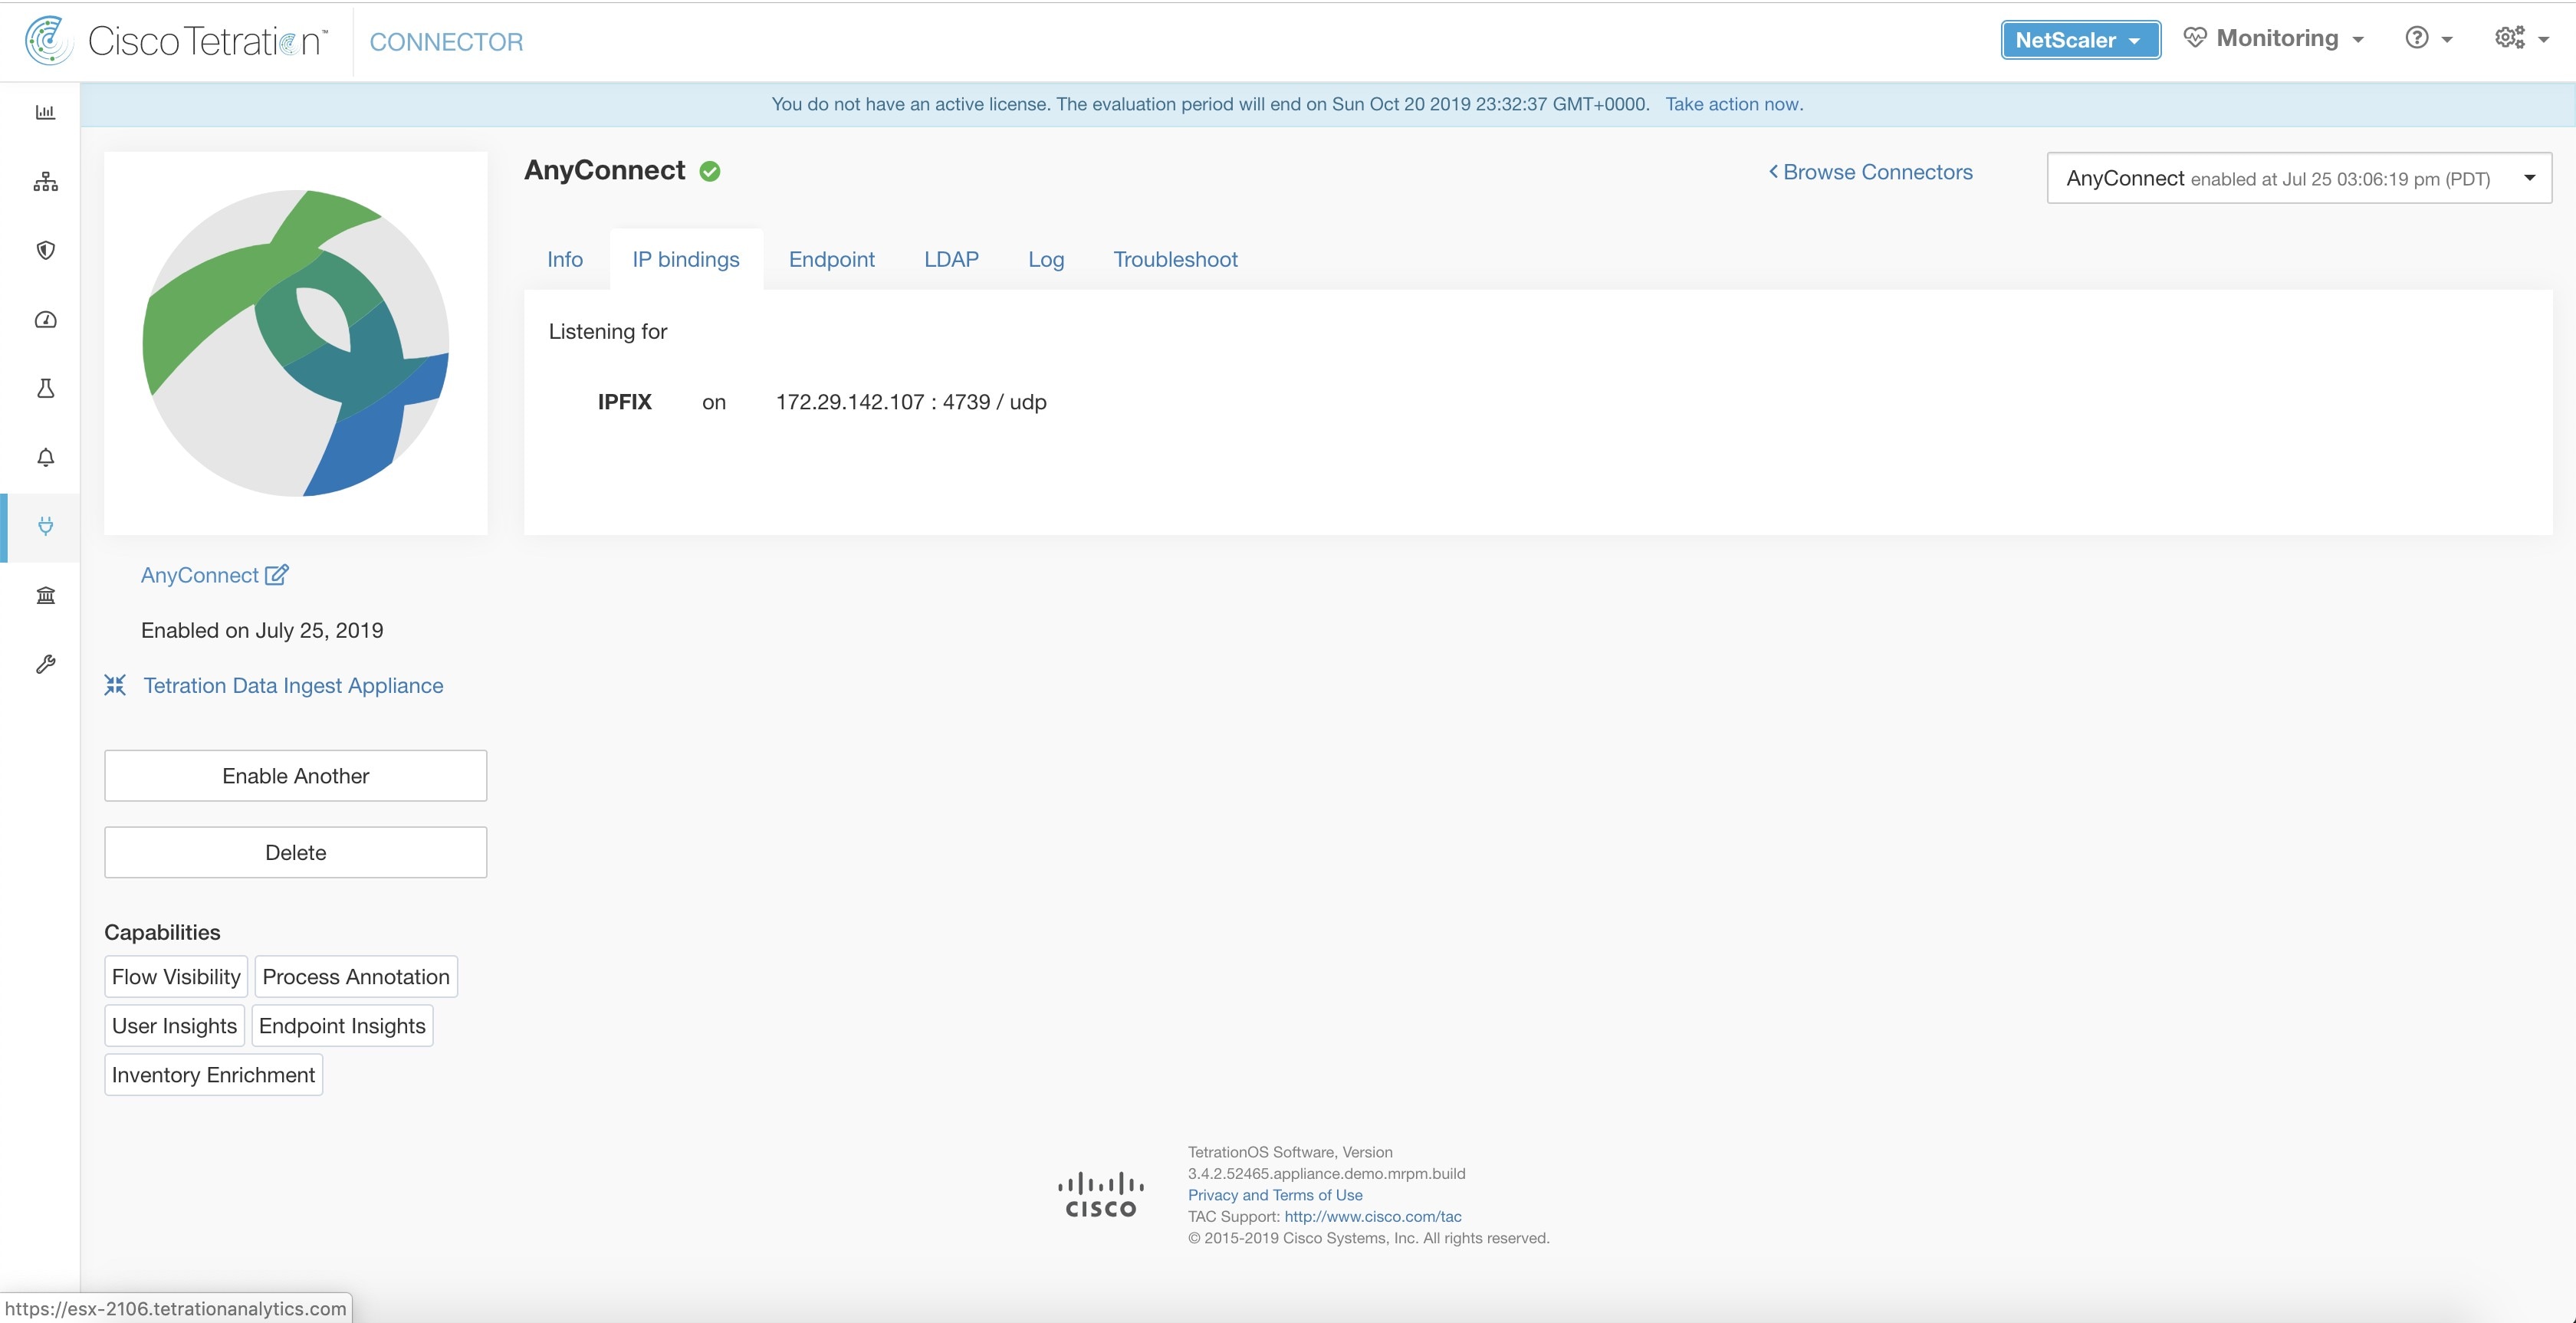
AnyConnect connector monitors endpoints that run Cisco AnyConnect Secure Mobility Client with Network Visibility Module (NVM). With this solution, hosts do not need to run any software agents on endpoints, because NVM sends host, interface, and flow records in IPFIX format to a collector, for example, AnyConnect connector.

The AnyConnect connector performs these high-level functions:

  1. Register each endpoint: Supported user devices such as desktops, laptops, or smartphones on Cisco Secure Workload as an AnyConnect agent.

  2. Update interface snapshots from these endpoints with Secure Workload.

  3. Send flow information exported by these endpoints to Secure Workload collectors.

  4. Periodically send snapshots of processes that generate flows on the endpoints tracked by the AnyConnect connector.

  5. Label endpoint interface IP addresses with Lightweight Directory Access Protocol (LDAP) attributes corresponding to the logged-in-user at each endpoint.

    Figure 10. AnyConnect connector
    AnyConnect connector
What is AnyConnect NVM

The Network Visibility Module (NVM) is a software component that

  • provides visibility and monitoring of endpoint and user behavior,

  • collects context information from endpoints, and

  • supports multiple contexts such as device, user, application, location, and destination.

AnyConnect NVM collects various contexts:

  1. Device/Endpoint Context: Device/endpoint specific information.

  2. User Context: Users associated with data flows.

  3. Application Context: Processes associated with data flows.

  4. Location Context: Available location specific attributes.

  5. Destination Context: FQDN of the destination.

    AnyConnect NVM generates three types of records.

    NVM Record

    Description

    Endpoint Record

    Device/endpoint information including unique device identifier (UDID), hostname, OS name, OS version and manufacturer.

    Interface Record

    Information about each interface in the endpoint including the endpoint UDID, interface unique identifier (UID), interface index, interface type, interface name, and MAC address.

    Flow Record

    Information about flows seen on the endpoint including endpoint UDID, interface UID, 5-tuple (source/destination IP/port and protocol), in/out byte counts, process information, user information, and FQDN of the destination.

Each record is generated and exported in IPFIX protocol format. When the device is in a trusted network (on- premise/VPN), AnyConnect NVM exports records to a configured collector. The AnyConnect connector is an example of an IPFIX collector that can receive and process IPFIX stream from AnyConnect NVM.


Note


AnyConnect connector supports AnyConnect NVM from version 4.2 and later of the Cisco AnyConnect Secure Mobility Client.


How to configure AnyConnect NVM

For step-by-step instructions on how to implement AnyConnect NVM using either Cisco Secure Firewall ASA or Cisco Identity Services engine (ISE), refer to How to Implement AnyConnect NVM. Once the NVM module is deployed, the NVM profile should be specified, pushed to, and installed on endpoints running Cisco AnyConnect Secure Mobility Client. When specifying NVM profile, the IPFIX collector should be configured to point to the AnyConnect connector on port 4739.

AnyConnect connector registers with Secure Workload as a Secure Workload AnyConnect Proxy agent.

Processing NVM records

The AnyConnect connector processes AnyConnect NVM records by registering endpoints, determining interface IP addresses, and translating flow records to ensure effective network operations in Secure Workload.

The key components involved in the process are:

  • AnyConnect connector: Registers endpoints and processes records for Secure Workload.

  • NVM record: Contains endpoint-specific information used to enable communication.

  • Secure Workload: The platform where all interactions from AnyConnect inputs are integrated and monitored.

The process involves these stages:

  • Endpoint Record Processing:

    • Upon receiving an endpoint record, it registers the endpoint on Secure Workload using specific information and certificate.

    • It enables data-plane by connecting to a Secure Workload collector and periodically checks the endpoint status.

  • Interface Record Processing:

    • IP address for an interface is recognized when flow records arrive.

    • Sends a snapshot of interfaces once the IP is defined, integrating VRF with incoming interface data.

  • Flow Record Processing:

    • Translates and transmits flow records in a compatible format to Secure Workload.

    • Associates LDAP attributes to endpoint IP if configured, ensuring all data is correlated for network monitoring.

Endpoint Record

Starting with version 4.9, AnyConnect NVM begins to send the agent version. By default, Secure Workload registers the AnyConnect endpoint as version 4.2.x. This version indicates the minimum supported AnyConnect NVM version. For the AnyConnect endpoints with version 4.9 or newer, the corresponding AnyConnect agent on Secure Workload would show the actual version installed.


Note


Secure Workload does not control the installed version of the AnyConnect agent. Upgrading the AnyConnect endpoint agent via Secure Workload user interface has no effect.


Flow Record

Note


Each AnyConnect connector will report only endpoints/interfaces/ flows for one VRF. The endpoints and interfaces reported by AnyConnect connector are associated with the VRF based on the Agent VRF configuration in Secure Workload. The flows exported by the AnyConnect connector agent on behalf of the AnyConnect endpoint belong to the same VRF. To configure the VRF for the agent, go to: Manage > Agents and click the Configuration tab. In this page, under “Agent Remote VRF Configurations” section, click “Create Config” and provide the details about the AnyConnect connector. The form requests the user to provide: the name of the VRF, IP subnet of the host on which the agent is installed, and range of port numbers that can potentially send flow records to the cluster.


Duplicate UDIDs in Windows endpoints

A duplicate UDID in Windows endpoints is a cloning issue where:

  • All cloned endpoints from the same golden image have identical UDIDs.

  • This identical UDID limits the AnyConnect connectors' ability to differentiate records.

  • Makes data association to the correct AnyConnect agent indeterministic.

To solve this, AnyConnect NVM 4.8 provides a tool named dartcli.exe to find and regenerate UDID on the endpoint.

  • dartcli.exe -u retrieves the UDID of the endpoint.

  • dartcli.exe -nu regenerates the UDID of the endpoint. To run this tool, use these steps.


    C:\Program Files (x86)\Cisco\Cisco AnyConnect Secure Mobility Client\DART>dartcli.exe -u
    UDID : 8D0D1E8FA0AB09BE82599F10068593E41EF1BFFF

    C:\Program Files (x86)\Cisco\Cisco AnyConnect Secure Mobility Client\DART>dartcli.exe -nu
    Are you sure you want to re-generate UDID [y/n]: y
    Adding nonce success
    UDID : 29F596758941E606BD0AFF49049216ED5BB9F7A5

    C:\Program Files (x86)\Cisco\Cisco AnyConnect Secure Mobility Client\DART>dartcli.exe -u
    UDID : 29F596758941E606BD0AFF49049216ED5BB9F7A5
Periodic tasks

A periodic task is a scheduled activity that:

  • runs at defined intervals,

  • executes automatically without manual intervention, and

  • involves processing to update various operational parameters.

Periodically, the AnyConnect connector sends process snapshots and user labels on AnyConnect endpoint inventories.

  1. Process Snapshots: Every five minutes, the AnyConnect connector walks through the processes maintained locally, and sends a process snapshot for all endpoints with flows during that interval.

  2. User Labels: Every two minutes, the AnyConnect connector walks through the LDAP user labels maintained locally and updates User Labels on those IP addresses.

For user labels, the AnyConnect connector creates a local snapshot of LDAP attributes of all users. With the AnyConnect connector enabled, provide LDAP configuration. This includes server/port information, required attributes, and the username attribute. In addition, the LDAP user credentials to access LDAP server may be provided. LDAP user credentials are encrypted and never revealed in the AnyConnect connector. Optionally, a certificate for the LDAP may be provided for secure access.


Note


AnyConnect connector creates a new local LDAP snapshot every 24 hours. This interval is configurable in LDAP configuration of the connector.


How to configure the connector

For information about required virtual appliances, refer to Virtual Appliances for Connectors. These configurations can be applied to the connector.

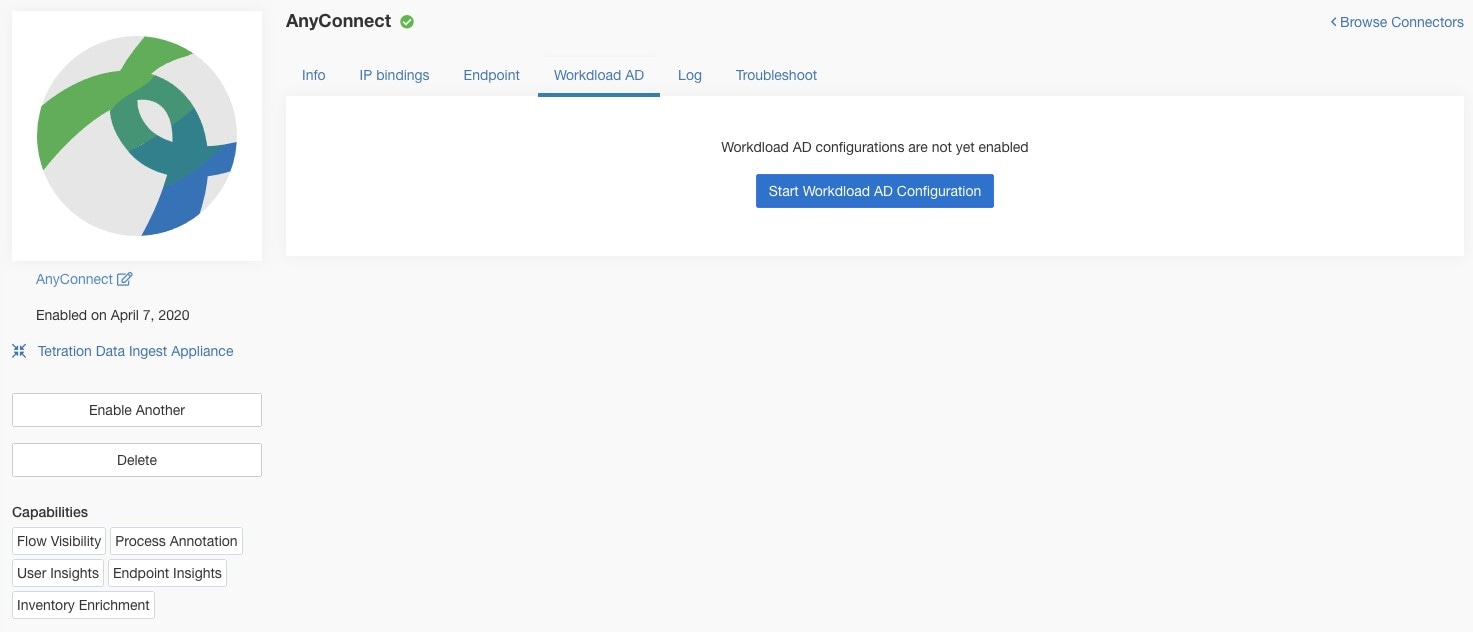
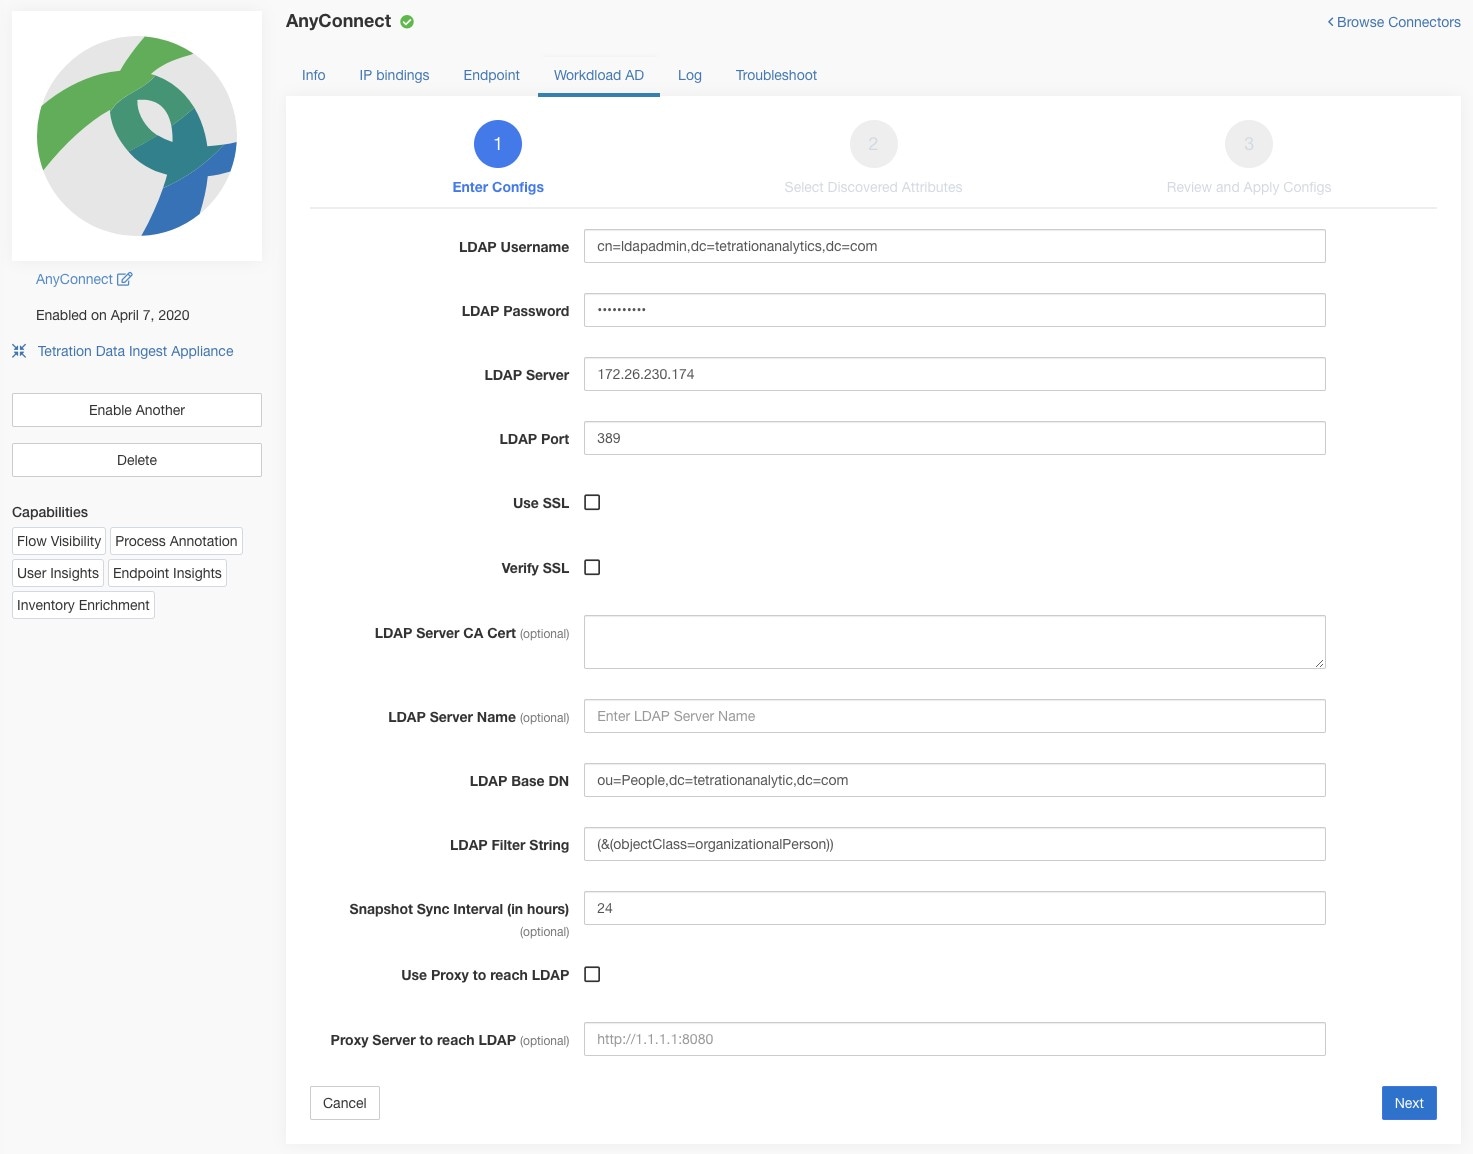
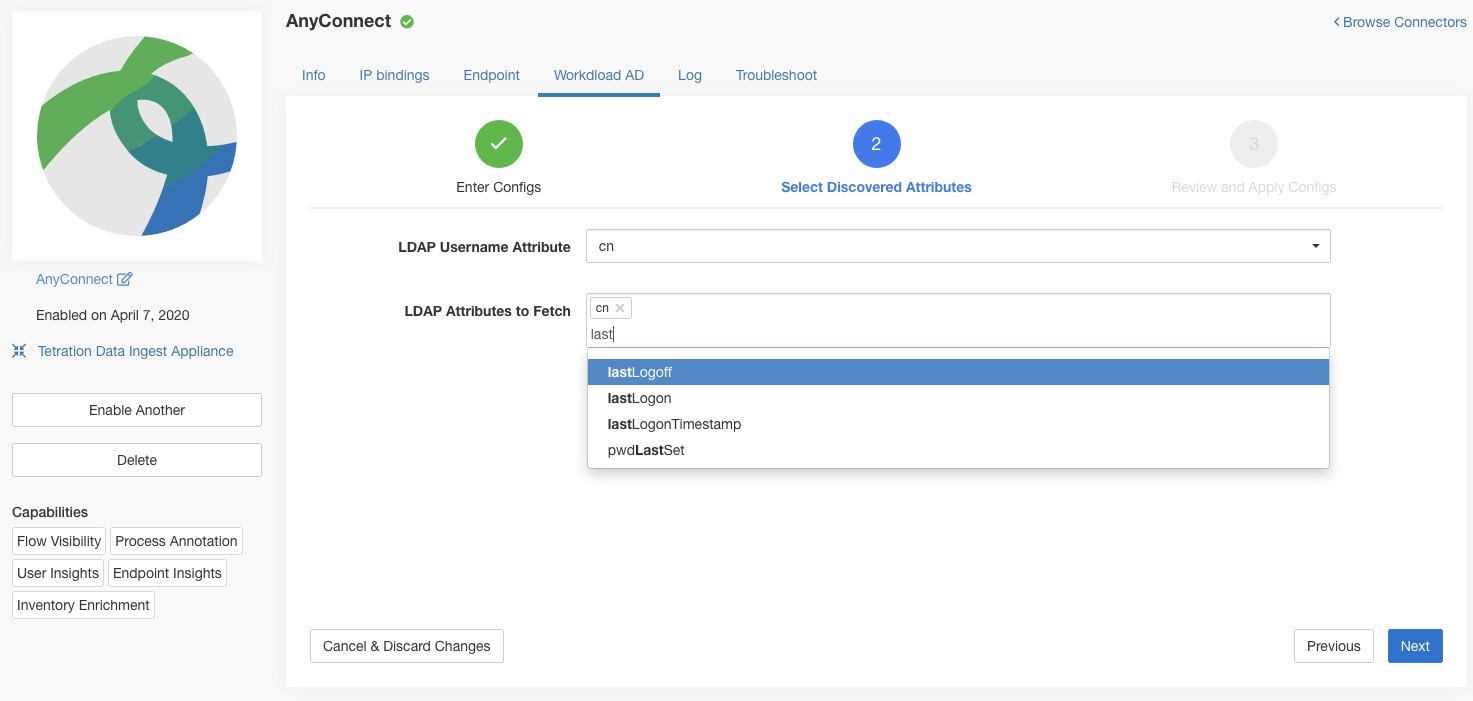
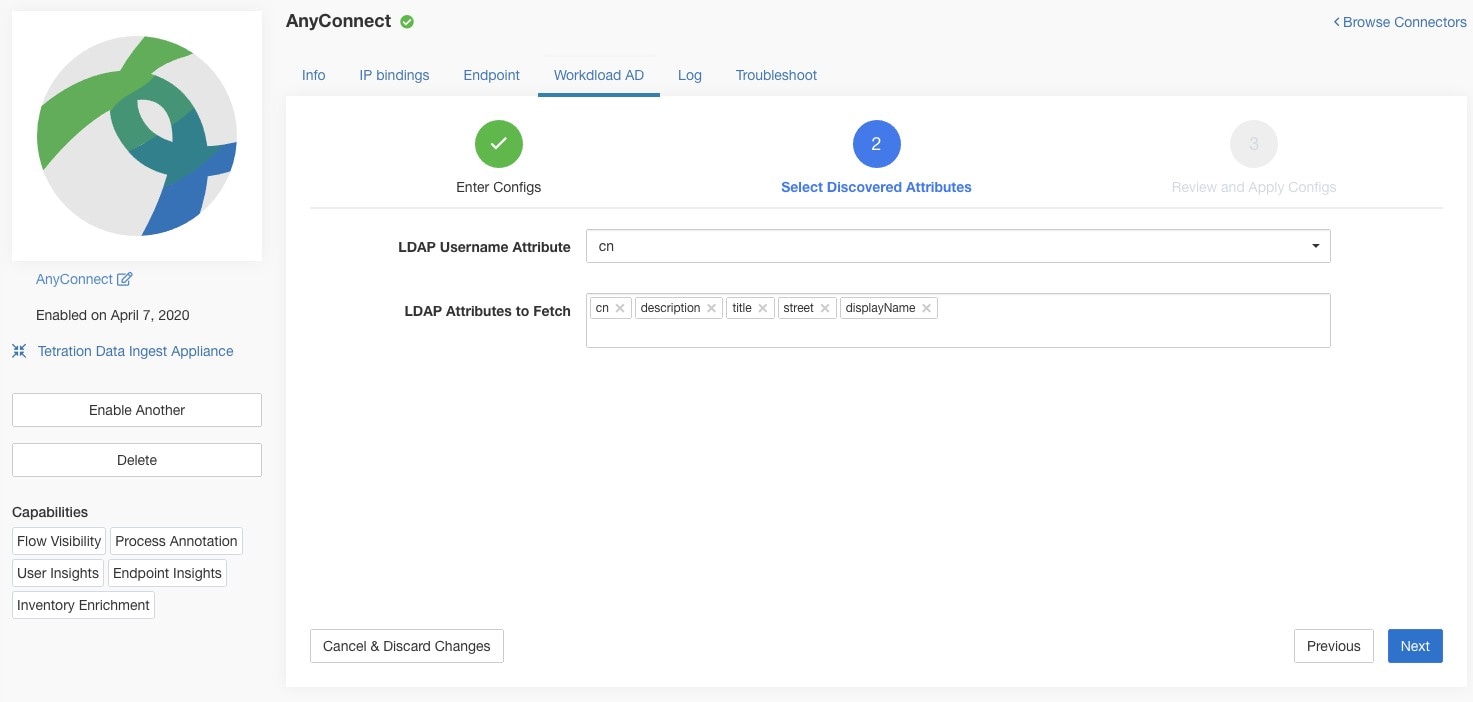
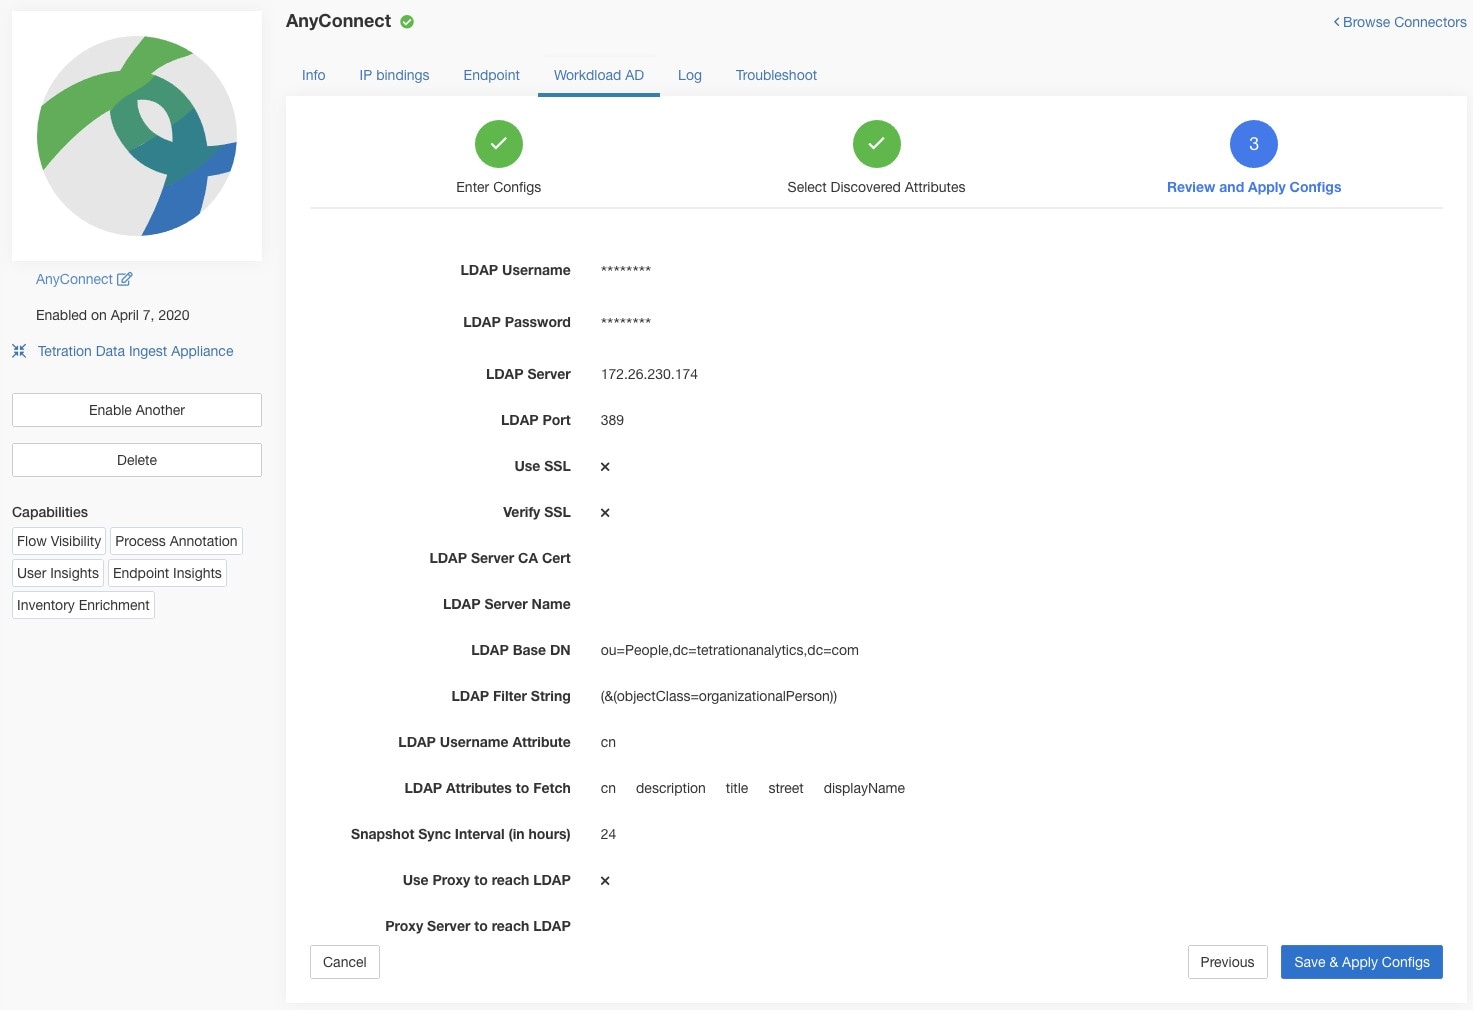
  • LDAP: LDAP configuration supports discovery of LDAP attributes and provides a workflow to select the attribute that corresponds to the username and a list of up to six attributes to fetch for each user. For more information, refer to Discovery .

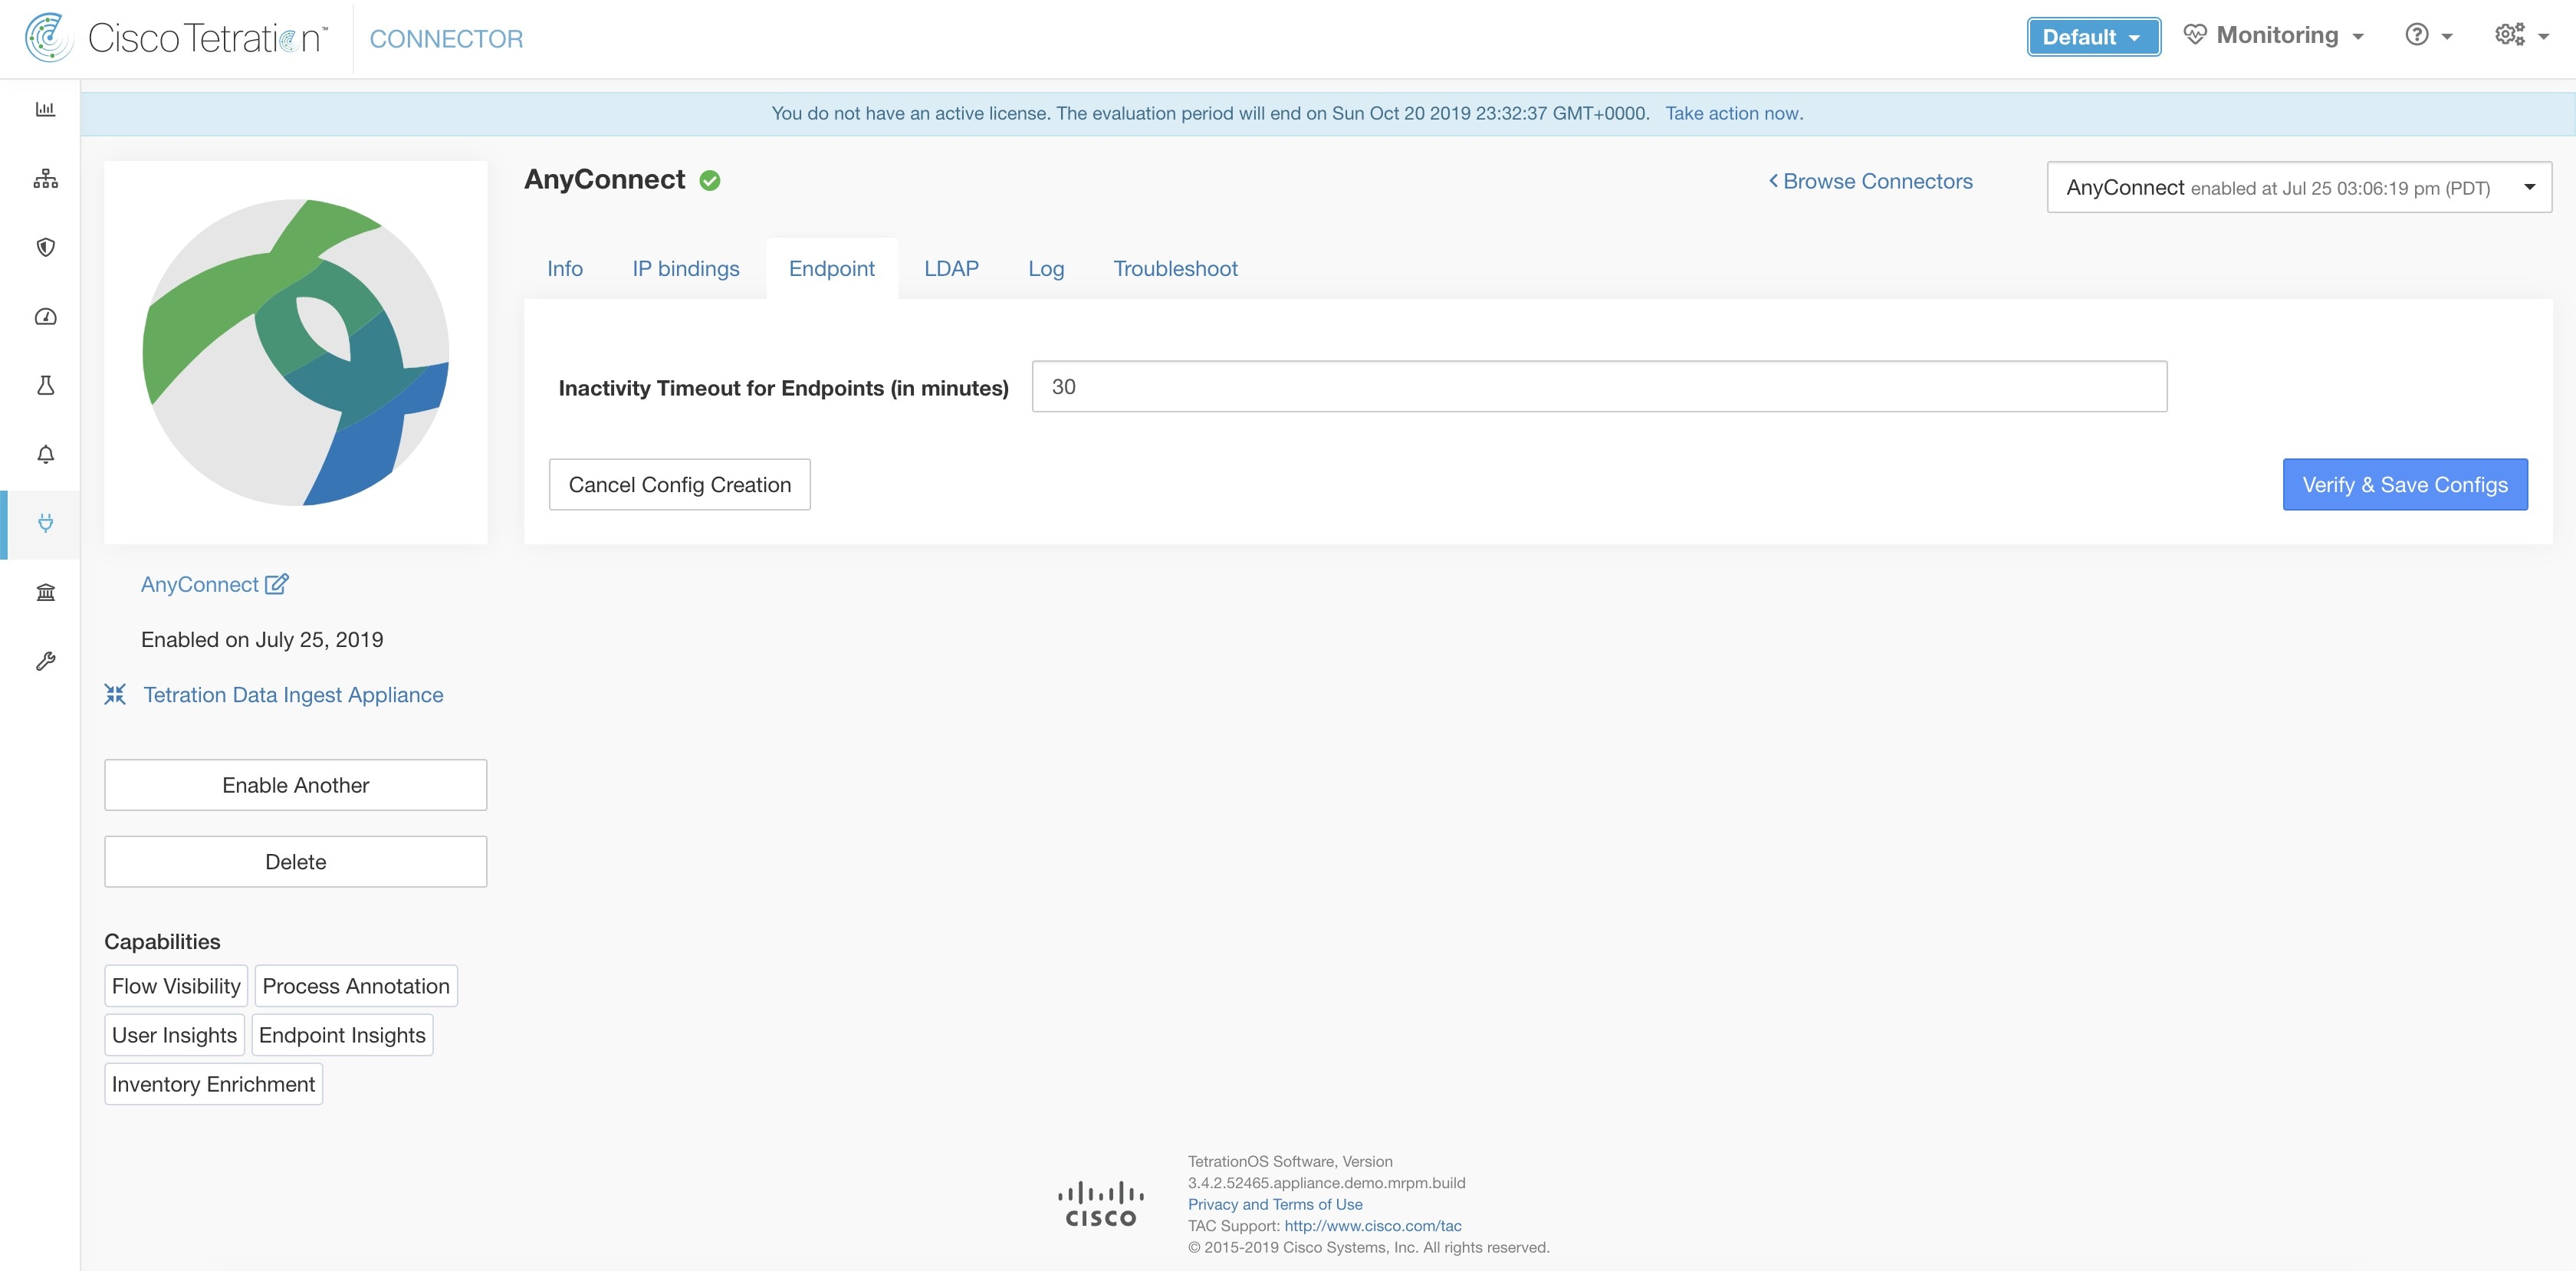
  • Endpoint: For more information, refer to Endpoint Configuration.

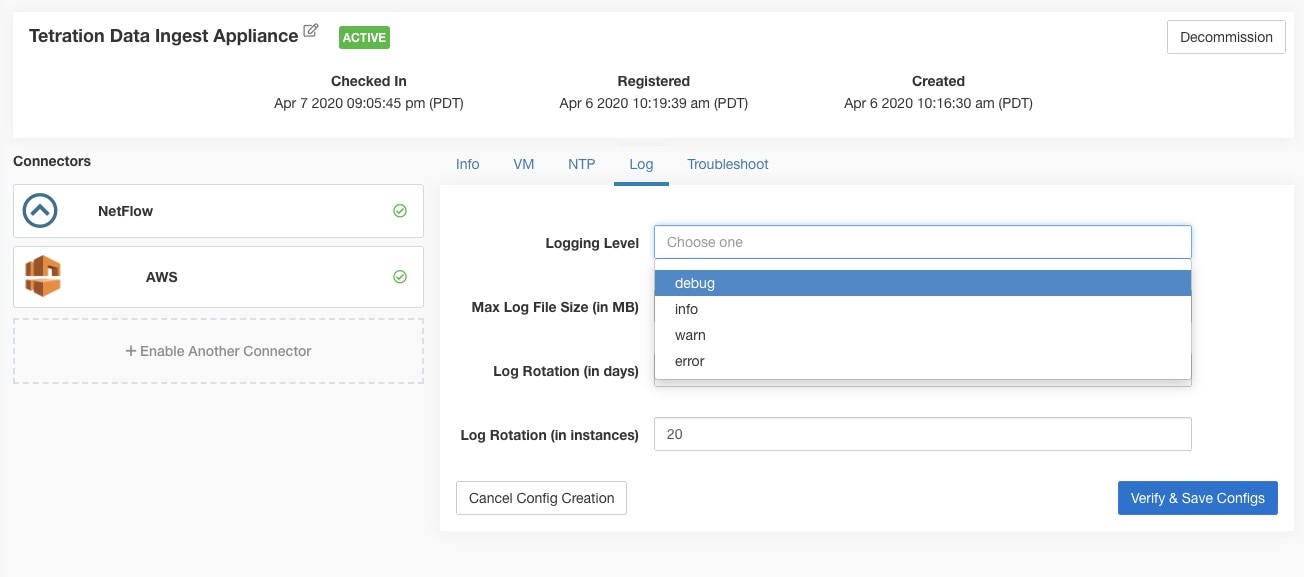
  • Log: For more information, refer to Log Configuration.

Additionally, the listening ports of IPFIX protocol on the connector can be updated on the Docker container in Secure Workload Ingest appliance using an allowed command. This command can be issued on the appliance by providing the connector ID of the connector, type of the port to be update, and the new port information. The connector ID can be found on the connector page in Secure Workload UI. For more information, see update-listening-ports.

Limits

Metric

Limit

Maximum number of AnyConnect connectors on one Secure Workload Ingest appliance

1

Maximum number of AnyConnect connectors on one Tenant (rootscope)

50

Maximum number of AnyConnect connectors on Secure Workload

500

ISE connector

The ISE connector in Secure Workload connects with Cisco Identity Services Engine (ISE) and ISE Passive Identity Connector (ISE-PIC) using the Cisco Platform Exchange Grid (pxGrid), to retrieve contextual information, such as metadata, for endpoints reported by ISE.

An ISE connector performs these functions:

  1. Registers each endpoint on Secure Workload that is identified as an ISE endpoint

  2. Updates metadata information on Secure Workload regarding the endpoints, such as MDM details, authentication, Security Group labels, ISE group name, and ISE group type.

  3. Periodically, the cluster is updated with active endpoints visible on the ISE.
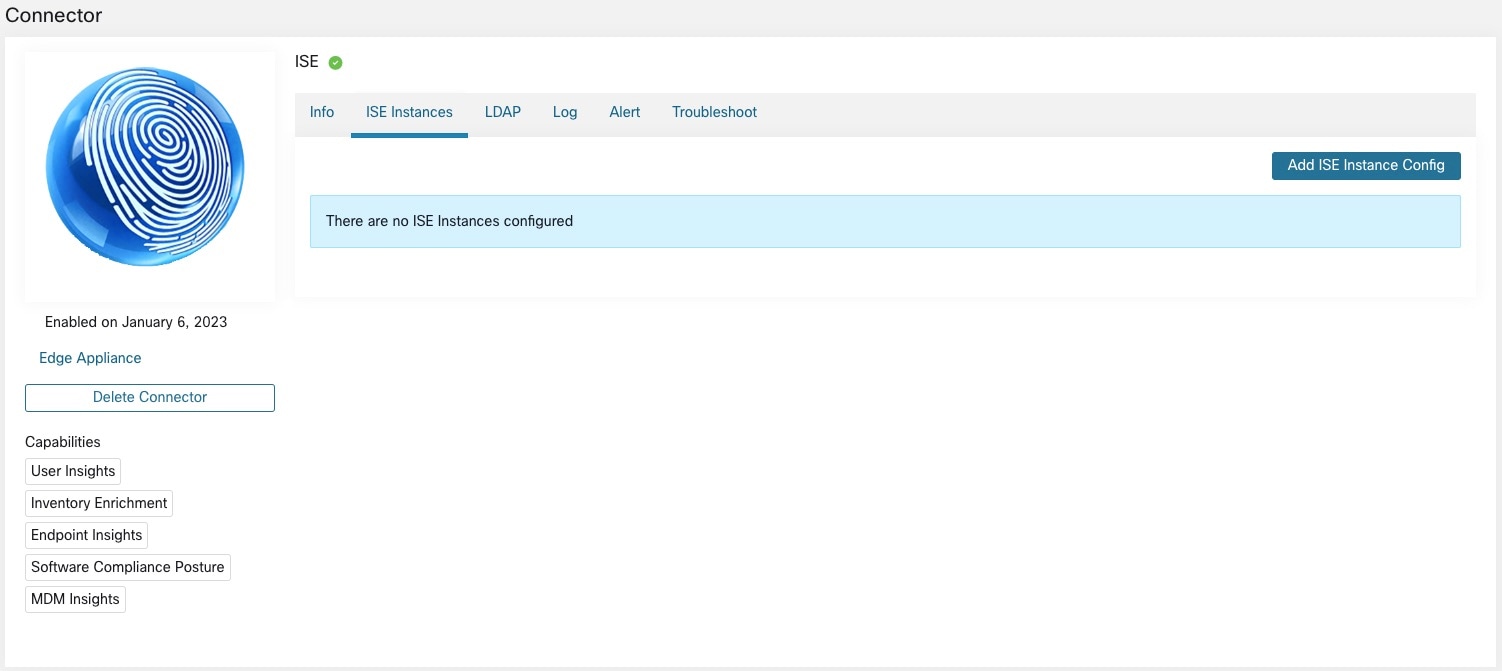
    Figure 11. ISE connector

Note


Each ISE connector registers only endpoints and interfaces for a single VRF. The endpoints and interfaces reported by ISE connectors are associated with the VRF based on the Agent VRF configuration in Secure Workload.


Configure the VRF for the agent using these steps:

  • Choose Manage > Workloads > Agents.

  • Click the Configuration tab.

  • Under the Agent Remote VRF Configurations section, click Create Config.

  • Provide the details about the ISE connector, including the VRF name, the IP subnet of the host on which the agent is installed, and the range of port numbers that can register ISE endpoints and interfaces on Secure Workload.


Note


ISE endpoint agents are not listed on the Agents List page; instead ISE endpoints with the attributes can be viewed on the Inventory page.


How to configure the connector

Note


ISE version 2.4 or higher and ISE PIC version 3.1 or higher are required for this integration.


For information about required virtual appliances, refer to Virtual Appliances for Connectors. For ISE connectors, IPv4 and IPv6 dual-stack mode addresses are supported. Dual stack support is available as a beta feature.

You can configure the connector with these options:

  • ISE Instance: The ISE connector connects to multiple instances of ISE using the provided configurations. Each instance requires ISE certificate credentials, a hostname, and a node name for connection. For more information, refer to ISE Instance Configuration.

  • LDAP: LDAP configuration supports discovery of LDAP attributes, allows the selection of the username attribute, enables the fetching of up to six attributes for each user. For more information, refer to Discovery .

  • Log: For more information, refer to Log Configuration.


    Note


    ISE connector connects with the getSessions API call to fetch all active endpoints during the timeframe. The ISE connector also has a listener that subscribes to session topic in PxGrid that provides all the new endpoints updates.


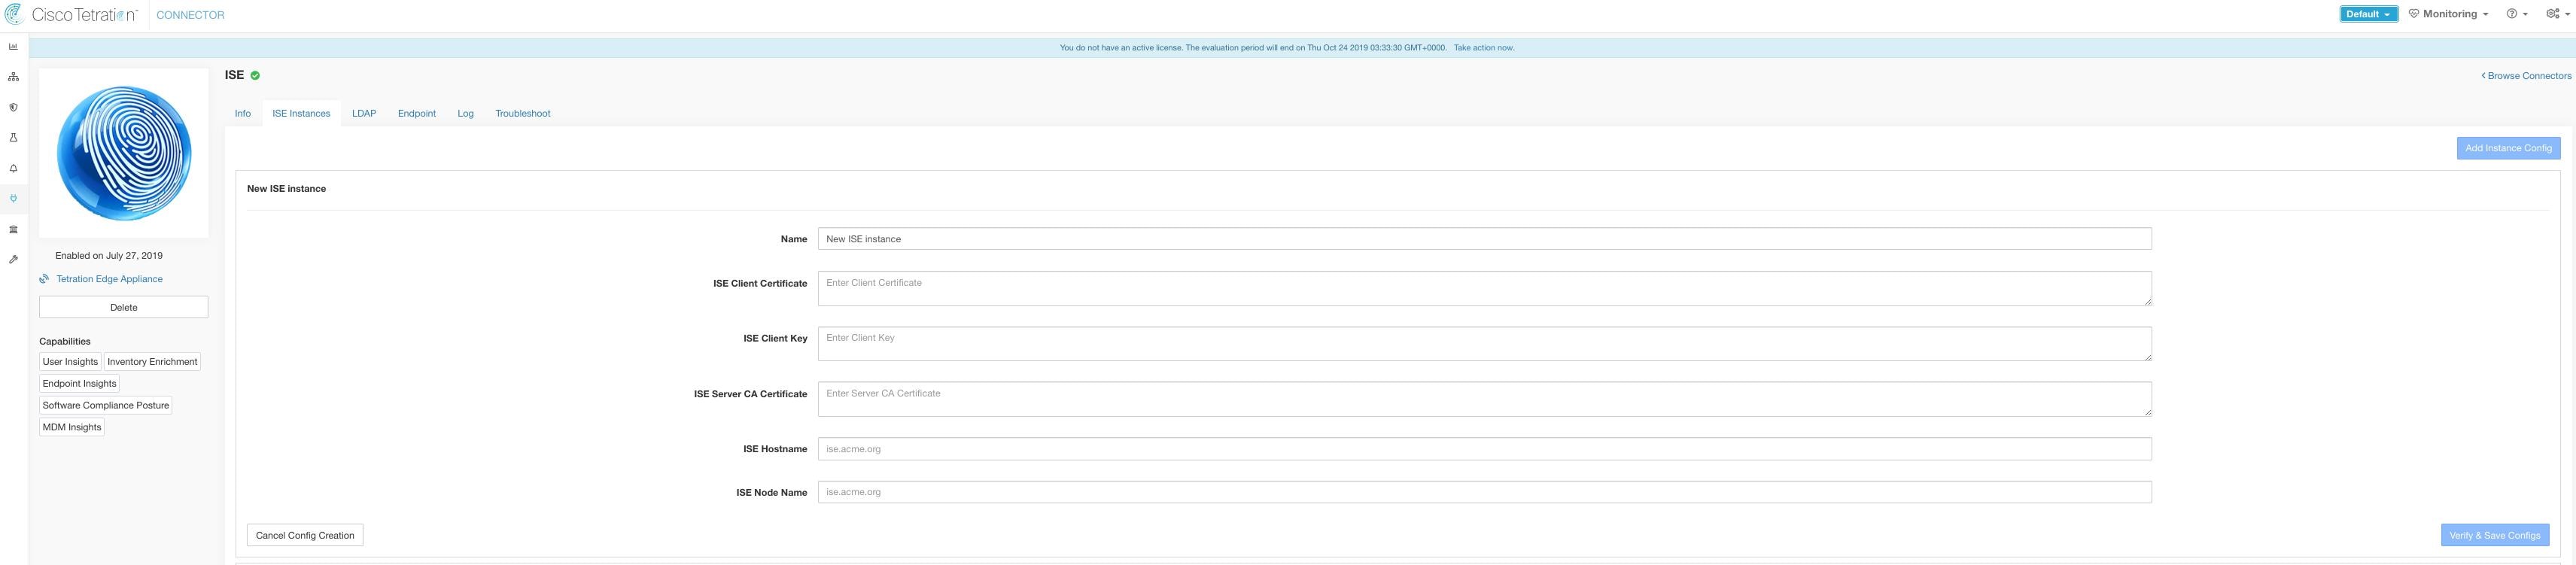
ISE instance configuration
Ensure you are using Cisco Secure Workload version 3.7 or higher, requiring Subject Alternative Names for SSL certificates.
Figure 12. ISE instance config
ISE instance config

Note


Cisco Secure Workload version 3.7 requires Subject Alternative Names (SAN) for the SSL certificate of Cisco ISE pxGrid node for this integration. Ensure the certification configuration of the ISE nodes is done by your ISE administrator prior to performing the integration with Secure Workload.


To verify your pxGrid node’s certificate and confirm if SAN is configured, perform the verification steps for the certificate from ISE.

Procedure

Step 1

Navigate to Certificates and choose Administration > System.

Step 2

Under Certificate Management, select System Certificates, select your “Used by” pxGrid certificate and choose View to review the pxGrid node cert.

Step 3

Review the certificate to ensure that the Subject Alternative Names are configured.

Step 4

Ensure that this certificate is signed by a valid Certificate Authority (CA), which is also used to sign the pxGrid client certificate for the Secure Workload ISE connector.
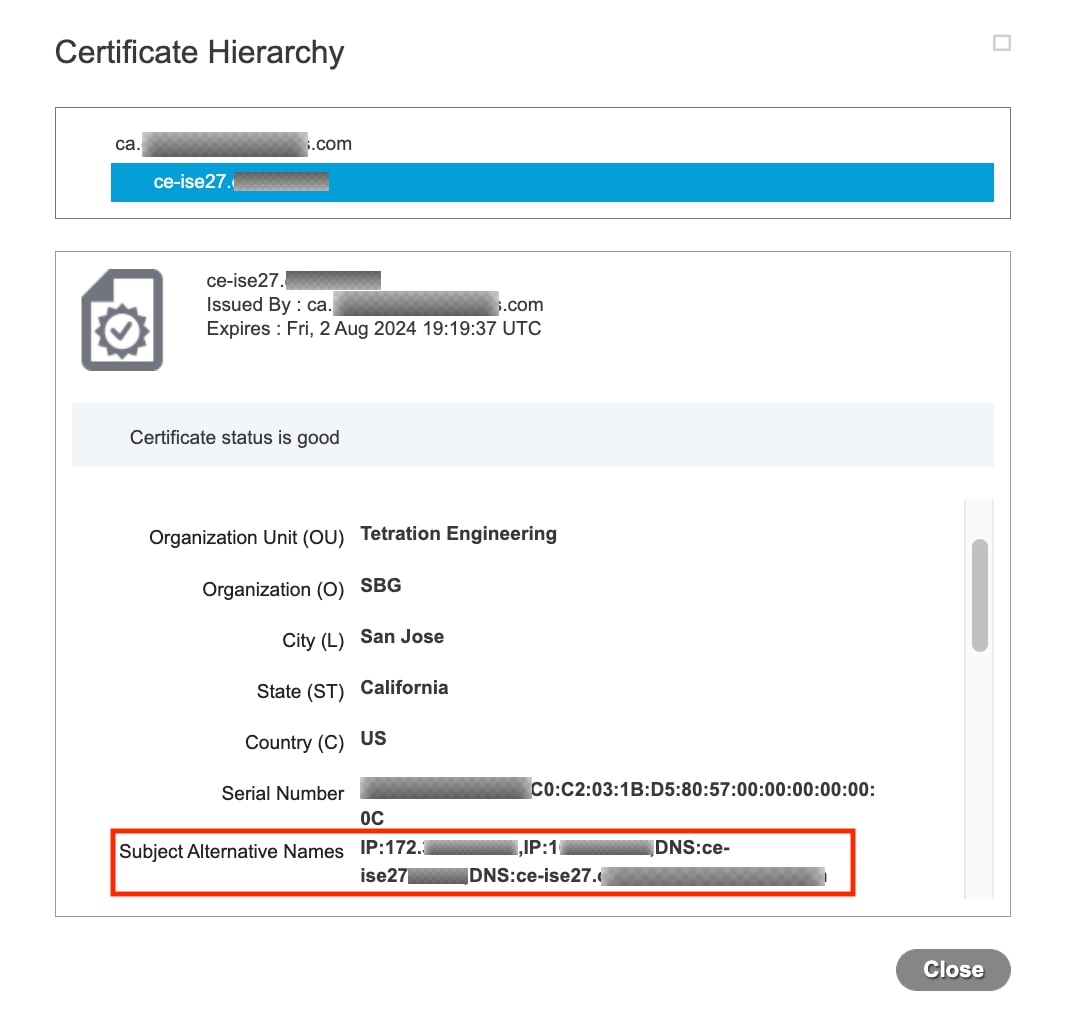
Figure 13. Example of a Valid ISE pxGrid Node Certificate

Step 5

You can now generate the pxGrid client certificate signing request using the following template on any host installed with OpenSSL.


   [req]
   distinguished_name = req_distinguished_name
   req_extensions = v3_req
   x509_extensions = v3_req
   prompt = no
   [req_distinguished_name]
   C = YOUR_COUNTRY
   ST = YOUR_STATE
   L = YOUR_CITY
   O = YOUR_ORGANIZATION
   OU = YOUR_ORGANIZATION_UNIT
   CN = ise-connector.example.com
   [v3_req]
   subjectKeyIdentifier = hash
   basicConstraints = critical,CA:false
   subjectAltName = @alt_names
   keyUsage = critical,digitalSignature,keyEncipherment
   extendedKeyUsage = serverAuth,clientAuth
   [alt_names]
   IP.1 = 10.x.x.x
   DNS.1 = ise-connector.example.com

Save the file as example-connector.cfg and use the OpenSSL command from your host to generate a Certificate Signing Request (CSR) and the certificate private key with this command.

openssl req -newkey rsa:2048 -keyout example-connector.key -nodes -out example-connector.csr -config example-connector.cfg

Step 6

Sign the Certificate Signing Request (CSR) by your CA using a Windows CA server. If you are also using a Windows CA server, run this command to sign the CSR of the pxGrid client.

certreq -submit -binary -attrib "CertificateTemplate:CiscoIdentityServicesEngine" example-connector.csr example-connector.cer

Note


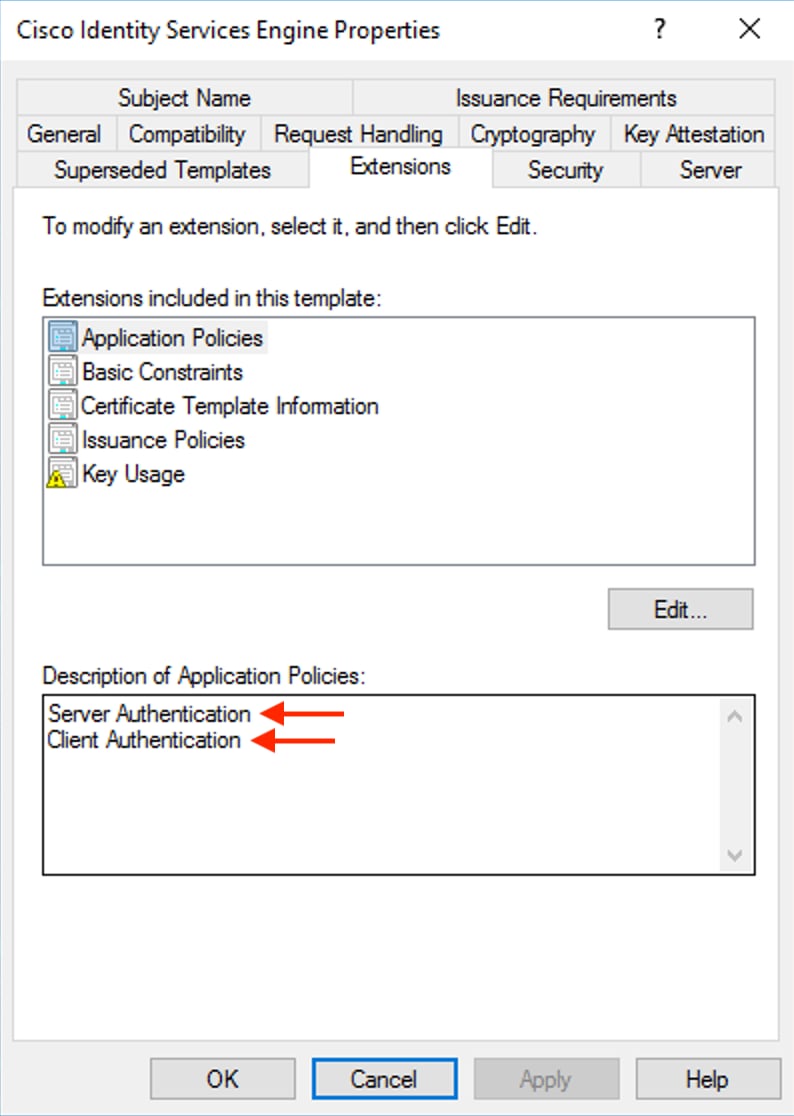
Windows CA requires a Certificate Template. This template should contain the following extensions.

Figure 14. Extensions of Application Policies for a Certificate Template

Step 7

Copy the signed client certificate and root CA in the PEM format onto your host. This is the same host that generates the client CSR and private key. Use OpenSSL to ensure the client certificate is in X.509 PEM format. Run the following command using OpenSSL to convert the signed client certificate to the X.509 PEM format.

openssl x509 -inform der -in example-connector.cer -out example-connector.pem

Step 8

You can also confirm the PEM that is signed by the CA, use this command.

openssl verify -CAfile root-ca.example.com.pem example-connector.pem
example-connector.pem: OK

Note


For multi-node ISE deployment with pxGrid, all the pxGrid nodes must trust the Certs used for the Secure Workload ISE Connector.

Step 9

Using this example’s file names, copy the ISE client cert—example-connector.pem, client key—example-connector.key and CA—root-ca.example.com.pem into the respective fields on the ISE configuration page on Secure Workload.

Note


Before upgrading to the latest version of Secure Workload version, delete the ISE connector to ensure existing configuration data is removed. Then, configure the ISE connector with the desired new filters.

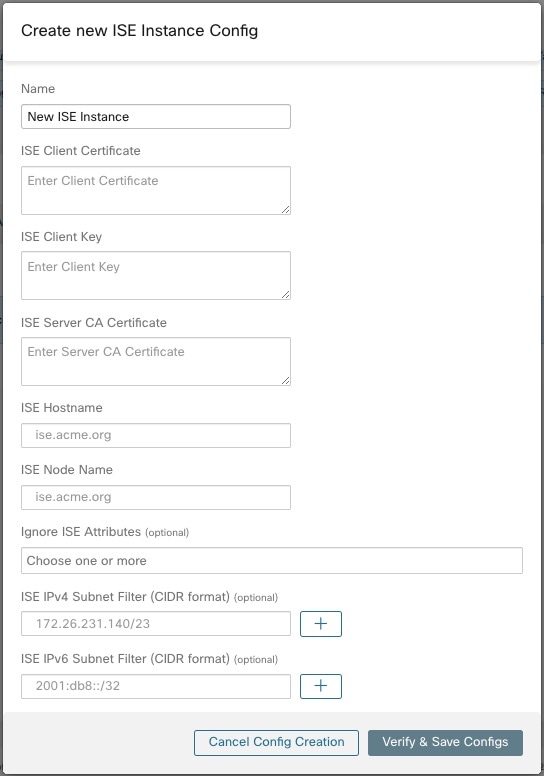
Figure 15. ISE Connector Configuration
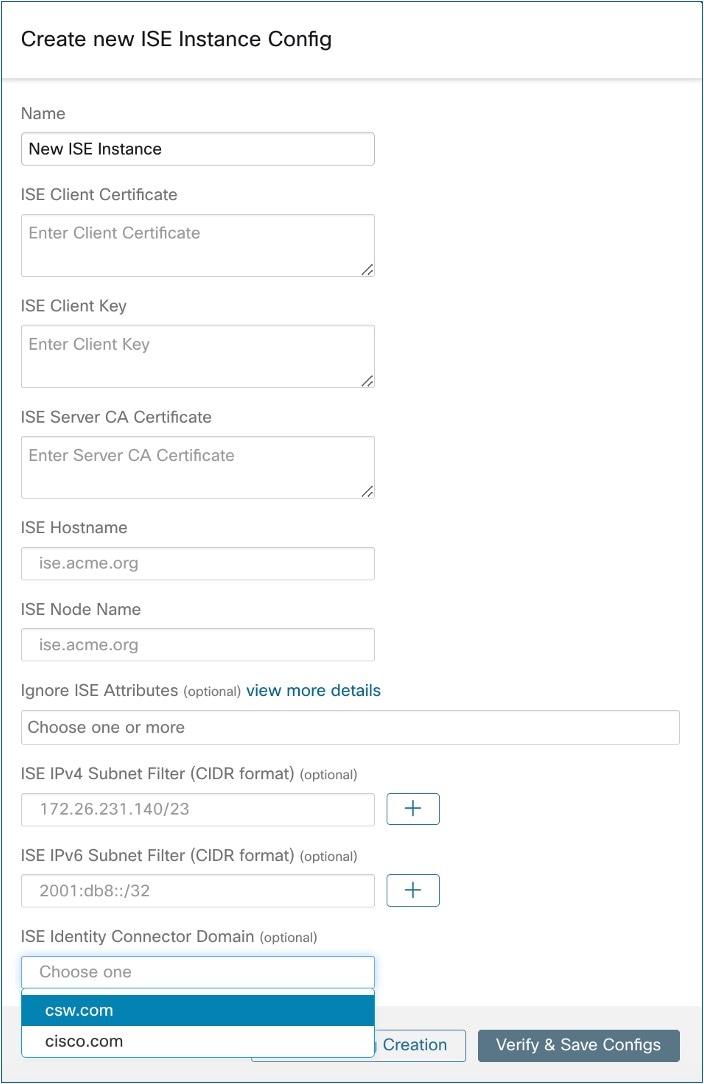
Figure 16. ISE Connector Configuration
Table 3. ISE Connector Configuration

Field

Description

Name

Enter an ISE instance name.

ISE Client Certificate

Copy and paste ISE client certificate.

ISE Client Key

Copy and paste the ISE client key. The client key must be a clear key, which is not password protected.

ISE Server CA Certificate

Copy and paste Root CA certificate.

ISE Hostname

Enter ISE hostname (FQDN).

ISE Node Name

Enter ISE node name.

Ignore ISE Attributes (Optional)

Select one or more ISE attributes from the list.

Use this option if you do not want to ingest all the contextual information of endpoints reported through ISE.

ISE IPv4 Subnet Filter (CIDR Format) (Optional)

Enter multiple IPv4 subnets to filter ISE endpoints.

ISE IPv6 Subnet Filter (CIDR Format) (Optional)

Enter multiple IPv6 subnets to filter ISE endpoints.


Note


  • If an IP Address is used instead of FQDN for the ISE Hostname, then use the IP address in the ISE CA certificate SAN, otherwise, there may be connection failures.

  • Number of active endpoints on ISE is not a snapshot, it depends on the configurations on ISE and the aggregation duration for computing the metric. The agent count on Secure Workload is always a snapshot based on last pull from ISE and pxgrid updates, typically the active device count over the last one day (the default refresh frequency for full snapshots is a day). Due to the difference in the way these numbers are depicted, it is possible that these two numbers will not always match.


Processing ISE records

Processing of ISE records involves integrating endpoint information and security group details into Secure Workload for timely updates and accurate content management.

The key components of the process are:

  • ISE connector: Connects to the ISE instance to monitor updates and manage record registration.

  • Secure Workload: Manages inventory enrichment using the registered endpoints.

  • Local Database: Maintains mapping details for security groups.

The process involves the following stages:

  • Connect and Subscribe: The ISE connector connects to the ISE instance and subscribes for updates on endpoints and security groups over pxGrid.

  • Endpoint Record Handling: Upon receiving an endpoint record, the ISE connector registers the endpoint on Secure Workload using endpoint-specific information and its certificate, enriching the inventory.

  • Security Group Management: ISE connector updates its local database with any Security Group Label changes and aligns these with endpoint records in Secure Workload.

Periodic Tasks

ISE connector periodically updates user labels on ISE endpoint inventories.

  1. Endpoint Snapshots: Every 20 hours, ISE connector fetches a snapshot of endpoints and security group labels from the ISE instance and updates the cluster if any change is detected. This call cannot handle disconnected endpoints if they are not visible in the ISE system.

  2. User Labels: Every two minutes, ISE connector scans through the LDAP user and ISE endpoint labels maintained locally and updates user labels on those IP addresses.

For user labels, the ISE connector generates a local snapshot of LDAP attributes for all users. When ISE connector is enabled, configuration for LDAP may be provided, including server and port information, attributes to fetch for a user, and the attribute containing the username. Additionally, provide LDAP user credentials for LDAP server access. LDAP user credentials are encrypted and never revealed in the ISE connector. Optionally, provide an LDAP certificate for securely LDAP server access.


Note


ISE connector generates a new local LDAP snapshot every 24 hours. This interval is configurable in the LDAP configuration of the connector.


Note


After upgrading the Cisco ISE device, the ISE connector must be reconfigured with the new certificates generated by ISE.


Limits

Metric

Limit

Maximum number of ISE instances that can be configured on one ISE connector

20

Maximum number of ISE connectors on one Secure Workload Edge appliance

1

Maximum number of ISE connectors on one Tenant (rootscope)

1

Maximum number of ISE connectors on Secure Workload

150


Note


Maximum number of ISE agents supported per connector is 20000. If there is a use case that requires support for more ISE agents, please contact Secure Workload support.


Connectors for Inventory Enrichment

Connectors for inventory enrichment provide additional metadata and context about the inventories (IP addresses) monitored by Secure Workload.

Connector

Description

Deployed on Virtual Appliance

ServiceNow

Collects endpoint information from ServiceNow instance and enriches the inventory with ServiceNow attributes.

Secure Workload Edge

See also:

Cloud Connectors

For more information about required virtual appliances, refer to Virtual Appliances for Connector.

ServiceNow Connector

ServiceNow connector connects with ServiceNow Instance to get all the ServiceNow CMDB related labels for the endpoints in ServiceNow inventory. Using this solution, we can get enriched metadata for the endpoints in Cisco Secure Workload.

ServiceNow connector does the following high-level functions.

  1. Update ServiceNow metadata in Secure Workload’s inventory for these endpoints.

  2. Periodically take snapshot and update the labels on these endpoints.

    Figure 17. ServiceNow connector
    ServiceNow connector

How to Configure the ServiceNow Connector

For information about required virtual appliances, see Virtual Appliances for Connectors. The following configurations are allowed on the connector.

  • ServiceNow Tables: ServiceNow Tables configures the ServiceNow instance with it’s credentials, and the information about ServiceNow tables to fetch the data from.

  • Scripted REST api: ServiceNow scripted REST API tables can be configured similar to ServiceNow tables.

  • Sync Interval: Sync Interval configuration allows to make change the periodicity at which Secure Workload should query ServiceNow instance for updated data. The default sync interval is set to 60 minutes.

  • Log: For more information, see Log Configuration .

ServiceNow Instance Configuration

You will need the following items to successfully configure a ServiceNow instance.

  • ServiceNow username

  • ServiceNow password

  • ServiceNow Instance URL

  • Scripted APIs

  • (Optional) Additional URL parameters (per-table)
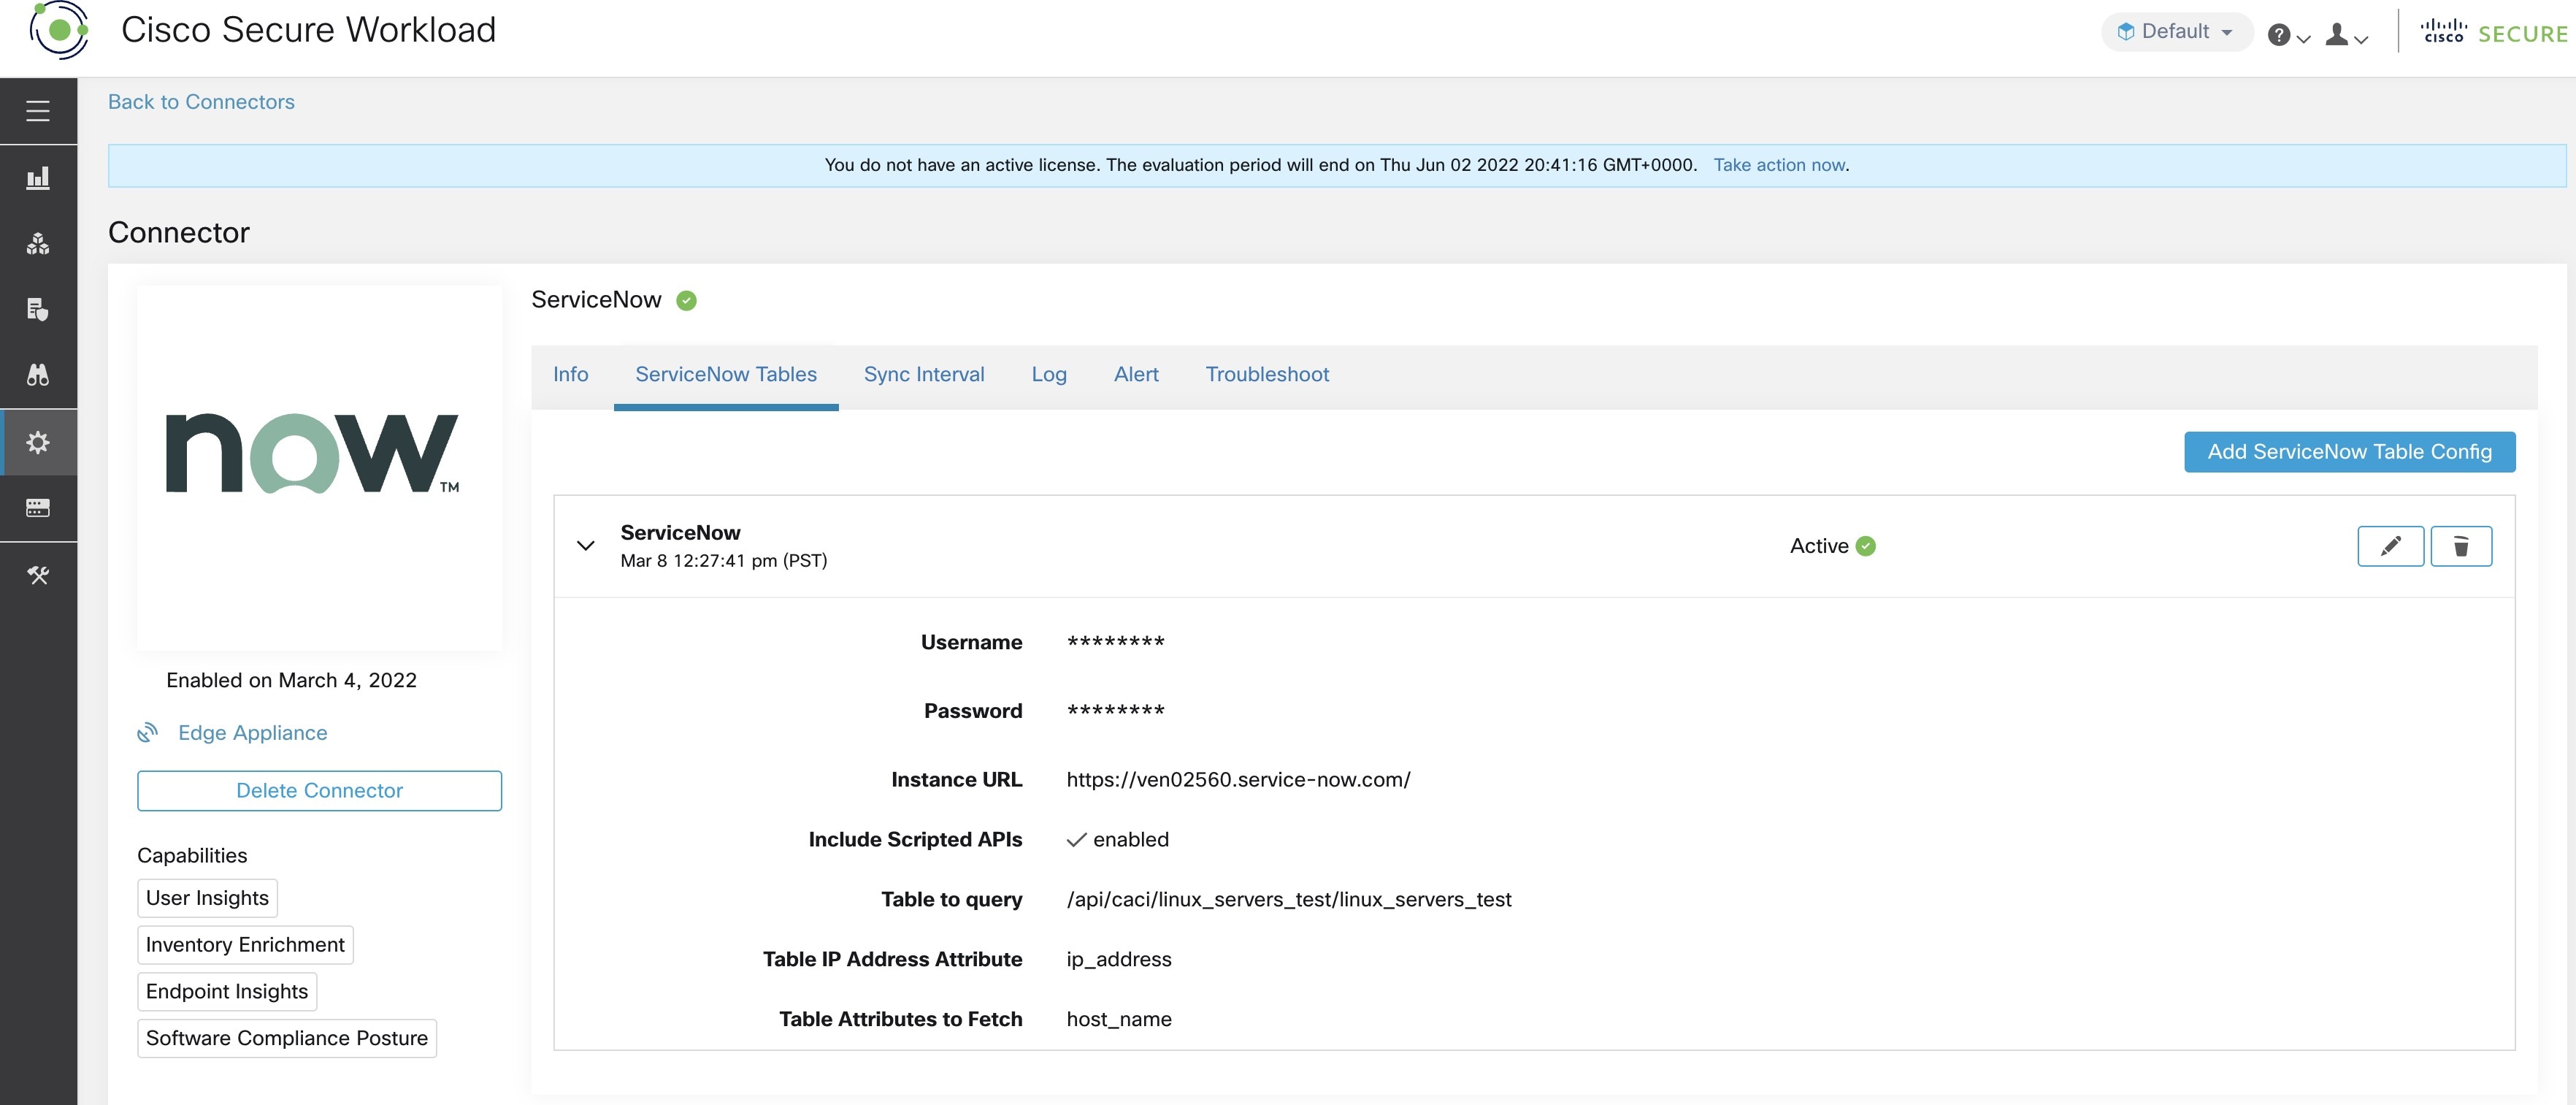
Figure 18. ServiceNow Instance Configuration
ServiceNow instance confi

Subsequently, Secure Workload performs a discovery of all the tables from the ServiceNow Instance and Scripted REST API’s (only if Include Scripted APIs check box is enabled). It presents user with the list of tables to choose from, once a user selects table, Secure Workload fetches all the list of attributes from that table for the user to select. User has to chose the ip_address attribute from the table as the key. Subsequently, user can chose upto 10 unique attributes from the table. See the following figures for each step.


Note


ServiceNow Connector can only support integrating with tables having IP Address field.


Note


To integrate with ServiceNow Scripted REST API’s you need to enable the Scripted APIs check box, which would give you a similar workflow to any other table.


Note


For scripted REST APIs to integrate with aServiceNow Connector, the scripted REST APIs cannot have path parameters. Also, the scripted REST APIs must support sysparm_limit, sysparm_fields, and sysparm_offset as query parameters.


Note


The ServiceNow user roles must include cmdb_read for tables and web_service_admin for scripted REST APIs to integrate with Cisco Secure Workload.


Figure 19. Create ServiceNow Table Configuration
ServiceNow instance config first step
Figure 20. Secure Workload Fetches the Table Info from ServiceNow Instance
Secure Workload Fetches the Table Info from ServiceNow Instance
Figure 21. Secure Workload presents the list of tables
Secure Workload presents the list of tables
Figure 22. Select ServiceNow Table Attributes
User selects the ip_address attribute, and other attribute in the table
Figure 23. Review and Apply Config
User finalizes the ServiceNow config

Processing ServiceNow records

Based on the instance url you gives in configuration, ServiceNow connector connects to ServiceNow Instance. ServiceNow Instance uses HTTP calls using https://{Instance URL}/api/now/doc/table/schema, to obtain the initial table schema from the ServiceNow Table API. Based on the configured Tables, it queries those tables to fetch the ServiceNow labels/metadata. Secure Workload annotates the ServiceNow labels to IP addresses in its inventory. ServiceNow connector periodically fetches new labels and updates Secure Workload inventory.


Note


Secure Workload fetches records from ServiceNow tables periodically. This is configurable under SyncInterval tab in the ServiceNow connector. The default sync interval is 60 minutes. For cases where integrating with ServiceNow table with large number of entries, this sync interval should be set to a higher value.


Note


Secure Workload will delete any entry not seen for 10 continuous sync intervals. In case the connection to ServiceNow instance is down for that long that could result in cleaning up of all labels for that instance.


Sync Interval Configuration

Secure Workload ServiceNow connector provides a way to configure the frequency of sync between Secure Workload and ServiceNow instance. By default the sync interval is set to 60 minutes, but it can be changed under the sync interval configuration as Data fetch frequency.

  • For detecting deletion of a record, Secure Workload ServiceNow connector relies on syncs from ServiceNow instances. If an entry is not seen in 48 consecutive sync intervals, we go ahead and delete the entry. This can be configured under sync interval config as Delete entry interval.

  • If any additional parameters are to be passed when calling REST APIs for ServiceNow tables, you can configure them as part of Additional Rest API url params. This configuration is optional. For example, to get a reference lookup from ServiceNow, use sysparm_exclude_reference_link=true&sysparm_display_value=true URL parameter.
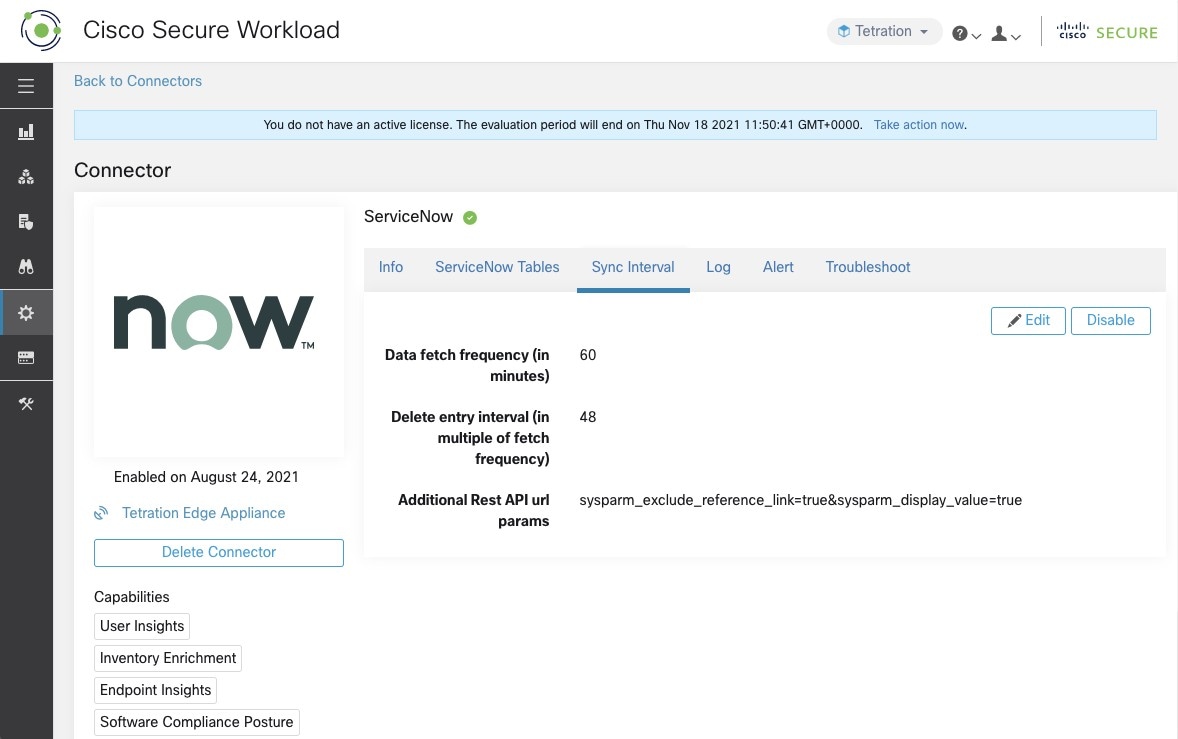
Figure 24. Sync Interval Configuration
Sync Interval Configuration

Explore Command to Delete the Labels

In case user wants to cleanup the labels for a particular IP for a given instance immediately, without waiting for delete interval, they can do so using an explore command. Here are the steps to run the command.

  1. Finding vrf ID for a Tenant

  2. Getting to Explore command UI

  3. Running the commands

For TaaS cluster, contact TaaS Operation team to cleanup labels for ServiceNow labels.

Finding VRF ID for a Tenant

Site Admins and Customer Support users can access the Tenant page under the Platform menu in the navigation bar at the left side of the window. This page displays all of the currently configured Tenants and VRFs. For more information, see the Tenants section for more details.

On Tenants page, ID field of Tenants table is vrf ID for the Tenant.

Getting to Explore Command UI

To reach the Maintenance Explorer command interface, choose Troubleshoot > Maintenance Explorer from the left navigation bar in the Secure Workload web interface.


Note


Customer Support privileges are required to access explore menu. If explore tab does not show up, the account may not have needed permissions.


Click on explore tab in the drop down menu to get to the Maintenance Explorer page.
Figure 25. Maintenance Explorer tab
Maintenance Explorer tab

Running the Commands

  • Choose the action as POST

  • Enter snapshot host as orchestrator.service.consul

  • Enter snapshot path

    To delete the labels for a particular IP for a servicenow instance: servicenow_cleanup_annotations?args=<vrf-id> <ip_address> <instance_url> <table_name>

  • Click Send


    Note


    If after deleting using explore command, we see the record show up in ServiceNow instance, it will be repopulated


Frequently Asked Questions

  • What if a ServiceNow CMDB table does not have IP address?

    In such case, the recommendation is to create a View on ServiceNow which will have desired fields from current table along with IP address (potentially coming from a JOIN operation with another table). Once such a view is created, it can be used in place of table name.

  • What if a ServiceNow instance requires MFA?

    Currently we do not support integrating with ServiceNow instance with MFA.

Limitations of ServiceNow Connectors

Metric

Limit

Maximum number of ServiceNow instances configured on one ServiceNow connector

20

Maximum number of attributes that can be fetched from one ServiceNow instance

15

Maximum number of ServiceNow connectors on one Secure Workload Edge appliance

1

Maximum number of ServiceNow connectors on one Tenant (rootscope)

1

Maximum number of ServiceNow connectors on Secure Workload

150

Connector Alerts

An appliance or service creates a connector alert when it experiences abnormal behavior.

Alert Configuration

The alert configuration for appliances and connectors enables you to generate alerts for various events. In the 3.4 release, this configuration enables all types of alerts that are potentially possible for the configured appliance/connector.

Parameter Name

Type

Description

Enable Alert

check box

Should alert be enabled?


Note


The default value for Enable Alert is true.


Figure 26. Show Alert configuration on a Secure Workload Data Ingest Appliance
Show alert configuration on a Secure Workload Data Ingest Appliance

Alert Type

The Info Tab on the appliance and connector pages contains various alert types specific to each appliance and connector.
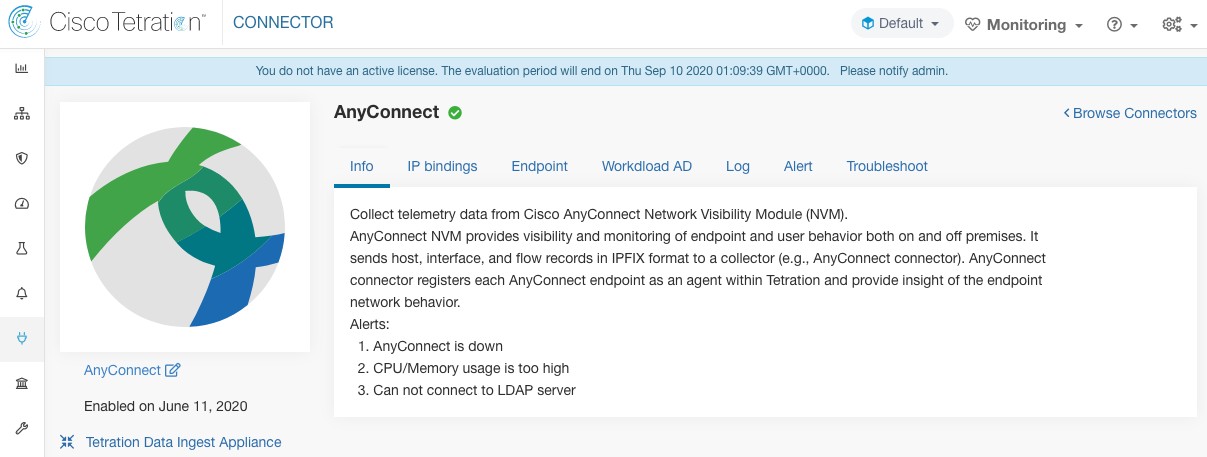
Figure 27. Alert list info
Alert list info
Appliance/Connector down

An alert generates when an appliance (or a connector) is potentially down due to missing heartbeats from the appliance/connector.

Alert text: Missing <Appliance/Connector> heartbeats, it might be down.

Severity: High
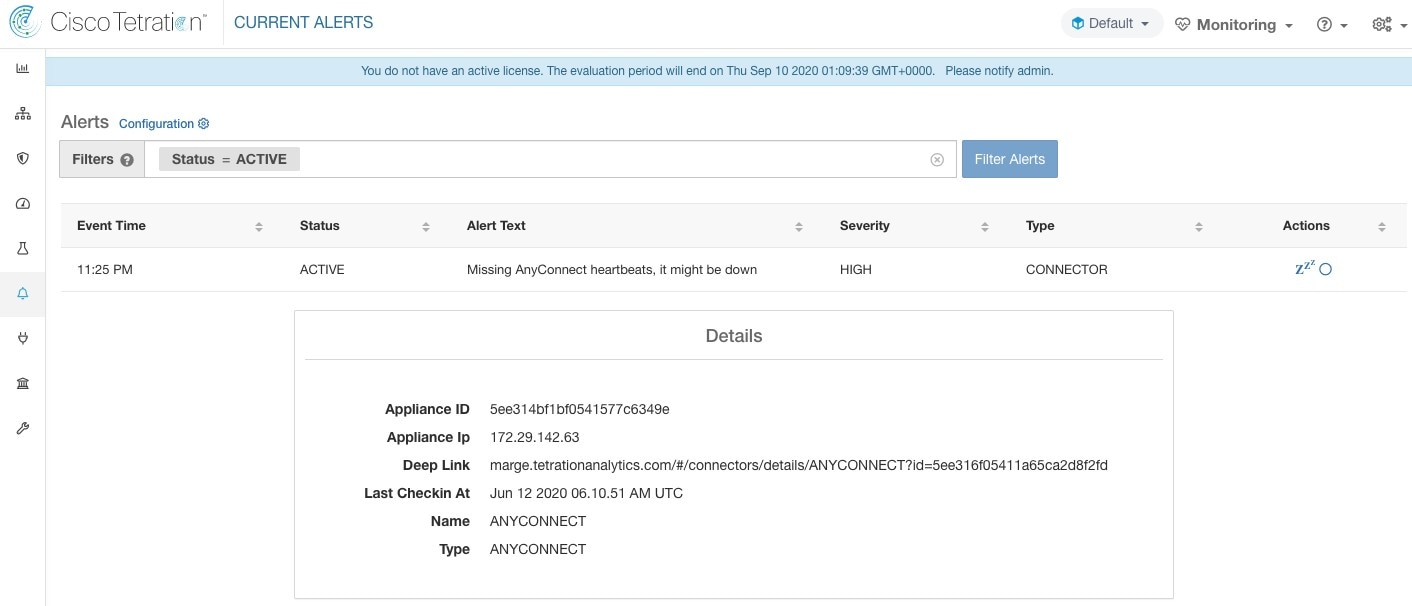
Figure 28. Alert for connector down
Alert for connector down

Allowed Secure Workload virtual appliances: Secure Workload Ingest and Secure Workload Edge

Allowed connectors: All

Appliance/Connector system usage

When system usage (CPU, memory, and disk) is more than 90% on an appliance (and a connector). The appliance (and/or connector) generates an informational alert to indicate that it’s currently handling an increased system load.

It’s normal for appliances and connectors to consume more than 90% of system resources during heavy processing activity.

Alert text: <Number> of CPU/Memory/Disk usage on <Appliance/Connector> is too high.

Severity: High
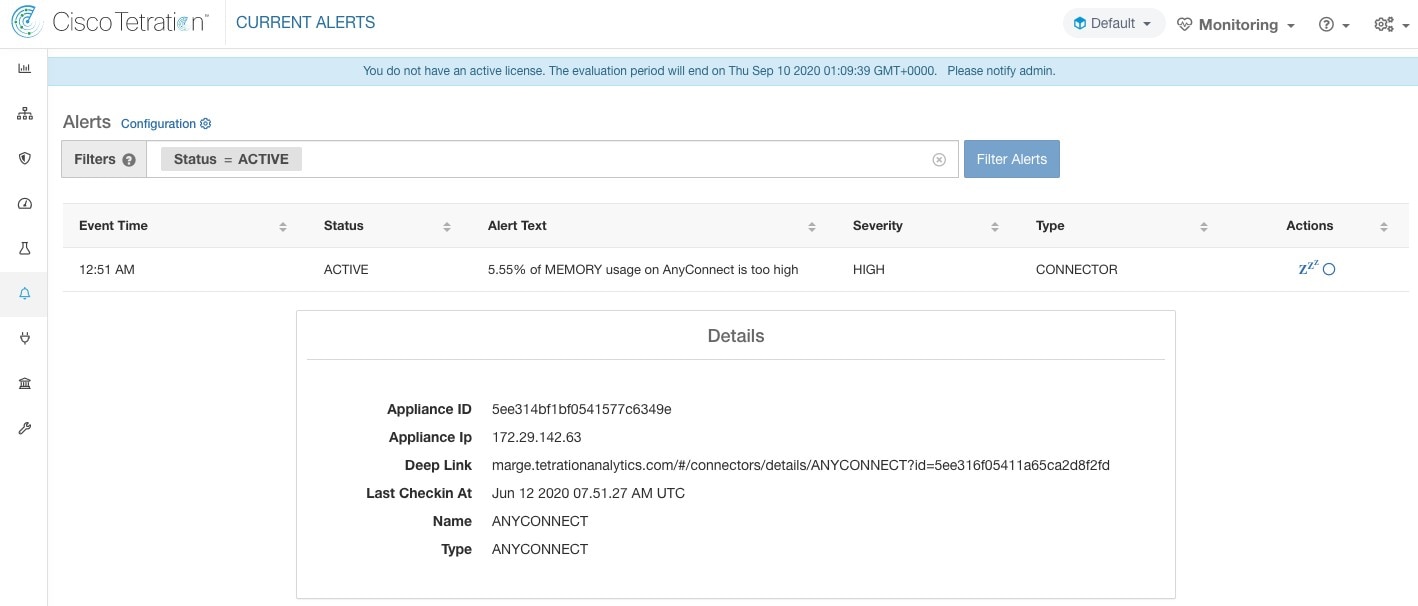
Figure 29. Alert for connector system usage too high
Alert for connector system usage too high

Allowed Secure Workload virtual appliances: Secure Workload Ingest and Secure Workload Edge

Allowed connectors: All

Connector Configuration Error

When you try to connect a configured connector to a configured server and the configuration fails, the system generates an alert to indicate a potential issue with the configuration after accepting and deploying it.

For example, The AnyConnect connector can take an LDAP configuration, validate and accept the configuration. However, during the normal operation, it is possible that the configuration is no longer valid.

Alert captures the scenario and indicates that you have to take corrective action to update the configuration.

Alert text: Cannot connect to <Appliance/Connector> server, check <Appliance/Connector> config.

Severity: High, Low

Server

Connector

LDAP server

AnyConnect, F5, ISE, WDC

ISE server

ISE

ServiceNow server

ServiceNow

Figure 30. Alert for config status error
Alert for config status error

Allowed Secure Workload virtual appliances: Secure Workload Ingest and Secure Workload Edge.

Allowed connectors: AnyConnect, F5, ISE, WDC, and ServiceNow.

Connector UI Alert Details
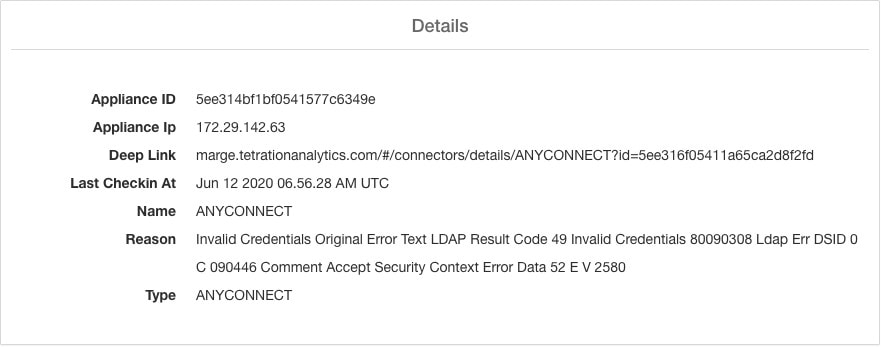
Figure 31. Connector UI Alert details
Connector UI Alert details

Alert Details

See Common Alert Structure for general alert structure and information about fields. The alert_details fields structure contains the following subfields for connector alerts.

Field

Type

Description

Appliance ID

String

Appliance ID

Appliance IP

String

Appliance IP

Connector ID

String

Connector ID

Connector IP

String

Connector IP

Deep Link

Hyperlink

Redirect to appliance/connector page

Last CheckIn At

String

Last checkin time

Name

String

Appliance/Connector name

Reason

String

The reason that Appliance/Connector can’t connect to Secure Workload

Type

String

Appliance/Connector type

Example of Alert Details

After parsing alert_details as JSON (unstringified), it will display as follows.


    {
      "Appliance ID": "5f1f3d26d674b01832c6792a",
      "Connector ID": "5f1f3e47baba512a70abee43",
      "Connector IP": "172.29.142.22",
      "Deep Link": "bingo.tetrationanalytics.com/#/connectors/details/F5?id=5f1f3e47baba512a70abee43",
      "Last checkin at": "Aug 04 2020 20.37.33 PM UTC",
      "Name": "F5",
      "Reason": "Invalid Credentials (Original error text: LDAP Result Code 49 \"Invalid Credentials\": )",
      "Type": "F5"
    }

Virtual Appliances for Connectors

Most connectors are deployed on Secure Workload virtual appliances. You will deploy required virtual appliances on an ESXi host in VMware vCenter using the OVA templates or on other KVM-based hypervisors using the QCOW2 image. For information on how to deploy virtual appliances, refer to Deploying a Virtual Appliance.

Types of Virtual Appliances

Each connector that requires a virtual appliance can be deployed on one of two types of virtual appliances.

Secure Workload Ingest

Secure Workload Ingest appliance is a software appliance that can export flow observations to Secure Workload from various connectors.

Specification
  • Number of CPU cores: 8

  • Memory: 8 GB

  • Storage: 250 GB

  • Number of network interfaces: 3

  • Number of connectors on one appliance: 3

  • Operating System: CentOS 7.9 (Secure Workload 3.8.1.19 and earlier), AlmaLinux 9.2 (Secure Workload 3.8.1.36 and later)

See important limits at Secure Workload Virtual Appliances for Connectors.


Note


Each root scope on Secure Workload can have at most 100 Secure Workload Ingest appliances deployed.


Figure 32. Secure Workload Ingest appliance
Secure Workload Ingest appliance

Secure Workload Ingest appliance allows at most 3 connectors to be enabled on an appliance. There can be more than one instance of the same connector enabled on the same appliance. For the ERSPAN Ingest appliance three ERSPAN connectors are always automatically provisioned. Many of the connectors deployed on Ingest appliance collects telemetry from various points in the network, these connectors need to listen on specific ports on the appliance. Each connector is therefore bound to one of the IP address and the default ports on which the connector should be listening to collect telemetry data. As a result, each IP address is essentially a slot that a connector occupies on the appliance. When a connector is enabled, a slot is taken (thereby, the IP corresponding to the slot). And, when a connector is disabled, the slot occupied by the connector is released (thereby, the IP corresponding to the slot). See the Secure Workload Ingest appliance slots for how to ingest appliance maintains the state of the slots.
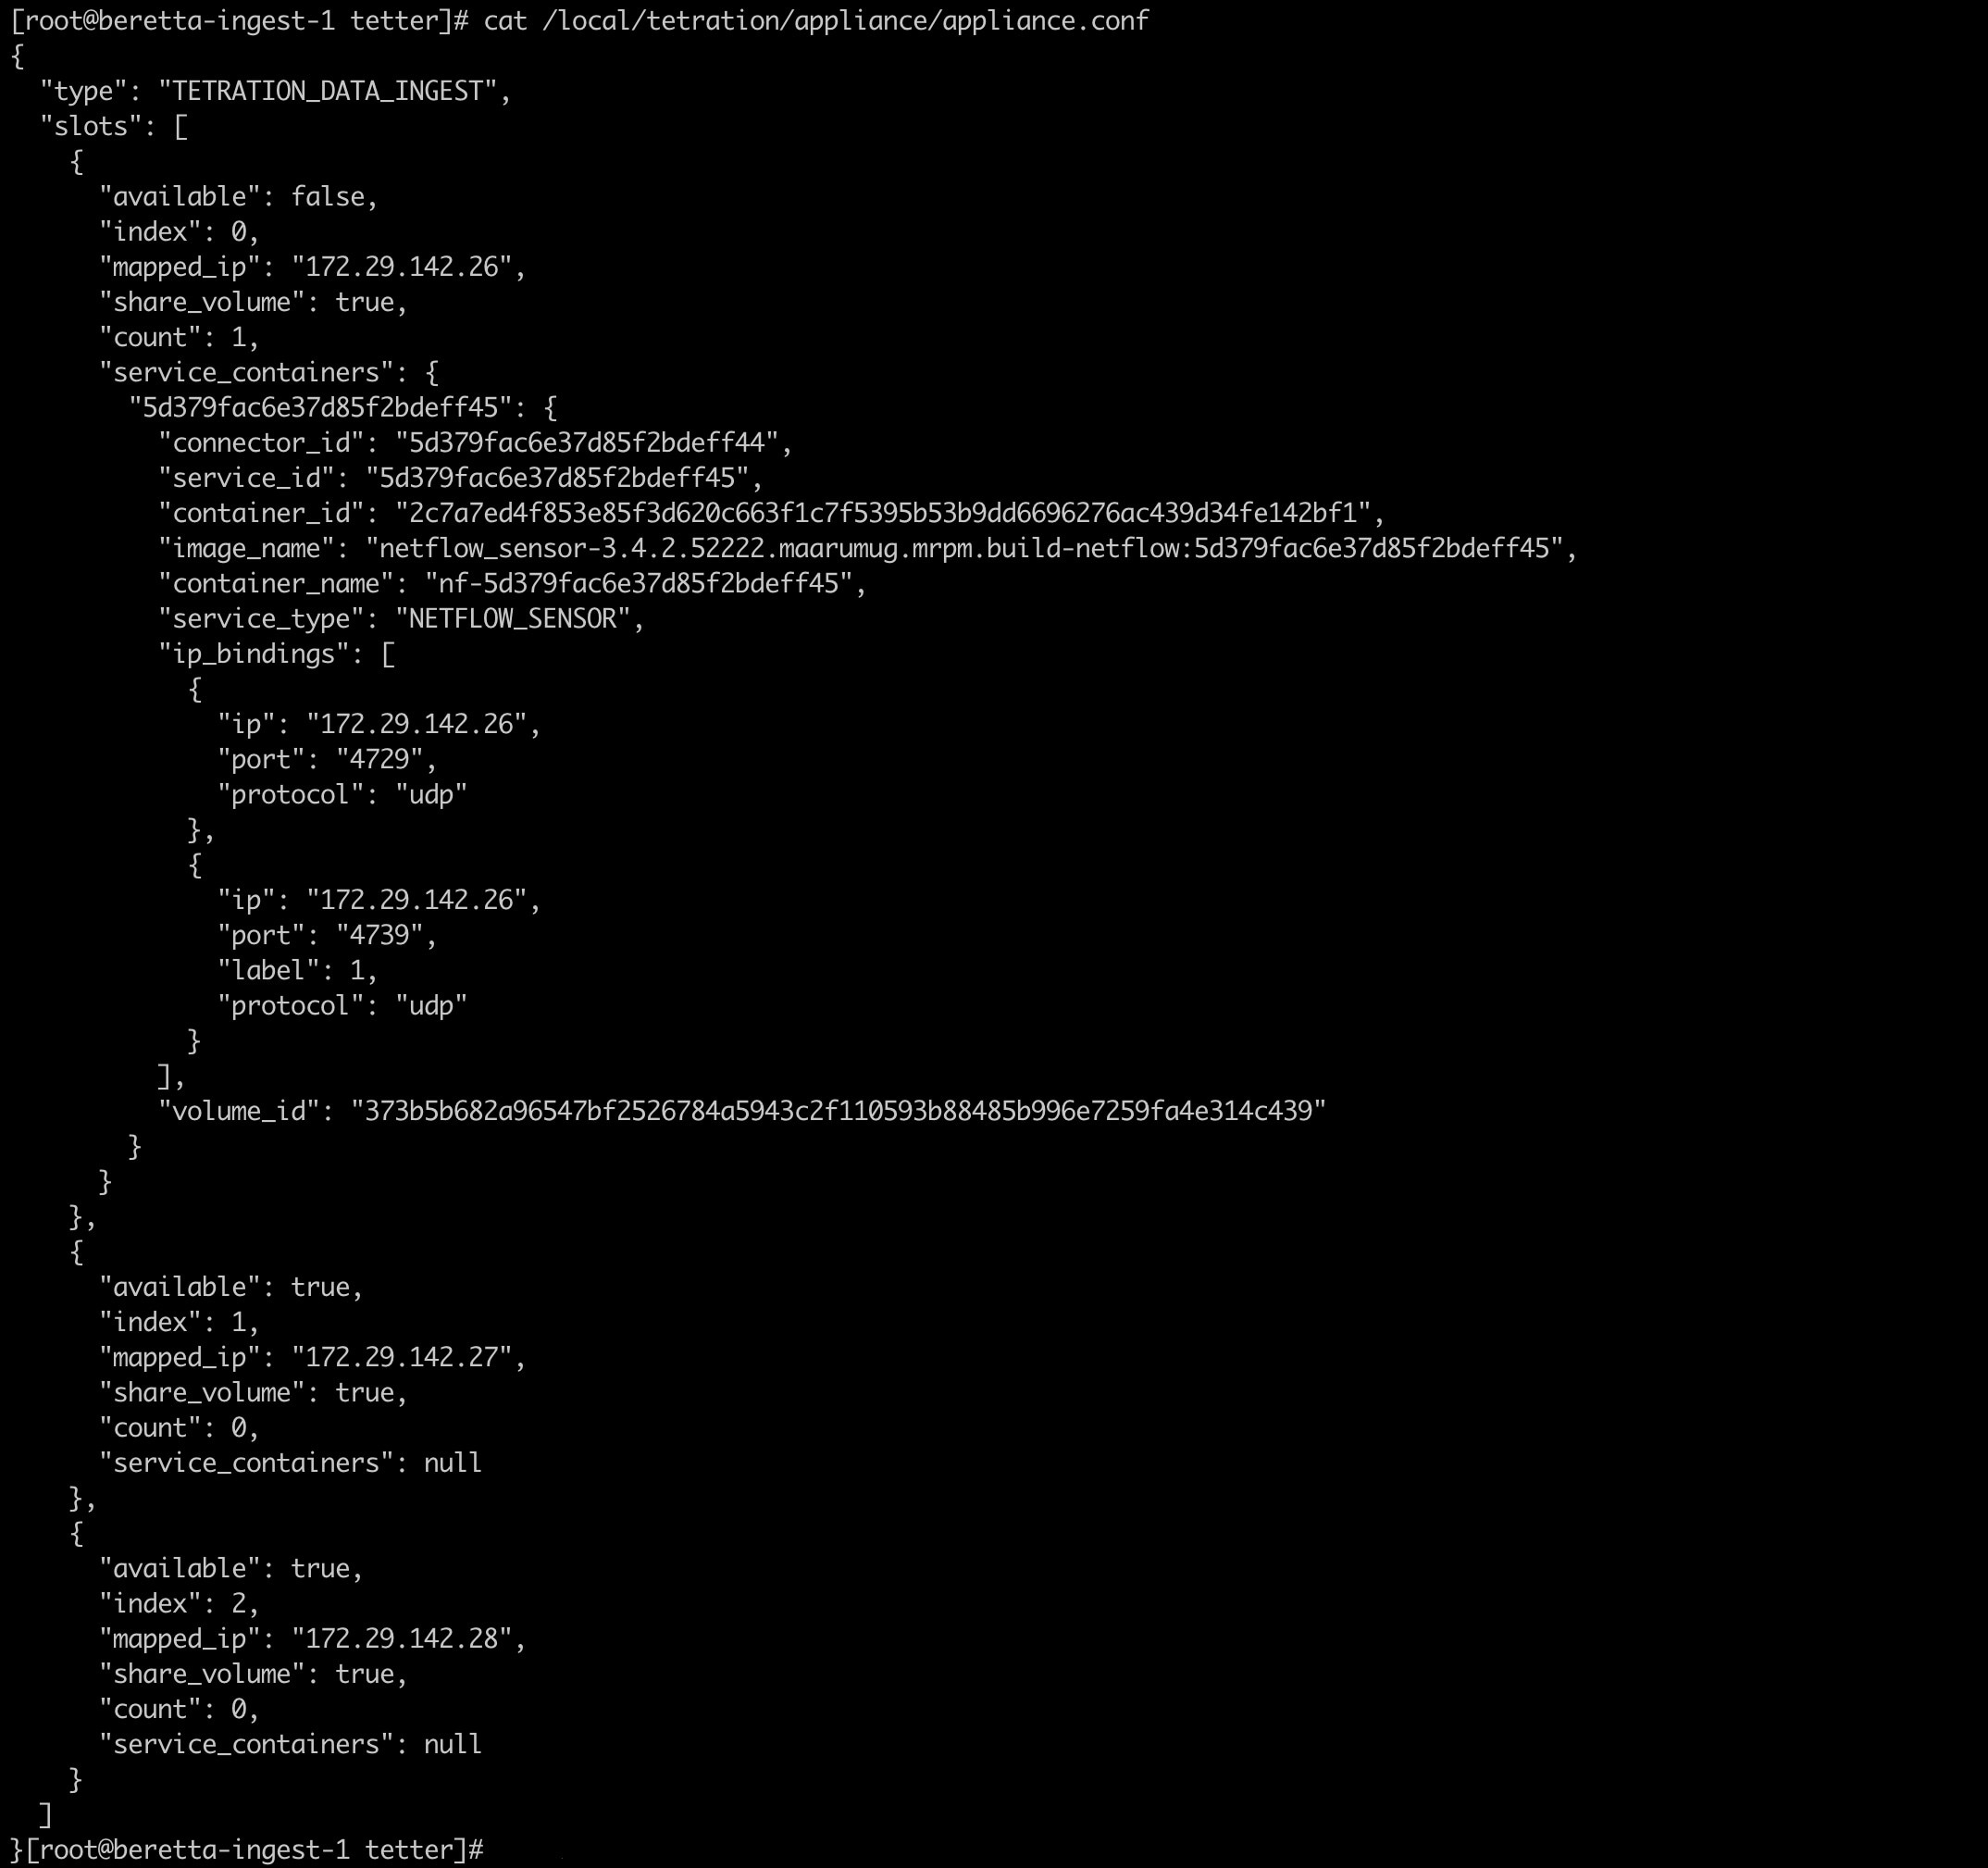
Figure 33. Secure Workload Ingest appliance slots
Secure Workload Ingest appliance slots
Allowed Configurations

Note


If there is a need to update the OS and packages to minimize vulnerabilities, redeploy both the Edge and Ingest appliances using the latest ingest OVA. For more information, see the Secure Workload Upgrade Guide.


Secure Workload Edge

Secure Workload Edge is a control appliance that streams alerts to various notifiers and collects inventory metadata from network access controllers such as Cisco ISE. In a Secure Workload Edge appliance, all alert notifier connectors (such as Syslog, Email, Slack, PagerDuty, and Kinesis), ServiceNow connector, Workload AD connector, and ISE connector can be deployed.

Specification
  • Number of CPU cores: 8

  • Memory: 8 GB

  • Storage: 250 GB

  • Number of network interfaces: 1

  • Number of connectors on one appliance: 8

  • Operating System: CentOS 7.9 (Secure Workload 3.8.1.19 and earlier), AlmaLinux 9.2 (Secure Workload 3.8.1.36 and later)

See important limits at Secure Workload Virtual Appliances for Connectors.


Note


Each root scope on Secure Workload can have at most one Secure Workload Edge appliance deployed.


Figure 34. Secure Workload Edge appliance
Secure Workload Edge appliance

The connectors deployed on Secure Workload Edge appliance do not listen on ports. Therefore, the Docker containers instantiated for the connectors on Secure Workload Edge appliance do not expose any ports to the host.

Allowed Configurations

Note


If there is a need to update the OS and packages to minimize vulnerabilities, redeploy both the Edge and Ingest appliances using the latest ingest OVA. For more information, see the Secure Workload Upgrade Guide.


Deploying a Virtual Appliance

Deploy virtual appliances on an ESXi host in VMware vCenter or other KVM-based hypervisors such as Red Hat Virtualization. This procedure prompts you to download a virtual appliance OVA template or QCOW2 image from the Cisco Software Download page.


Attention


To deploy a Secure Workload external appliance, the ESXi host where the appliance is created should have the following specifications:

  • vSphere: version 5.5 or better.

  • CPU: at least 2.2 GHz per core, and has enough reservable capacity for the appliance.

  • Memory: at least enough space to fit the appliance.


To deploy a virtual appliance to collect data from connectors:

Procedure

Step 1

In the Secure Workload web portal, from the navigation pane, choose Manage > Virtual Appliances.

Step 2

Click Enable a Connector. The type of virtual appliance you must deploy depends on the type of connector you are enabling.

Step 3

Click the type of connector for which you must create the virtual appliance. For example, click the NetFlow connector.

Step 4

On the connector page, click Enable.

Note


If a notification displays to deploy a virtual appliance, click Yes. If you do not see this notice, you may already have a virtual appliance that this connector can use, in which case you do not need to perform this procedure.

Step 5

Click the link to download the OVA template or QCOW2 image for the virtual appliance. Leave the wizard open on your screen without clicking anything else.

Step 6

Use the downloaded:

  • OVA to deploy a new OVF template on a designated ESXi host.

    • To deploy an OVA on a vSphere Web Client, follow the instructions on how to Deploy an OVF Template.

    • Ensure that the deployed VM settings match the recommended configuration for the virtual appliance type.

    • Do not power on the deployed VM

  • QCOW2 image to create a new VM on KVM hypervisors such as Red Hat Virtualization.

Step 7

After the VM is deployed, but before you power it on, return to the virtual appliance deployment wizard in the Secure Workload web portal.

Step 8

Click Next in the virtual appliance deployment wizard.

Step 9

Configure the virtual appliance by providing IP addresses, gateways, hostname, DNS, proxy server settings and docker bridge subnet configuration. See the screenshot for Configuring the VM with network parameters.

  • If the appliance must use proxy server to reach Secure Workload, check the box Use proxy server to connect to Secure Workload. If this is not set correctly, connectors may not be able to communicate with Secure Workload for control messages, register connectors, and send flow data to the Secure Workload collector.

  • If the IP addresses and gateways of the appliance conflict with the default docker bridge subnet (172.17.0.1/16), the appliance can be configured with a customized docker bridge subnet that is specified in Docker Bridge (CIDR format) field. This requires appliance OVA 3.3.2.16 or later.

Step 10

Click Next.

Step 11

In the next step, a VM configuration bundle will be generated and available for download. Download the VM configuration bundle. See the screenshot for Download the VM configuration bundle.

Step 12

Upload the VM configuration bundle to the datastore corresponding to the target ESXi host or other virtualization host.

Step 13

[Applicable only when using QCOW2 image] Complete the following configurations on the other virtualization host where you have uploaded the VM configuration bundle:

  • For ingest appliances, configure three network interfaces.

    Figure 35. Example of Configuring Network Interfaces in KVM-Based Environments
    Example of configuring network interfaces in KVM-based environments
  • In the memory allocation, specify the minimum requirement of 8192 MB of RAM.

  • Specify the total number of virtual CPUs to be 8.

    Figure 36. Example of Configuring System Resources in KVM-Based Environments
    Example of configuring system resources in KVM-based environments

Step 14

Edit the VM settings and mount the VM configuration bundle from the datastore to the CD/DVD drive. Make sure to select Connect at Power On check box.

Step 15

Power on the deployed VM.

Step 16

When the VM boots up and configures itself, it connects back to Secure Workload. This may take a few minutes. The appliance status on Secure Workload should transition from Pending Registration to Active. See the screenshot for Secure Workload Ingest appliance in Pending Registration state.

Note


We do not recommend vMotion to be enabled for Secure Workload external appliances.

Note


We recommend using Secure Workload external appliance OVAs as-is and to reserve 8 vCPU cores and 8192 MB of memory for QCOW2 images to deploy VMs. If sufficient resources are not available, the VM setup script would fail after the boot.

When the appliance is Active, connectors can be enabled and deployed on it.
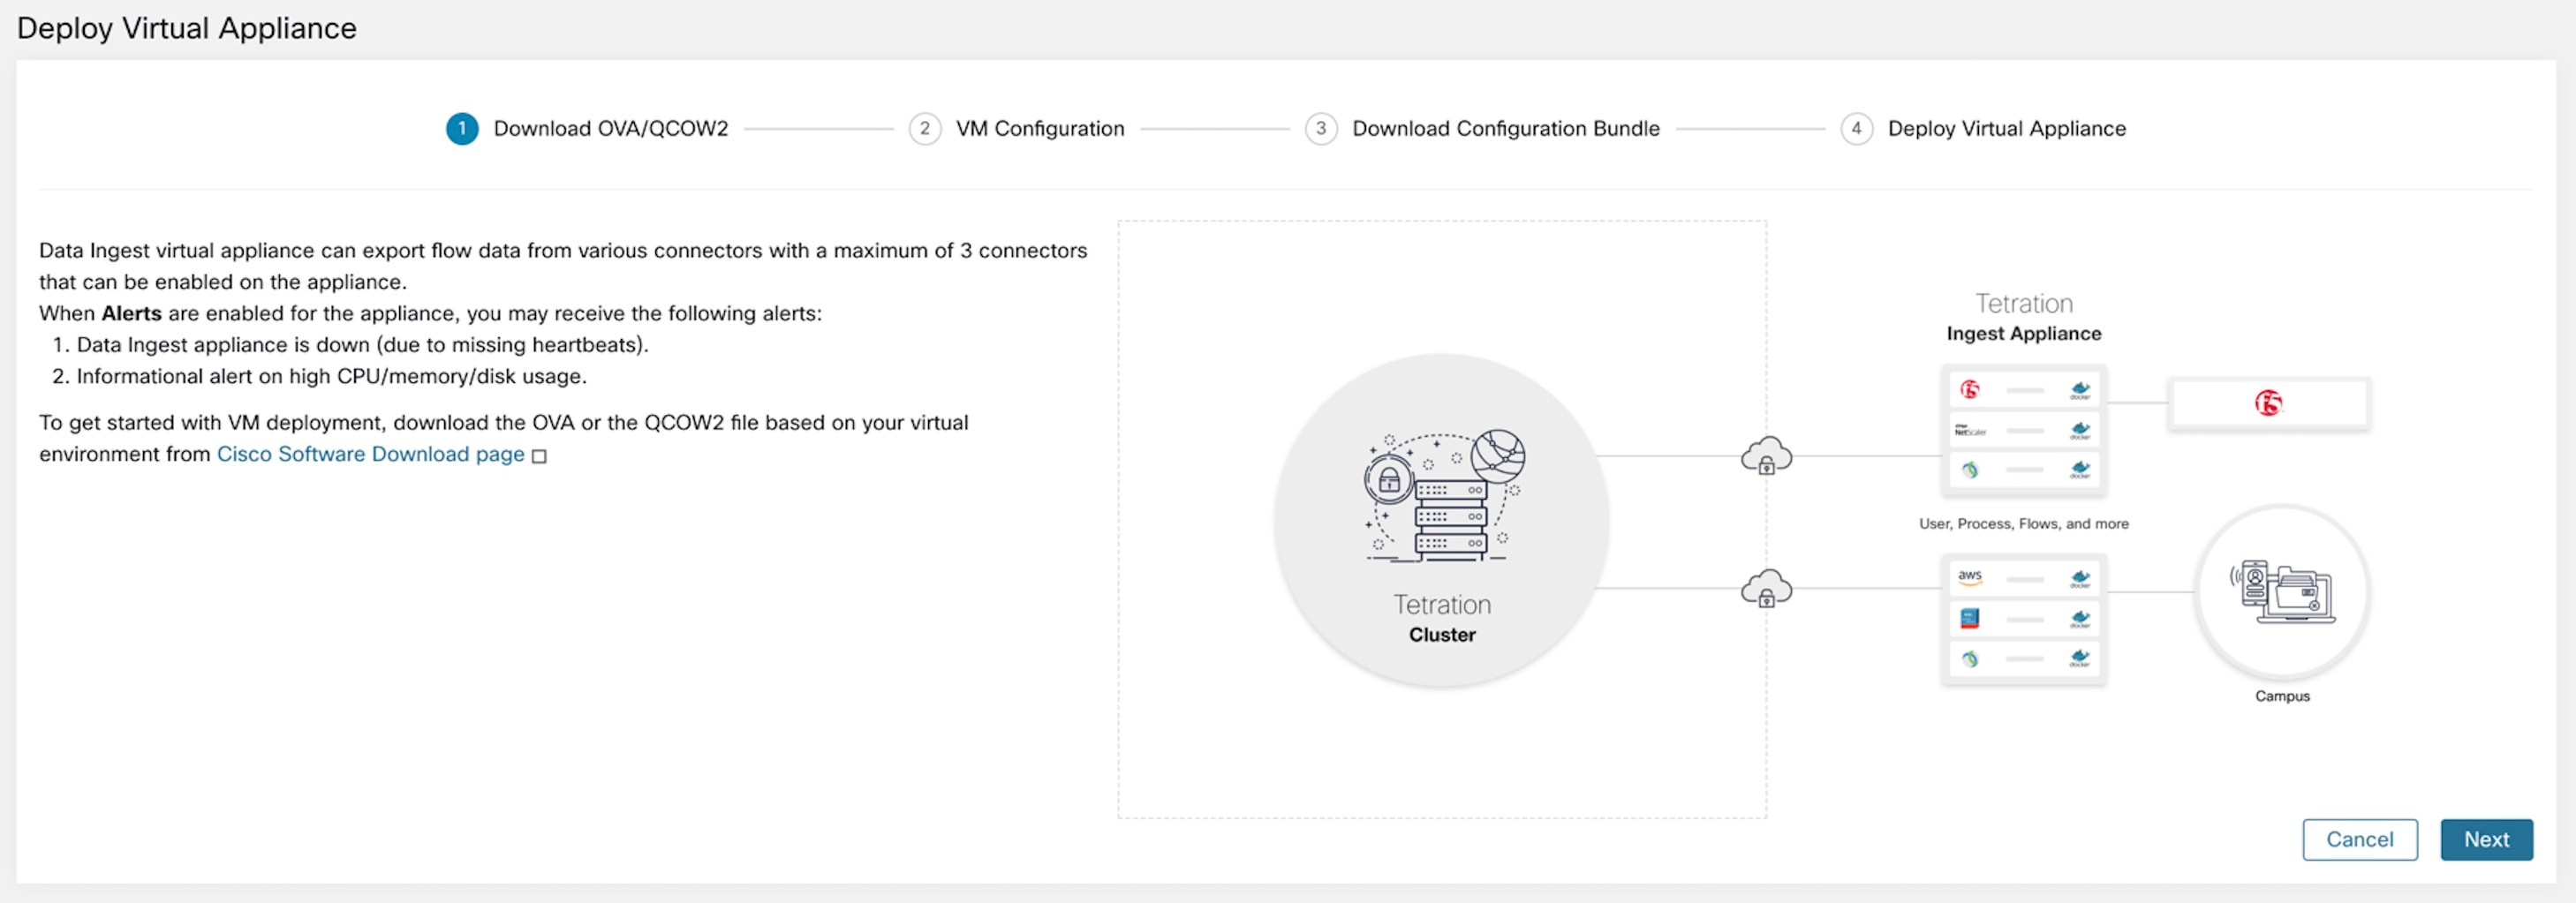
Figure 37. Deploying a Secure Workload Ingest Appliance
Deploying a Secure Workload Ingest appliance
Figure 38. Configuring the VM with Network Parameters
Configuring the VM with network parameters
Figure 39. Download the VM Configuration Bundle
Download the VM configuration bundle
Figure 40. Deploy the VM
Deploy the VM
Figure 41. Secure Workload Ingest Appliance in Pending Registration State
Secure Workload Ingest appliance in Pending Registration state

When a virtual appliance is deployed and booted up for the first time, tet-vm-setup service executes and sets up the appliance. This service is responsible for the following tasks.

  1. Validate the appliance: validate the appliance for mandatory resource requirements for the type of the virtual appliance deployed.

  2. IP address assignment: assign IP addresses to all the network interfaces provisioned on the appliance.

  3. Hostname assignment: assign hostname for the appliance (if hostname is configured).

  4. DNS configuration: update the DNS resolv.conf file (if name server and/or search-domain parameters are configured).

  5. Proxy server configuration: update HTTPS_PROXY and NO_PROXY settings on the appliance (if provided).

  6. Prepare appliance: copies cert bundle for the Kafka topic over which appliance management messages are sent and received.

  7. Install appliance controller: install and bring up Appliance Controller which is managed by supervisord as tet-controller service.

When tet-controller is instantiated, it takes over the management of the appliance. This service is responsible for the following functions:

  1. Registration: registers the appliance with Secure Workload. Until the appliance is registered, no connectors can be enabled on the appliance. When Secure Workload receives a registration request for an appliance, it updates the state of the appliance to Active.

  2. Deploying a connector: deploys a connector as a Docker service on the appliance. For more information, see Enabling a Connector.

  3. Deleting a connector: stops and removes the Docker service and the corresponding Docker image from the appliance. For more information, see Deleting a Connector.

  4. Configuration updates on appliances: tests and applies configuration updates on the appliance. For more information, see Configuration Management on Connectors and Virtual Appliances.

  5. Troubleshooting commands on appliances: executes allowed set of commands on the appliances for troubleshooting and debugging issues on the appliance. For more information, see the Troubleshooting.

  6. Heartbeats: periodically sends heartbeats and statistics to Secure Workload to report the health of the appliance. For more information, see Monitoring a Virtual Appliance.

  7. Pruning: periodically prune all Docker resources that are unused or dangling in order to recover storage space. This task is executed when every 24 hours.

  8. Decommissioning the appliance: decommissions and deletes all Docker instances from the appliance. For more information, see Decommissioning a Virtual Appliance.

The list of deployed virtual appliances can be found at: Manage > Virtual Appliances
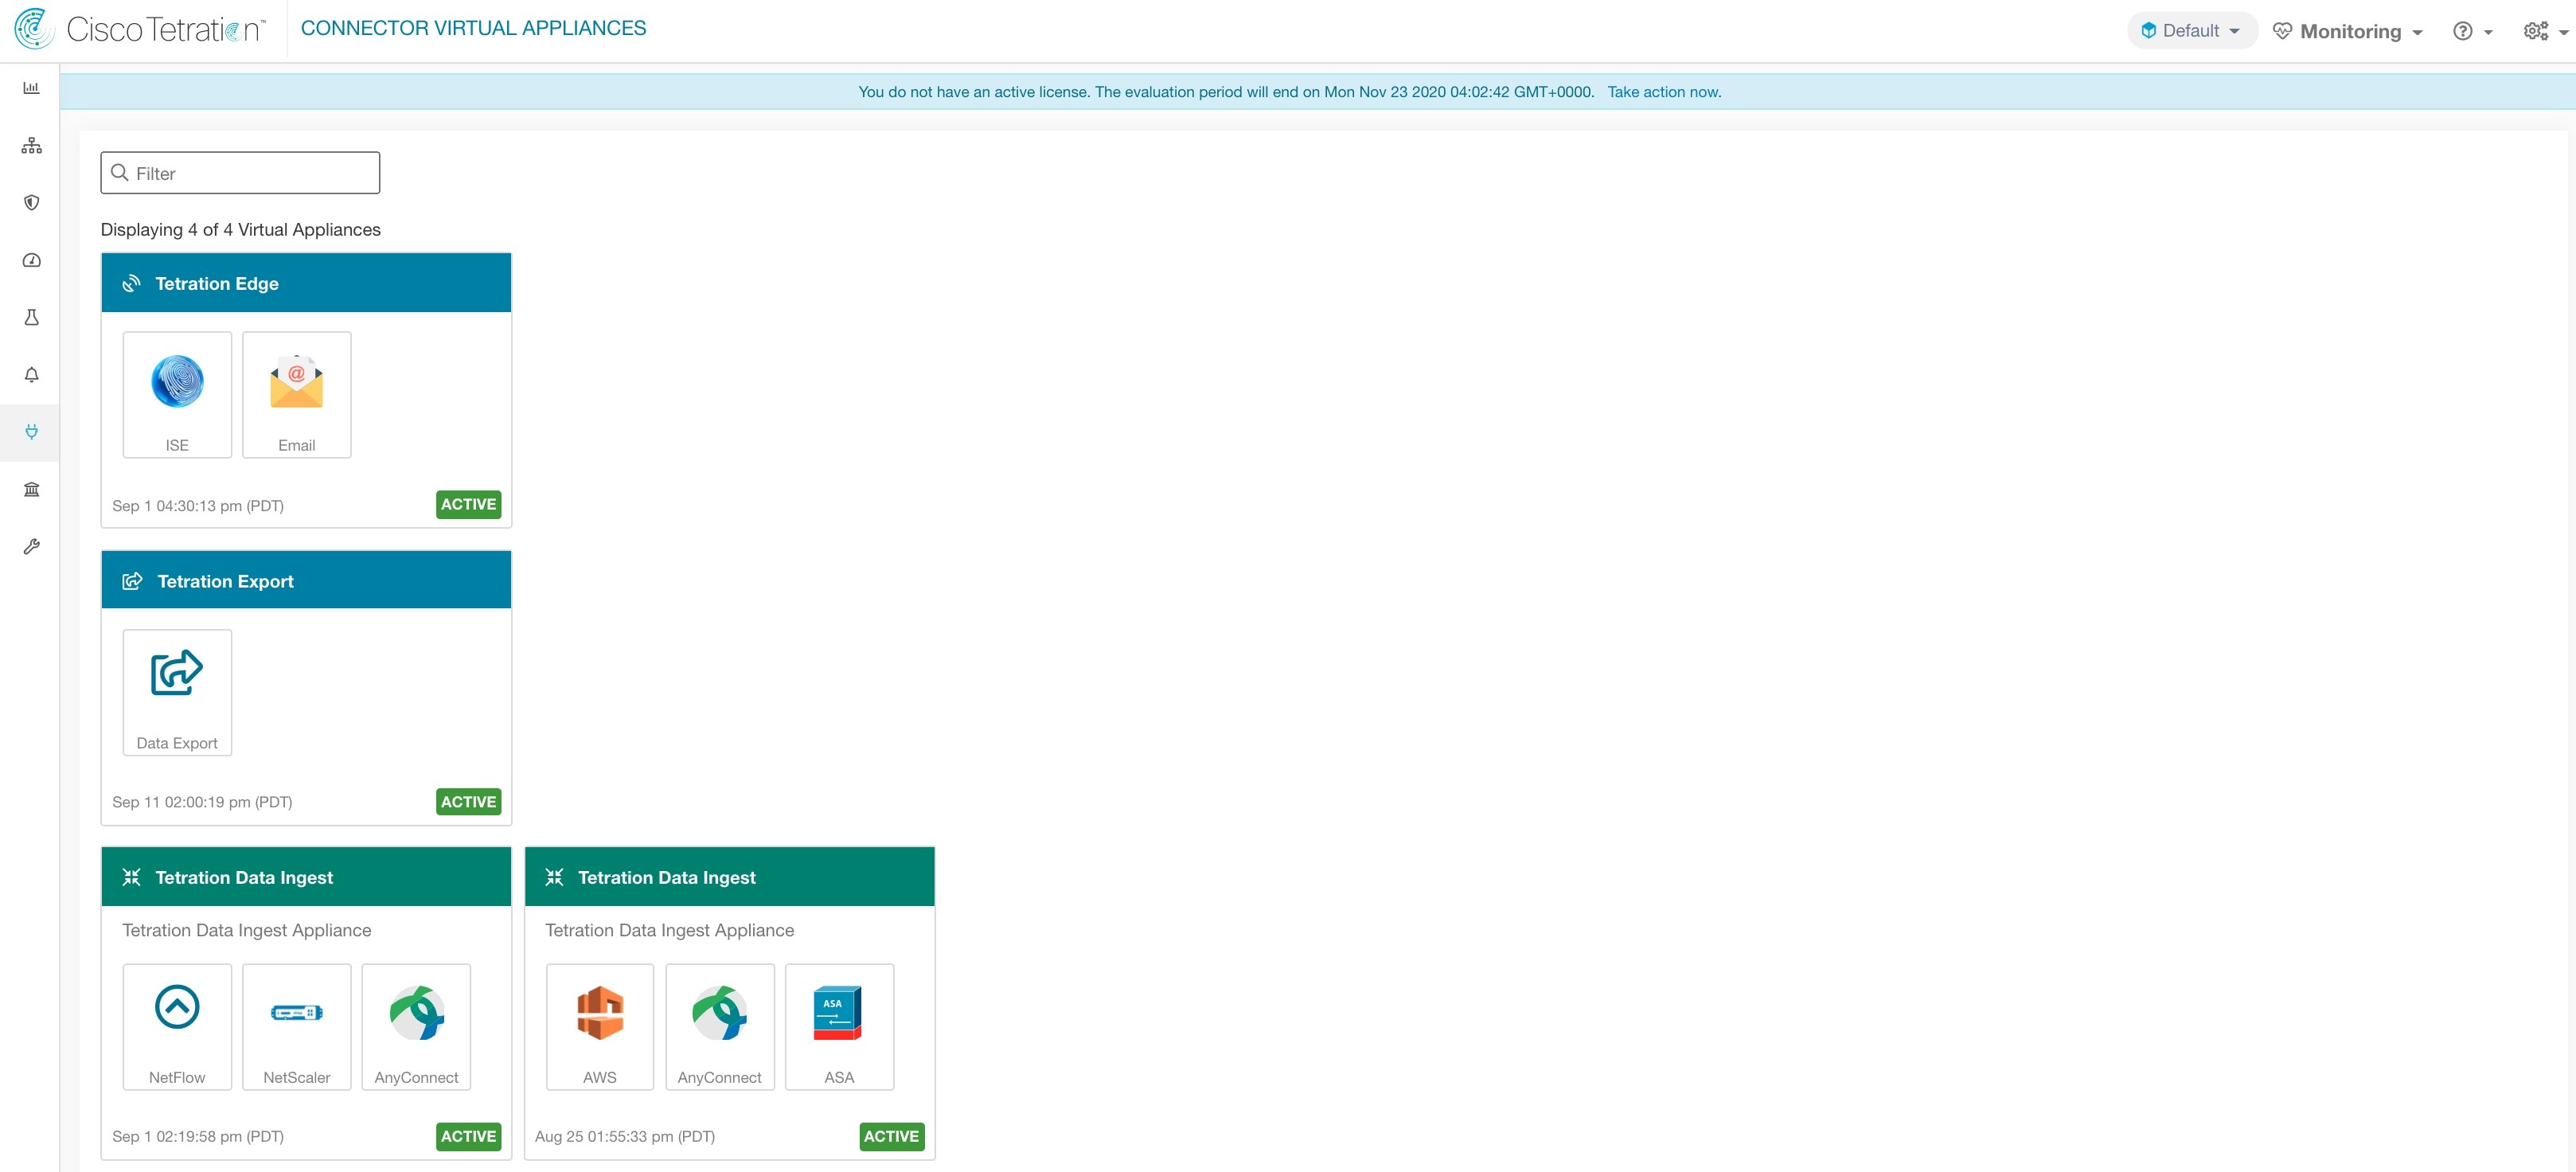
Figure 42. List of Deployed Virtual Appliances
List of deployed virtual appliances

Decommissioning a Virtual Appliance

A virtual appliance can be decommissioned from Secure Workload. When an appliance is decommissioned, the following actions are triggered.

  1. All configurations on the appliance and the connectors enabled on the appliance are removed.

  2. All the connectors enabled on the appliance are deleted.

  3. The appliance is marked Pending Delete.

  4. When the appliance replies back with a successful delete response, appliance Kafka topic and certs are deleted.


    Note


    Decommissioning an appliance cannot be undone. To restore the appliance and the connectors, a new appliance should be deployed and the connectors should be enabled on the new appliance.


Monitoring a Virtual Appliance

Secure Workload virtual appliances periodically send heartbeats and statistics to Secure Workload. The heartbeat interval is 5 minutes. The heartbeat messages include statistics about the health of the appliance include system statistics, process statistics, and statistics about how many messages sent/received/error-ed over the Kafka topic that is used for the appliance management.

All metrics are available in Digger (OpenTSDB) and are labelled with appliance ID and root scope name. Additionally, Grafana dashboards for Appliance Controller are also available for important metrics from the appliance.

Security Considerations

The Ingest/Edge Virtual Machine’s guest Operating System is CentOS 7.9, from which OpenSSL server/clients packages were removed. Therefore, the only way to access the appliance is via its console.


Note


CentOS 7.9 is the guest operating system for Ingest and Edge virtual appliances in Secure Workload 3.8.1.19 and earlier releases. Starting Secure Workload 3.8.1.36, the operating system is AlmaLinux 9.2.


The containers run a centos:7.9.2009 based Docker image. Most the containers are run with the base privileges (no-privileged option), except for ERSPAN container, which has the NET_ADMIN capability.


Note


Starting Secure Workload 3.8.1.36, the containers run almalinux/9-base:9.2.


In the unlikely case a container is compromised, the VM guest OS should not be compromisable from inside the container.

Configuration Management on Connectors and Virtual Appliances

Configuration updates can be pushed to appliances and connectors from Secure Workload. The appliance should have registered successfully with Secure Workload and be Active before configuration updates can be initiated. Similarly, the connectors should have registered with Secure Workload before configuration updates can be initiated on the connector services.

There are three modes of configuration updates possible in appliances and connectors.

  1. Test and Apply: Test the configuration and on successful test, commit the configuration.

  2. Discovery: Test the configuration, and on successful test, discovery additional properties that can be enabled for the configuration.

  3. Remove: Remove the configuration.


    Note


    ERSPAN appliance and connector do not support configuration updates.


Test and Apply

Configurations that support Test and Apply mode verify the configuration before applying (committing) the configuration on the desired appliance and/or connector.

NTP Configuration

NTP configuration allows the appliance to synchronize the clock with the specified NTP server(s).

Parameter Name

Type

Description

Enable NTP

checkbox

Should NTP sync be enabled?

NTP Servers

listof

strings

List of NTP servers. At least one server should be given and at most 5 servers may be provided.

Test: Test if a UDP connection can be made to the given NTP servers on port 123. If an error occurs for any of the NTP servers, do not accept the configuration.

Apply: Update /etc/ntp.conf and restart ntpd service using systemctl restart ntpd.service. Here is the template for generating the ntp.conf
# --- GENERAL CONFIGURATION ---
server <ntp-server>
...
server 127.127.1.0
fudge 127.127.1.0 stratum 10
# Drift file
driftfile /etc/ntp/drift

Note


Applicable to Secure Workload 3.8.1.19 and earlier.


For Secure Workload 3.8.1.36 and later, update /etc/chrony.conf and restart chronyd service using systemctl restart chronyd.service. Here is the template for generating the chrony.conf
# Secure Workload appliance chrony.conf.
server <ntp-server> iburst
...
driftfile /var/lin/chrony/drift
makestep 1.0 3
rtcsync

Allowed Cisco Secure Workload virtual appliances: All

Allowed connectors: None
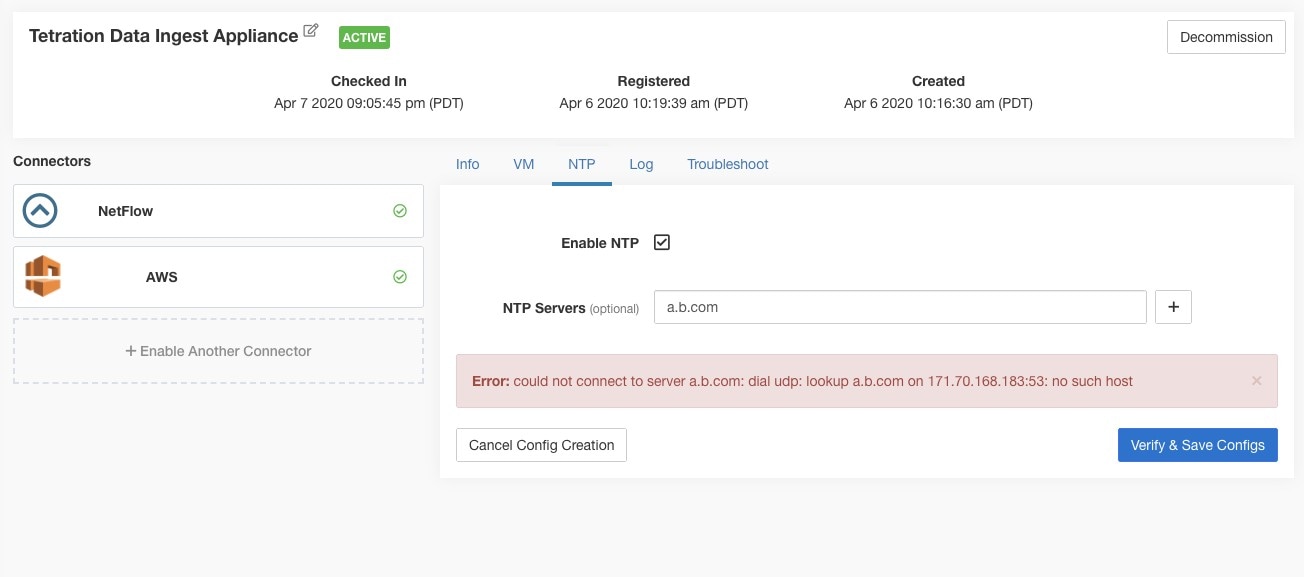
Figure 43. Error while testing NTP configuration
Error while testing NTP configuration
Figure 44. NTP configuration with valid NTP servers
NTP configuration with valid NTP servers
Figure 45. NTP configuration verified and applied
NTP configuration verified and applied
Log Configuration

Log configuration updates the log levels, maximum size of the log files, and log rotation parameters on the appliance and/or connector. If the configuration update is triggered on the appliance, appliance controller log settings are updated. On the other hand, if the configuration update is triggered on a connector, service controller and service log settings are updated.

Parameter Name

Type

Description

Logging level

dropdown

Logging level to be set

  • debug

Debug log level

  • info

Informational log level

  • warn

Warning log level

  • error

Error log level

Max log file size (in MB)

number

Maximum size of a log file before log rotation kicks in

Log rotation (in days)

number

Maximum age of a log file before log rotation kicks in

Log rotation (in instances)

number

Maximum instances of log files kept

Test: No op.

Apply: If the configuration is trigged on an appliance, update the configuration file of tet-controller on the appliance. If the configuration is triggered on a connector, update the configuration files of tet-controller and the service managed by the controller on the Docker container responsible for the connector.

Allowed Secure Workload virtual appliances: All

Allowed connectors: NetFlow, NetScaler, F5, AnyConnect, ISE, ASA, and Meraki.

Figure 46. Log configuration on the appliance
Log configuration on the appliance

Note


Since all alert notifier Connectors (Syslog, Email, Slack, PagerDuty, and Kinesis) run on a single Docker service (Secure Workload Alert Notifier) on Secure Workload Edge, it is not possible to update the log config of a connector without impacting the config of another alert notifier connector. The log configurations of Secure Workload Alert Notifier (TAN) Docker service on Secure Workload Edge appliance can be updated using an allowed command.


See Update Alert Notifier Connector Log Configuration for more details.

Endpoint Configuration

Endpoint configuration specifies the inactivity timeout for endpoints on AnyConnect and ISE connectors. When an endpoint times out, the connector stops checking in with Secure Workload and purges the local state for the endpoint on the connector.

Parameter Name

Type

Description

InactivityTimeout for Endpoints(in minutes)

number

Inactivity timeout for endpoints published by AnyConnect / ISE connectors. On timeout, the endpoint will not longer checkin Secure Workload. Default is 30 minutes.

Test : No op.

Apply : Update the configuration file of the connector with the new value

Allowed Secure Workload virtual appliances: None

Allowed connectors: AnyConnect and ISE

Figure 47. Endpoint inactivity timeout configuration on AnyConnect connector
Endpoint inactivity timeout configuration on AnyConnect connector
Slack Notifier Configuration

By default, the Secure Workload alerts are published to the Slack connector.

Parameter Name

Type

Description

Slack Webhook URL

string

Slack webhook on which Secure Workload alerts should be published

Test: To test the configuration, send a test alert to Slack using the webhook. If the alert is posted successfully, the test passes.

Apply: Update the configuration file of the connector with the specified parameters.

Allowed Secure Workload virtual appliances: None

Allowed connectors: Slack

PagerDuty Notifier Configuration

By default, the Secure Workload alerts are published to the PagerDuty connector.

Parameter Name

Type

Description

PagerDuty Service Key

string

PagerDuty service key for pushing Secure Workload alerts on PagerDuty

Test: To test the configuration, send a test alert to PagerDuty using the service key. If the alert is published successfully, the test passes.

Apply: Update the configuration file of the connector with the specified parameters.

Allowed Secure Workload virtual appliances: None

Allowed connectors: PagerDuty

Kinesis Notifier Configuration

By default, the Secure Workload alerts are published to the Amazon Kinesis connector.

Parameter Name

Type

Description

AWS Access Key ID

string

AWS access key ID to communicate with AWS

AWS Secret Access Key

string

AWS secret access key to communicate with AWS

AWS Region

dropdown of AWS regions

Name of the AWS region where Kinesis stream is configured

Kinesis Stream

string

Name of the Kinesis stream

Stream Partition

string

Partition Name of the stream

Test: To test the configuration, send a test alert to the Kinesis stream. If the alert is published successfully, the test passes.

Apply: Update the configuration file of the connector with the specified parameters.

Allowed Secure Workload virtual appliances: None

Allowed connectors: Kinesis

Email Notifier Configuration

The process of alert email transmission using TAN service in Secure Workload Edge Appliance enables Secure Workload to integrate alerting seamlessly with email systems by notifying recipients directly through email:

  • Email connector configuration–The Email Connector is set up with SMTP server details, including optional authentication mechanisms (basic SMTP authentication or modern Microsoft authentication). It also defines default recipient email addresses for alert delivery. This configuration can be customized for alerts, if needed.

  • TAN service activation–When the Email connector is enabled on the Secure Workload Edge appliance, the TAN service is configured to handle alert notifications through email.

  • Alert generation–The Secure Workload system continuously monitors workload security and generates alerts based on detected events or anomalies.

  • Alert dispatch–After alert generation, the TAN service uses the Email connector configuration to format and send alert emails. The service acts as an alert publisher that pushes these notifications from the Edge appliance to the configured SMTP server.

Configure the SMTP Email connector using one of the authentication methods:

  • Basic SMTP authentication

  • Modern Microsoft authentication

Basic SMTP Authentication

The Basic SMTP authentication method uses SMTP username and password for authentication.

The following parameters are configured for Basic SMTP authentication:

Parameter Name

Type

Description

SMTP Username

String

(Optional) SMTP server username

SMTP Password

String

(Optional) SMTP server password for the user (if given)

SMTP Server

String

IP address or hostname of the SMTP server

SMTP Port

Number

Listening port of the SMTP server

Secure Connection

Check box

Option to use SSL for SMTP server connection

From Email Address

String

Email address from which alerts are sent.

Default Recipients

String

Comma-separated list of recipient email addresses.

Modern Microsoft Authentication

The modern Microsoft authentication (OAuth 2.0 authentication) method uses Microsoft client ID, Microsoft tenant ID, and client secret for authentication instead of username and password.

The following parameters are configured for modern Microsoft authentication:

Parameter Name

Type

Description

Tenant ID

String

Unique identifier for your Microsoft Entra ID domain.

Client ID

String

Unique identifier of the registered application or client.

Client Secret

String

Application secret that you created in Microsoft Entra ID domain for your application.

SMTP Server

String

IP address or hostname of the SMTP server.

The mandatory value supported is smtp.office365.com.

SMTP Port

Number

Listening port of the SMTP server.

The mandatory value supported is 587.

Secure Connection

Check box

Option to use SSL for SMTP server connection.

From Email Address

String

Email addresst from which alerts are sent.

Default Recipients

String

Comma-separated list of recipient email addresses.

By default, Secure Workload alerts are published to the Email connector.

Test: To test the configuration, send a test email.

Apply: Update the configuration file of the connector with the specified parameters.

Allowed Secure Workload virtual appliances: None

Allowed connectors: Email

Syslog Notifier Configuration

Default configuration for publishing Secure Workload alerts on Syslog.

Parameter Name

Type

Description

Protocol

dropdown

Protocol to use to connect to server

UDP
TCP

Server Address

string

IP address or hostname of the Syslog server

Port

number

Listening port of Syslog server. Default port value is 514.

Test: Send a test alert to Syslog server using the given configuration. If the alert is published successfully, the test passes.

Apply: Update configuration file of the connector with the specified parameters.

Allowed Secure Workload virtual appliances: None

Allowed connectors: Syslog

Syslog Severity Mapping Configuration

The following table shows the default severity mapping for Secure Workload alerts on Syslog

Secure Workload Alerts Severity

Syslog Severity

LOW

LOG_DEBUG

MEDIUM

LOG_WARNING

HIGH

LOG_ERR

CRITICAL

LOG_CRIT

IMMEDIATE ACTION

LOG_EMERG

You can modify this setting using this configuration.

Parameter Name

Dropdown of mappings

IMMEDIATE_ACTION

  • Emergency

  • Alert

  • Critical

  • Error

  • Warning

  • Notice

  • Informational

  • Debug

CRITICAL

HIGH

MEDIUM

LOW

Test: No op.

Apply: Update configuration file of the connector with the specified parameters.

Allowed Secure Workload virtual appliances: None

Allowed connectors: Syslog

ISE Instance Configuration

This configuration provides the parameters required to connect to the Cisco Identity Services Engine (ISE). By providing multiple instances of this configuration, the ISE connector can connect and pull metadata about endpoints from multiple ISE appliances. Up to 20 instances of ISE configuration may be provided.

Parameter Name

Type

Description

ISE Client Certificate

string

ISE client certificate to connect to ISE using pxGrid

ISE Client Key

string

ISE client key to connect to ISE

ISE Server CA Certificate

string

CA certificate of ISE

ISE Hostname

string

FQDN of ISE pxGrid

ISE Nodename

string

Node name of ISE pxGrid

Test: Connect to ISE using the given parameters. On successful connection, accept the configuration.

Apply: Update configuration file of the connector with the specified parameters.

Allowed Secure Workload virtual appliances: None

Allowed connectors: ISE

Discovery

Configurations that support Discovery mode do the following.

  1. Collect a basic configuration from the user.

  2. Verify the basic configuration.

  3. Discovery additional properties about the configuration and present them to the user.

  4. Let the user enhance the configuration using the discovered properties.

  5. Verify and apply the enhanced configuration.

In the 3.3.1.x release, LDAP configuration supports discovery mode.

LDAP Configuration

LDAP configuration specifies how to connect to LDAP, what is the base Distinguished Name (DN) to use, what is the attribute that corresponds to username, and what attributes to fetch for each username. LDAP attributes are properties of LDAP that are specific to that environment.

Given the configuration of how to connect to LDAP and the base DN, it is possible to discover the attributes of users in LDAP. These discovered attributes can then be presented to the user in the UI. From these discovered attributes, the user selects the attribute that corresponds to the username and a list of up to six attributes to collect for each username from LDAP. As a result, this eliminates the manual configuration of the LDAP attributes and reduces errors.

Here are the detailed steps for creating LDAP configuration through discovery.

Procedure

Step 1

Start the LDAP Configuration

Initiate an LDAP configuration for the connector.

Figure 48. Start the LDAP Configuration Discovery
Start the LDAP configuration discovery

Step 2

Provide Basic LDAP Configuration

Specify the basic configuration for connecting to LDAP. In this configuration, the users provide the LDAP Bind DN or username to connect to LDAP server, LDAP password to use to connect to LDAP server, LDAP server address, LDAP server port, Base DN to connect to, and a filter string to fetch users that match this filer.

Parameter Name

Type

Description

LDAP Username

string

LDAP username or bind DN to access LDAP server*

LDAP Password

string

LDAP password for the username to access LDAP server*

LDAP Server

string

LDAP server address

LDAP Port

number

LDAP server port

Use SSL

checkbox

Should the connector connect to LDAP securely? Optional. Default is false.

Verify SSL

checkbox

Should the connector verify LDAP cert? Optional. Default is false.

LDAP Server CA Cert

string

Server CA certificate. Optional.

LDAP Server Name

string

Servername for which the LDAP cert is issued (mandatory if Verify SSL is checked.

LDAP Base DN

string

LDAP base DN, the starting point for directory searches in LDAP

LDAP Filter String

string

LDAP filter prefix string. Filter the search result that match only this condition.

Snapshot Sync Interval (in hours)

number

Specify the time interval in hours to (re)create LDAP snapshot. Optional. Default is 24 hours.

Use Proxy to reach LDAP

checkbox

Should the connector use proxy server to access LDAP server?

Proxy Server to reach LDAP

string

Proxy server to access LDAP

Minimum user permissions needed to configure LDAP on Connectors is a standard domain User.

Figure 49. Initial LDAP configuration
Initial LDAP configuration

Step 3

Discovery in Progress

Once the user clicks Next, this configuration is send to the connector. The connector establishes a connection with LDAP server using the given configuration. It fetches up to 1000 users from LDAP server and identifies all the attributes. Furthermore, it computes a list of all the single-valued attributes are common across all 1000 users. The connector returns this result back to Secure Workload.

Figure 50. Discovery in Progress
Discovery in progress

Step 4

Enhance the Configuration with Discovered Attributes

The user has to pick which attribute corresponds to username and select up to six attributes that the connector has to fetch and snapshot for each user in the organization (i.e., users matching the filter string). This action is performed using a dropdown of list of discovered attributes. Thus, eliminating manual errors and misconfiguration.

Parameter Name

Type

Description

LDAP Username Attribute

string

LDAP attribute that contains the username

LDAP Attributes to Fetch

list of strings

List of LDAP attributes that should be fetched for a user

Figure 51. Discover LDAP Attributes
Discovered LDAP attributes
Figure 52. Identify username attribute and attributes to collect for each username

Step 5

Finalize, Save, and Apply the Configuration

Finally, the configuration is completed by clicking Save and Apply Changes.

Figure 53. Complete LDAP Configuration Discovery and Commit
Identify username attribute and attributes to collect for each username Complete LDAP configuration discovery and commit

The connector receives the completed configuration. It creates a local snapshot of all users matching the filter string and fetches only the selected attributes. Once the snapshot is completed, the connector services can start using the snapshot for annotating users and their LDAP attributes in inventories.

Allowed Secure Workload virtual appliances: None

Allowed connectors: AnyConnect, ISE, and F5.

Note


LDAP configuration has been migrated to Identity Connector.


Remove

You can remove all the configurations that you have added from the connectors and/or appliances using the Delete button available for each configuration.

Connectors for Alert Notifications

Connectors for alert notifications enable Secure Workload to publish Secure Workload alerts on various messaging and logging platforms. These connectors run on TAN service on Secure Workload Edge Appliance.

Connector

Description

Deployed on Virtual Appliance

Syslog

Send Secure Workload alerts to Syslog server.

Secure Workload Edge

Email

Send Secure Workload alerts on Email.

Secure Workload Edge

Slack

Send Secure Workload alerts on Slack.

Secure Workload Edge

Pager Duty

Send Secure Workload alerts on Pager Duty.

Secure Workload Edge

Kinesis

Send Secure Workload alerts on Amazon Kinesis.

Secure Workload Edge

For more information about required virtual appliances, see Connectors for Virtual Appliances.

Email Connector

When you enable Email Connector, TAN service i Secure Workload Edge Appliance sends Email alerts using the configuration for Email Connector.

Figure 54. Email connector
Email connector
Figure 55. Email connector configuration using basic SMTP authentication
Email Connector configuration using Basic SMTP Authentication
Figure 56. Email connector configuration using modern Microsoft authentication
Email Connector configuration using Modern Microsoft Authentication
Figure 57. Sample configuration for an email connector
Sample configuration for Email Connector.
Figure 58. Sample alert from an email connector
Sample alert

Note


  • If secure connection check box is not checked, alerts will be sent over a non-secure connection.

  • Specify the From email adddress and default recipients for alerts.

  • The Default Recipients list is used to send alert notifications. If required, you can override the configurations in Alert configurations.


Limits

Metric

Limit

Maximum number of Email connectors on a Secure Workload Edge appliance

1

Maximum number of Email connectors on a Secure Workload

150

Maximum number of Email connectors on a Tenant (rootscope)

1

Syslog Connector

When enabled, TAN service on Cisco Secure Workload Edge appliance can send alerts to Syslog server using configuration.

Figure 59. Syslog connector
Syslog connector

The following table explains the configuration details for publishing Secure Workload alerts on Syslog server. For more information, see Syslog Notifier Configuration .

Parameter Name

Type

Description

Protocol

drop-down

Protocol to use to connect to server

UDP
TCP

Server Address

string

IP address or hostname of the Syslog server

Port

number

Listening port of Syslog server. Default port value is 514.

Figure 60. Sample configuration for Syslog Connector
Sample configuration for Syslog Connector.
Figure 61. Sample alert
Sample alert

Syslog Severity Mapping

The following table shows the default severity mapping for Secure Workload alerts on Syslog.

Secure Workload Alerts Severity

Syslog Severity

LOW

LOG_DEBUG

MEDIUM

LOG_WARNING

HIGH

LOG_ERR

CRITICAL

LOG_CRIT

IMMEDIATE ACTION

LOG_EMERG

This setting can be modified using Severity Mapping configuration under Syslog Connector. You can choose any corresponding Syslog priority for each Secure Workload Alert Severity and change the Severity Mapping. For more information, see Syslog Severity Mapping Configuration .

Parameter Name

Dropdown of mappings

IMMEDIATE_ACTION

  • Emergency

  • Alert

  • Critical

  • Error

  • Warning

  • Notice

  • Informational

  • Debug

CRITICAL

HIGH

MEDIUM

LOW

Figure 62. Sample config for Syslog Severity Mapping.
Sample config for Syslog Severity Mapping.
Limits

Metric

Limit

Maximum number of Syslog connectors on one Secure Workload Edge appliance

1

Maximum number of Syslog connectors on one Tenant (rootscope)

1

Maximum number of Syslog connectors on Secure Workload

150

Slack Connector

When enabled, TAN service on Secure Workload Edge appliance can send alerts to Slack using configuration.

Figure 63. Slack connector
Slack connector

The following table explains the configuration details for publishing Secure Workload alerts on Slack. For more information, see Slack Notifier Configuration .

Parameter Name

Type

Description

Slack Webhook URL

string

Slack webhook on which Secure Workload alerts should be published


Note


  • To generate slack webhook go here.


Figure 64. Sample configuration for Slack Connector
Sample configuration for Slack Connector.
Figure 65. Sample alert
Sample alert

Limits

Metric

Limit

Maximum number of Slack connectors on one Secure Workload Edge appliance

1

Maximum number of Slack connectors on one Tenant (rootscope)

1

Maximum number of Slack connectors on Secure Workload

150

PagerDuty Connector

When enabled, TAN service on Secure Workload Edge appliance can send alerts to PagerDuty using configuration.

Figure 66. PagerDuty connector
PagerDuty connector

The following table explains the configuration details for publishing Secure Workload alerts on PagerDuty. For more information, see PagerDuty Notifier Configuration .

Parameter Name

Type

Description

PagerDuty Service Key

string

PagerDuty service key for pushing Secure Workload alerts on PagerDuty.

Figure 67. Sample configuration for PagerDuty Connector
Sample configuration for PagerDuty Connector.
Figure 68. Sample alert
Sample alert

Limits

Metric

Limit

Maximum number of PagerDuty connectors on one Secure Workload Edge appliance

1

Maximum number of PagerDuty connectors on one Tenant (rootscope)

1

Maximum number of PagerDuty connectors on Secure Workload

150

Kinesis Connector

When enabled, TAN service on Secure Workload Edge appliance can send alerts using configuration.

Figure 69. Kinesis connector
Kinesis connector

The following table explains the configuration details for publishing Secure Workload alerts on Amazon Kinesis. For more information, see Kinesis Notifier Configuration .

Parameter Name

Type

Description

AWS Access Key ID

string

AWS access key ID to communicate with AWS

AWS Secret Access Key

string

AWS secret access key to communicate with AWS

AWS Region

dropdown of AWS regions

Name of the AWS region where Kinesis stream is configured

Kinesis Stream

string

Name of the Kinesis stream

Stream Partition

string

Partition Name of the stream

Figure 70. Sample configuration for Kinesis Connector.
Sample configuration for Kinesis Connector.

Limits

Metric

Limit

Maximum number of Kinesis connectors on one Secure Workload Edge appliance

1

Maximum number of Kinesis connectors on one Tenant (rootscope)

1

Maximum number of Kinesis connectors on Secure Workload

150

Webex and Discord Alert Connectors

Secure Workload is expanding its alert connector capabilities by integrating with popular messaging platforms—Webex and Discord. Starting release, 3.10, Webex and Discord will enhance its alerting system by providing more context around alerts, making it easier for users to receive and manage notifications in environments they frequently use.

This integration allows Secure Workload to send alerts directly to Webex rooms and Discord channels, and therefore improves the overall responsiveness and effectiveness of alert management within Secure Workload.

Webex Connector

When you enable the Webex connector, Tetration Alert Notifier (TAN) service on Secure Workload virtual appliances is available to send alerts to Webex using configuration.

Figure 71. Enable Webex Configuration
Sample configuration for Slack Connector.

To configure and deploy a virtual appliance, you need to enable Webex integration that requires deploying a special virtual appliance. For more information, see Virtual Appliance for Connectors.

Figure 72. Sample Alert in Webex
Sample alert

Configure Webex Connector

To configure a Webex connector, ensure the following information is available

  • Webex Bot Token

  • Webex Room ID

Figure 73. Webex Connector

Procedure


Step 1

To set up a new Bot on the Webex channel, refer to How to Build your Webex Bot.

Step 2

Enter the details in the New Bot page:

Figure 74. New Bot

Note


To create a new Bot, refer to Step-by-Step Guide for Creating a New Bot.

Step 3

After the Bot is created, you will receive an access token. Ensure that the token is stored in a secure space because this token is used for integration with Cisco Secure Workload.

Figure 75. Bot Access Token

Note


The access token is visible only after the Bot is created, the Access token is not available for use after the Bot creation is complete. You have an option to regenerate the Access token.

Step 4

Navigate to the Webex channel, create a new space to receive the Cisco Secure Workload alerts and add the new Bot to the space.

Figure 76. Create a Webex Space
If it is an existing channel, just add the Bot with other people in the Webex space.

Step 5

For the Webex room, create a Room ID to receive the alerts.

Step 6

Use the API to get the Room ID for the Webex room. You can also run List Rooms for the Room ID.

Figure 77. Sample Response

For more information, refer to List Rooms.


Limitations of Webex Connector

Metric

Limit

Maximum number of Webex instances configured on one Webex connector

20

Maximum number of attributes that can be fetched from a single Webex instance

6

Maximum number of Webex connectors on one Secure Workload Edge appliance

3

Maximum number of Webex connectors on one Tenant (root scope)

10

Maximum number of Webex connectors on Secure Workload

100

Discord Connector

When you enable the Discord connector, Tetration Alert Notifier (TAN) service on Secure Workload virtual appliances is available to send alerts to Discord using configuration.

Figure 78. Discord Connector
Slack connector

To configure and deploy a virtual appliance, you need to enable Discord integration that requires deploying a special virtual appliance. For more information, see Virtual Appliance for Connectors.

Figure 79. Sample Alert in Discord
Sample alert

Configure Discord Connector

To configure a Discord connector, ensure that the following information is available:

  • Discord Bot Token

  • Discord Channel ID

Figure 80. Discord Connector

Procedure


Step 1

To setup a new bot on the Discord channel, refer to To create a discord bot, got to How to Build your Bot.

Step 2

Select New Application, enter the details in the Create an Application page, and click Create.

Figure 81. Create a Discord Bot

Step 3

From the navigation pane, choose Bot and enable the Message Intent Content button.

Step 4

Click on Reset token, which will generate a new access token.

Step 5

After the bot is created, you will receive an access token. Ensure that the token is stored securily because this token is used for integration with Cisco Secure Workload

Figure 82. Reset Token

Step 6

(Optional) Open Discord channel and click Add Server if you want to create a new one.

Step 7

From the navigation pane, navigate to the Application page, choose Installation and copy the install link.

Figure 83. Install Discord

Note


Append `&permissions=2048&integration_type=0&scope=bot` to the end of the install link and continue.

Step 8

From the dropdown, select the required Discord sever and click Continue and Authorize.

The bot has permissions now to send alerts to the Discord server.

Step 9

From the Discord server, choose the channel you want to receive alerts. Right- click on it and select copy channel ID.

Now that you have the configurations needed to create a Discord connector, create a connector with the Discord Bot Token and Discord Channel ID.

Based on the Alert Config, below is a sample alert:

Figure 84. Sample Alert Config

Limitations of Discord Connectors

Metric

Limit

Maximum number of Discord instances configured on one Discord connector

50

Maximum number of attributes that can be fetched from one Discord instance

6

Maximum number of Discord connectors on one Secure Workload Edge appliance

3

Maximum number of Discord connectors on one Tenant (rootscope)

10

Maximum number of Discord connectors on Secure Workload

100

Cloud Connectors

You can use a cloud connector for Secure Workload features on cloud-based workloads.

Cloud connectors do not require a virtual appliance.

Connector

Supported Features

Deployed on Virtual Appliance

AWS

For Amazon Web Services VPCs:

  • Collect metadata (labels)

  • Collect flow logs

  • Enforce segmentation policies

From Elastic Kubernetes Service (EKS) clusters:

  • Collect metadata

N/A

Azure

For Azure VNets:

  • Collect metadata (labels)

  • Collect flow logs

  • Enforce segmentation policies

From Azure Kubernetes Service (AKS) clusters:

  • Collect metadata

N/A

GCP

For Google Cloud Platform VPCs:

  • Collect metadata (labels)

  • Collect flow logs

  • Enforce segmentation policies

From Google Kubernetes Engine (GKE) clusters:

  • Collect metadata (labels)

N/A

AWS Connector

Amazon Web Services (AWS) connector connects with AWS to perform the following high-level functions:

  • Automated ingestion of inventory and its labels from an AWS Virtual Private Cloud (VPC) AWS allows you to assign metadata to your resources in the form of tags. Secure Workload query the tags for these resources which can then be used for inventory and traffic flow data visualization, and policy definition. This capability keeps the resource tag mapping updated by constantly synchronizing this data.

    The tags from workloads and network interfaces of an AWS VPC are ingested. If you configure both workloads and network interfaces, Secure Workload merges and displays the tags. For more information, see Labels generated by cloud connectors.

  • Ingestion of VPC-level flow logs If you have set up VPC flow logs in AWS for monitoring purposes, Secure Workload can ingest flow log information by reading the corresponding S3 bucket. You can use this telemetry for visualization and segmentation policy generation.

  • Segmentation When the segmentation option is enabled, Secure Workload programs security policies using AWS native Security Groups. When enforcement is enabled for a VPC, relevant policies are automatically programmed as security groups.

  • Automated ingestion of metadata from EKS clusters When Elastic Kubernetes Services (EKS) is running on AWS, you can choose to gather all node, service, and pod metadata related to all selected Kubernetes clusters.

You can choose which capabilities to enable for each VPC.

Requirements and Prerequisites for AWS

For all capabilities: Create a dedicated user in AWS, or identify an existing AWS user for this connector. The connector configuration wizard generates a CloudFormation Template (CFT) that you can use to assign required privileges to this user. Make sure you have permissions in AWS to upload this CFT.

For granting cross AWS account access to the dedicated user or a role, see (Optional) Configure Cross-account Access in AWS, including required access privileges.

For granting AWS account access using role, refer to role-based access to Secure Workload cluster.

Each VPC can belong to only one AWS connector. A Secure Workload cluster can have multiple AWS connectors. Gather the information described in the tables in Create a New AWS Connector.

This connector doesn’t require a virtual appliance.

For gathering labels and inventory: No additional prerequisites are required.

For ingesting flow logs: VPC level flow log definitions are required in order to trigger the collection of flow logs.

Only VPC-level flow logs can be ingested.

Flow logs must be published to Amazon Simple Storage Service (S3); Secure Workload cannot collect flow data from Amazon CloudWatch logs.

Secure Workload can ingest flow logs from an S3 bucket associated with any account, if the AWS user account credentials provided during connector creation have access to both the VPC flow logs and the S3 bucket.

The following attributes are required in the flow log: Source Address, Destination Address, Source Port, Destination Port, Protocol, Packets, Bytes, Start Time, End Time, Action, TCP Flags, Interface-ID, Log status, Flow Direction, Packet Source Address, and Packet Destination Address. Any other attributes are ignored.

Flow logs must capture both Allowed and Denied traffic.


Note


The Secure Workload AWS connector supports VPC flow logs partition on an hourly and daily basis.


For segmentation: Enabling segmentation requires Gather Labels to be enabled.

Back up your existing security groups before enabling segmentation in the connector, as all existing rules are overwritten when you enable segmentation for a VPC.

For more information, see Best Practices When Enforcing Segmentation Policy for AWS Inventory.

For managed Kubernetes services (EKS): If you enable the Kubernetes option, see requirements and prerequisites in the Managed Kubernetes Services Running on AWS (EKS) section, including required access privileges.


Note


If you wish to connect to a private EKS, then use Secure Connector to connect to your cluster.


Authentication Using Roles

User-based authentication requires credential keys. If the credential key is not properly managed, it can cause security threat due to their sensitive nature.

Using the role-based authentication you can configure the AWS account using roles. The connector configuration accepts the role id (ARN) and assume that role to perform specific actions on the customer's account.

Role-based authentication reduces the risk of unauthorized access.

To access the Role-based authentication, follow these steps:

Procedure

Step 1

Click the Role tab in the connector configuration page.

Step 2

Register the cluster. If the cluster is not registered, it displays a message "Cluster is not registered to use role credentials". Download the provided payload and contact a customer service representative..

Step 3

From the notification message, click the download button and download the payload file.

Step 4

You can use the link in the notification message to contact the TAC team and raise the ticket and provide the file that you have downloaded.

Step 5

When the cluster is registered, the External Id and User ARN gets auto populated.

Note


Refresh the page to view the External Id and User ARN.

Step 6

Use the generated External Id and User ARN to update the role trust relationship. It enables to assume the role.

The same part of the JSON file:

Step 7

When the previous step is complete, you can copy the Role ARN from the AWS account and paste it in the AWS connector configuration page.


(Optional) Configure Cross-account Access in AWS

Cross-account access in AWS allows users or roles in one account to access resources in another account without directly sharing credentials or account information.

If the provided user credentials or role has access to Virtual Private Clouds (VPCs) in other AWS accounts, those VPCs are available for processing as part of the AWS connector.

Configure Cross-account Access for User-based Authentication
Procedure

Step 1

Ensure that the designated Secure Workload user has the following AWS access permissions:

1. iam:GetPolicyVersion
2. iam:ListPolicyVersions
3. iam:ListAttachedUserPolicies
4. iam:GetUser
Example:
The AWS policy in JSON format is as follows:
{
  "Version": "2012-10-17",
  "Statement": [
    {
      "Sid": "VisualEditor0",
      "Effect": "Allow",
      "Action": [
        "iam:GetPolicyVersion",
        "iam:ListPolicyVersions",
        "iam:ListAttachedUserPolicies",
        "iam:GetUser",
        "servicequotas:ListServiceQuotas"
      ],
      "Resource": "*"
    }
  ]
}

Step 2

Create an AWS IAM role in the desired AWS account where the designated Secure Workload user is not a member.

Step 3

Add the Secure Workload user ARN to the AWS IAM role trust policy which allows the Secure Workload user to assume the AWS IAM role.

Example:
The AWS IAM role trust policy in JSON format is as follows:
{
  "Version": "2012-10-17",
  "Statement": [
      {
        "Effect": "Allow",
        "Principal": {
          "AWS": <secure_workload_user_arn>
            },
  "Action": "sts:AssumeRole",
  "Condition": {} 
    }
  ]
}

Step 4

Perform steps 2 and 3 for all the desired AWS accounts that the Secure Workload user needs access through this cross-account setup but is not a member of.

Step 5

Create a customer managed policy (not an inline policy) with permission to assume all the created AWS roles from different accounts.

Note


In AWS connector, customer inline policy is not supported.

Example:
The customer managed policy in JSON format is as follows:
{
  "Version": "2012-10-17",
  "Statement": [
    {
      "Sid": "VisualEditor0",
      "Effect": "Allow",
      "Action": "sts:AssumeRole",
      "Resource": [<AWS_role_cross_account_1_arn>, <AWS_role_cross_account_2_arn>...]
    }
  ]
}

Step 6

Attach the created customer managed policy to the Secure Workload user.

Step 7

To procure the required permissions to the AWS IAM roles, download the CloudFormation Template (CFT) from the connector configuration wizard and then upload the CFT as-is to the designated Secure Workload user.

Step 8

Edit the CFT and upload the updated version to the CloudFormation portal. For more information on the AWS connector, see Create a New AWS Connector.


Configure Cross-account Access for Role-based Authentication

After completing the steps to authenticate using roles, the Secure Workload auto-generates a user_A and a role_A that is to be assumed, both belonging to the primary account, Account A. The trust relationship of role_A in JSON format is as follows:

{
  "Version": "2012-10-17",
  "Statement": [
    {
      "Effect": "Allow",
      "Principal": {
        "AWS": <user_A_arn>
      },
      "Action": "sts:AssumeRole",
      "Condition": {
        "StringEquals": {
          "sts:ExternalId": <external_id>
        }
      }
    }
  ]
}

To configure cross-account access for role_A, follow these steps:

Procedure

Step 1

Create a new IAM user role, role_B in the secondary account, Account B with a trust relationship that allows role_A to assume role_B. The secondary account is the account you want to access through this cross-account setup.

The trust relationship of role_B in JSON format is as follows:

{
  "Version": "2012-10-17",
  "Statement": [
    {
      "Effect": "Allow",
      "Principal": {
        "AWS": "arn:aws:iam::<account_A_id>:role/<role_A>"
        },
      "Action": "sts:AssumeRole",
      "Condition": {}
    }
  ]
}

Step 2

Create a new IAM custom policy with permissions to assume role_B of Account B to allow a cross-account setup.

The IAM custom policy in JSON format is as follows:

{
  "Version": "2012-10-17",
  "Statement": [
    {
      "Sid": "VisualEditor0",
      "Effect": "Allow",
      "Action": "sts:AssumeRole",
      "Resource": [
        "arn:aws:iam::<account_B_id>:role/<role_B>"
      ]
    }
  ]
}

Step 3

Attach this IAM custom policy to role_A’s permissions to assume role_B and complete the cross-account setup.

Step 4

Repeat these steps with multiple secondary accounts. Update the resource field in the IAM custom policy with a comma-separated list of role ARNs belonging to various secondary accounts (such as Account B, Account C, and Account D) that you want to access through role_A.

The IAM custom policy for multiple secondary accounts in JSON format is as follows:

{
  "Version": "2012-10-17",
  "Statement": [
    {
      "Sid": "VisualEditor0",
      "Effect": "Allow",
      "Action": "sts:AssumeRole",
      "Resource": [
        "arn:aws:iam::<account_B_id>:role/<role_B>",
        "arn:aws:iam::<account_C_id>:role/<role_C>",
        "arn:aws:iam::<account_D_id>:role/<role_D>",
        …
      ]
    }
  ]
}

AWS Connector Configuration Overview

The following graphic gives a high-level overview of the connector configuration process. For essential details, see the next topic (Create a New AWS Connector.)

Figure 85. AWS connector configuration overview
AWS connector configuration overview

(Note that the numbers in the graphic do not correspond to step numbers in the detailed procedure.)

Create a New AWS Connector

Procedure

Step 1

In the navigation pane, choose Manage > Workloads > Connectors.

Step 2

Click AWS Connector.

Step 3

Click Generate Template and choose the desired capabilities.

Based on the capabilities selected, CloudFormation Template (CFT) is generated. Use the generated CFT template in your AWS CloudFormation to create the policy for the User or Role.

To enable segmentation, you must also enable Gather Labels.

Step 4

Download the generated CloudFormation Template (CFT). The generated CFT can be used for both the user and role.

This template has the IAM privileges required for the capabilities that you selected in the previous step.

If you enabled the Kubernetes option, you must separately configure permissions for EKS. See Managed Kubernetes Services Running on AWS (EKS).

Step 5

Upload the CFT to the AWS CloudFormation portal to assign privileges to the user for this connector. Ensure the AWS user have the required privileges before you can continue with the AWS connector configuration.

Note


We recommend this task whether or not you are using AWS cross-account access.

You can apply the CFT using either the portal or the CLI. For more information, see:

When you upload the CFT, AWS requires the following details:

  1. Name of the policy (This can be anything. For example, Secure WorkloadConnector)

  2. Rolename: Name of the AWS IAM role to which you are applying the CFT

  3. List of bucket ARNs And Object ARNs (Default: *)

  4. Username: Name of the AWS user to which you are applying the CFT

  5. List of VPC ARNs (Default: *)

    To enter a specific list of VPC ARNs, enter the security group and network interface resources paired with the specific VPC to enable segmentation.

    1. arn:aws:ec2:<region>:<account_id>:security-group/*

    2. arn:aws:ec2:<region>:<account_id>:network-interface/*

    Sample Code

    Example 1

    {
    			"Action": [
    				"ec2:RevokeSecurityGroupIngress",
    				"ec2:AuthorizeSecurityGroupEgress",
    				"ec2:AuthorizeSecurityGroupIngress",
    				"ec2:CreateSecurityGroup",
    				"ec2:RevokeSecurityGroupEgress",
    				"ec2:DeleteSecurityGroup",
    				"ec2:ModifyNetworkInterfaceAttribute",
    				"ec2:CreateTags"
    			],
    			"Resource": [
    				"arn:aws:ec2:us-east-1:123456789:vpc/vpc-abcdef",
    				"arn:aws:ec2:us-east-1:123456789:security-group/*",
    				"arn:aws:ec2:us-east-1:123456789:network-interface/*"	
    			],
    			"Effect": "Allow"
    		},
    

    Example 2

    {
    			"Action": [
    				"ec2:RevokeSecurityGroupIngress",
    				"ec2:AuthorizeSecurityGroupEgress",
    				"ec2:AuthorizeSecurityGroupIngress",
    				"ec2:CreateSecurityGroup",
    				"ec2:RevokeSecurityGroupEgress",
    				"ec2:DeleteSecurityGroup",
    				"ec2:ModifyNetworkInterfaceAttribute",
    				"ec2:CreateTags"
    			],
    			"Resource": [
    				"arn:aws:ec2:us-east-1:123456789:vpc/vpc-abcdef",
    				"arn:aws:ec2:*:*:security-group/*",
    				"arn:aws:ec2:*:*:network-interface/*"	
    			],
    			"Effect": "Allow"
    		},

Step 6

If you are using AWS role based authentication to connect to the Secure Workload Connector, see EKS Roles and Access privileges section.

Step 7

If you are using AWS cross-account access, follow the additional steps:

  1. You can use the same uploaded CFT to give access to role/user. If you have multiple account use the same CFT on each account.

  2. Upload the CFT to the AWS CloudFormation portal of each AWS account where the desired IAM role exists.

    You can apply the CFT using either the portal or the CLI, as described in the previous step.

    When you upload the CFT, AWS asks for the following:

    1. Name of the policy (This can be anything. For example, Secure WorkloadConnector)

    2. List of bucket ARNs And Object ARNs (Default: *)

    3. Rolename: Name of the AWS IAM role to which you are applying the CFT

    4. List of VPC ARNs (Default: *)

Step 8

Click Getting started guide (recommended) or Configure your new connector here button to configure the connector.

Step 9

Understand and meet the Requirements and Prerequisites for AWS,, EKS Roles and Access Privileges and Segmentation policy enforcement, then click Get Started. Or if you are configuring using the Configure your new connector button, then click yes.

Step 10

Name the connector and enter the description.

Step 11

Configure settings:

You can use either of the one option to connect to AWS account.

  1. Credential Keys

  2. Roles

Parameter Name

Attribute

Description

Credential Keys

Access Key

ACCESS KEY ID associated with the AWS user that has the privileges described in the CFT above.

Secret Key

SECRET KEY associated with the ACCESS KEY ID above.

Roles

External Id

It is auto generated unique identifier for granting access to AWS resources. It is used by the user to add trust relationship to the role.

User ARN

It is auto generated unique identifier assigned to an IAM. It is used by the user to add trust relationship to the role.

ARN

A unique identifier assigned to each AWS resource.

HTTP Proxy

(Optional) Proxy required for Secure Workload to reach AWS.

Full Scan Interval

Frequency with which Secure Workload refreshes complete inventory data from AWS. Default and minimum is 3600 seconds.

Delta Scan Interval

Frequency with which Secure Workload fetches incremental changes in inventory data from AWS. Default and minimum is 600 seconds.

Step 12

Click Next.

Step 13

The next page displays a Resource Tree where the user can expands to view various region and inside the region you can select or unselect the resource check boxes to obtain the list of VPCs and EKS clusters from AWS.

Step 14

From the list of VPCs (Virtual Networks), choose the VPCs for which you want to enable your selected capabilities.

Generally, you should enable flow ingestion as soon as possible, so that Secure Workload can begin to collect enough data required to suggest accurate policies.

Note that since EKS only supports Gather Labels capability, no explicit capability selection has been provided. Selecting an EKS cluster will implicitly enable the supported capability. For each cluster for which you enable this capability, enter the Assume Role ARN (The Amazon resource number of the role to assume while connecting to Secure Workload.)

Enable Segmentation on VPCs will remove existing Security Group(s) and provides default access to all VPCs.

Generally, you should not choose Enable Segmentation during initial configuration. Later, when you are ready to enforce segmentation policy for specific VPCs, you can edit the connector and enable segmentation for those VPCs. See the Best Practices When Enforcing Segmentation Policy for AWS Inventory.

Step 15

For the EKS cluster, you can allow AWS IAM role access by providing the Assume Role ARN access id to connect to the AWS connector.

Step 16

Once your selections are complete, click Create and wait a few minutes for the validation check to complete.


What to do next

If you have enabled gathering labels, ingesting flow data, and/or segmentation:

  • If you enable flow ingestion, it may take up to 25 minutes for flows to begin appearing on the Investigate > Traffic page.

  • (Optional) For richer flow data and other benefits including visibility into host vulnerabilities (CVEs), install the appropriate agent for your operating system on your VPC-based workloads. For requirements and details, see the agent installation chapter.

  • After you have successfully configured the AWS connector to gather labels and ingest flows, follow the standard process for building segmentation policies. For example: Allow Secure Workload to gather sufficient flow data to generate reliable policies; define or modify scopes (typically one for each VPC); create a workspace for each scope; automatically discover policies based on your flow data, and/or manually create policies; analyze and refine your policies; ensure that your policies meet the guidelines and best practices below; and then, when you are ready, approve and enforce those policies in the workspace. When you are ready to enforce segmentation policy for a particular VPC, return to the connector configuration to enable segmentation for the VPC. For details, see Best Practices When Enforcing Segmentation Policy for AWS Inventory.

If you have enabled the Kubernetes managed services (EKS) option:

  • Install Kubernetes agents on your container-based workloads. For details, see the Kubernetes/Openshift Agents - Deep Visibility and Enforcement section in the agent deployment chapter.

Event Log:

The event logs can be used to know significant events happening per connector from different capabilities. We can filter them using various attributes like Component, Namespace, Messages and Timestamp.

Edit a New AWS Connector

You can edit an AWS connector, for example to enable segmentation enforcement for specific Virtual Private Cloud (VPCs) or to make any other changes.


Note


Changes are not saved until you complete all the steps in the wizard.


Procedure

Step 1

From the navigation pane, choose Manage > Workloads > Connectors.

Step 2

Click AWS.

Step 3

If you have more than one AWS connector, choose the connector to edit from the top of the window.

Step 4

Click Edit Connector.

Step 5

Click through the wizard again and make changes. For detailed descriptions of the settings, see Create a New AWS Connector.

Step 6

If you enable different capabilities (gathering labels, ingesting flows, enforcing segmentation, or gathering EKS data), you must download the revised CloudFormation Template (CFT) and upload it to AWS before continuing the wizard.

Step 7

To enable enforcement of segmentation policy, first make sure you have completed recommended prerequisites described in Best Practices When Enforcing Segmentation Policy for AWS Inventory. On the page that lists the VPCs, choose Enable Segmentation for the VPCs on which you want to enable enforcement.

Step 8

If you have already created scopes for any of the selected VPCs, either using the wizard or manually, click Skip this step to complete the wizard.

You can edit the scope tree manually using the Organize > Scopes and Inventory page.

Step 9

If you have not already created any scopes for the selected VPCs and you want to keep the proposed hierarchy, choose the parent scope from above the scope tree, then click Save.


Deleting Connectors and Data

If you delete a connector, data already ingested by that connector is not deleted.

Labels and inventory are automatically deleted from active inventory after 24 hours.

Best Practices When Enforcing Segmentation Policy for AWS Inventory


Warning


Before you enable segmentation enforcement on any VPC, create a backup of the security groups on that VPC. Enabling segmentation for a VPC removes existing Security Groups from that VPC. Disabling segmentation does not restore the old security groups.


When creating policies:

  • As with all discovered policies, ensure that you have enough flow data to produce accurate policies.

  • Because AWS allows only ALLOW rules in security groups, your segmentation policies should include only Allow policies, except the Catch-All policy, which should have the Deny action.

We recommend that you enable enforcement in the workspace before you enable segmentation for the associated VPC. If you enable segmentation for a VPC that is not included in a workspace that has enforcement enabled, all traffic will be allowed on that VPC.

When you are ready to enforce policy for a VPC, edit the AWS connector (see Edit an AWS Connector) and enable segmentation for that VPC.

View AWS Inventory Labels, Details, and Enforcement Status

To view summary information for an AWS connector, from the navigation pane, choose Manage > Workloads > Connectors, and then choose the connector from the top of the page. For more information, click a VPC row.

To view information about AWS VPC inventory, click an IP address on the AWS Connectors page to see the Inventory Profile page for that workload. For more information about inventory profiles, see Inventory Profile.

For information about labels, see:

Concrete policies for VPC inventory are generated based on their orchestrator_system/interface_id label value. You can see this on the Inventory Profile page.

To view enforcement status, choose Defend > Enforcement Status from the navigation bar on the left side of the Secure Workload window. For more information, see Enforcement Status for Cloud Connectors.

Troubleshoot AWS Connector Issues

Problem: The Enforcement Status page shows that a Concrete Policy was SKIPPED.

Solution: This occurs when the number of security groups exceeds the AWS limits, as configured in the AWS connector.

When a concrete policy shows as SKIPPED, the new security groups are not implemented and the previously existing security groups on AWS remain in effect.

To resolve this issue, see if you can consolidate policies, for example by using a larger subnet in one policy rather than multiple policies with smaller subnets.

If you choose to increase limits on the number of rules, you must contact Amazon before changing the limits in the AWS connector configuration.

Background:

Concrete policies are generated for each VPC when segmentation is enabled. These concrete policies are used to create security groups in AWS. However, AWS and Secure Workload count policies differently. When converting Secure Workload policies to AWS security groups, AWS counts each unique subnet as one rule.

Accounting example:

Consider the following example Secure Workload policy:

OUTBOUND: Consumer Address Set -> Provider Address Set Allow TCP port 80, 8080

AWS counts this policy as (the number of unique subnets in the Provider Address set) multiplied by (the number of unique ports).

So, if the provider address set consists of 20 Unique subnets, then this single Secure Workload policy counts in AWS as 20(unique subnets) * 2(Unique ports) = 40 rules in security groups.

Keep in mind that because the VPCs are dynamic, the rule count is also dynamic, so the counts are approximate.

Problem: AWS unexpectedly allows all traffic

Solution: Make sure your Catch-All policy in Secure Workload is set to Deny.

Managed Kubernetes Services Running on AWS (EKS)

If you have deployed Amazon Elastic Kubernetes Service (EKS) on your AWS cloud, then you can use an AWS connector to pull in inventory and labels (EKS tags) from your Kubernetes cluster.

When an AWS connector is configured to pull metadata from managed Kubernetes services, Secure Workload connects to the cluster’s API server and tracks the status of nodes, pods and services in that cluster. For the Kubernetes labels gathered and generated using this connector, see Labels Related to Kubernetes Clusters.

Requirements and Prerequisites for EKS
  • Verify that your Kubernetes version is supported. See https://www.cisco.com/go/secure-workload/requirements/integrations.

  • Configure the required access in EKS. For more information, see EKS Roles and Access Privileges.

  • Amazon EKS clusters can be configured with different authentication modes CONFIG_MAP or API_AND_CONFIG_MAP. Secure Workload authenticates using standard IAM-based tokens; however, you must authorize the IAM principal (user or role) used by the AWS connector according to the cluster’s mode.

  • If the cluster uses API-only mode, you must create an EKS Access Entry for the AWS user or role used to onboard the cluster. If the cluster uses CONFIG_MAP or API_AND_CONFIG_MAP, the aws-auth ConfigMap method described below continues to apply.


    Note


    AWS recommends using the API-only authentication mode, which uses EKS Access Entries instead of the aws-auth ConfigMap.


EKS Roles and Access Privileges
User credentials and AssumeRole (if applicable) must be configured with a minimum set of privileges. The user/role must be specified in the aws-auth.yaml config map. The aws-auth.yaml config map can be edited using the following command.
$ kubectl edit configmap -n kube-system aws-auth

If your EKS cluster uses API-only authentication mode, you must grant access to the AWS user or role used for onboarding (the IAM principal configured in the connector) by creating an EKS Access Entry and associating an access policy. The aws-auth ConfigMap mapping applies only to CONFIG_MAP and API_AND_CONFIG_MAP modes.

If AssumeRole is not used, the user must be added to the “mapUsers” section of the aws-auth.yaml config map with appropriate group. If AssumeRole ARN is specified, the role must be added to the “mapRoles” section of the aws-auth.yaml config map. A sample aws-auth.yaml config map with AssumeRole is provided below.

    apiVersion: v1
    data:
      mapAccounts: |
        []
      mapRoles: |
        - "groups":
          - "system:bootstrappers"
          - "system:nodes"
          "rolearn": "arn:aws:iam::938996165657:role/eks-cluster-2021011418144523470000000a"
          "username": "system:node:{{EC2PrivateDNSName}}"
        - "rolearn": arn:aws:iam::938996165657:role/BasicPrivilegesRole
          "username": secure.workload.read.only-user
          "groups":
            - secure.workload.read.only

      mapUsers: |
        []
    kind: ConfigMap
    metadata:
      creationTimestamp: "2021-01-14T18:14:47Z"
      managedFields:
      - apiVersion: v1
        fieldsType: FieldsV1
        fieldsV1:
          f:data:
            .: {}
            f:mapAccounts: {}
            f:mapRoles: {}
            f:mapUsers: {}
        manager: HashiCorp
        operation: Update
        time: "2021-01-14T18:14:47Z"
      name: aws-auth
      namespace: kube-system
      resourceVersion: "829"
      selfLink: /api/v1/namespaces/kube-system/configmaps/aws-auth
      uid: 6c5a3ac7-58c7-4c57-a9c9-cad701110569
EKS specific RBAC considerations

Create a cluster role binding of the cluster role and the user/service account.

apiVersion: rbac.authorization.k8s.io/v1
kind: ClusterRoleBinding
metadata:
  name: csw-clusterrolebinging 
subjects:
- kind: User
  name: csw.read.only
  apiGroup: rbac.authorization.k8s.io
roleRef:
  kind: ClusterRole
  name: csw.read.only
  apiGroup: rbac.authorization.k8s.io
  kubectl create -f clusterrolebinding.yaml 
clusterrolebinding.rbac.authorization.k8s.io/csw-clusterrolebinging created

For information on EKS roles and access, see the EKS Roles and Access Privileges section.

Configure EKS Settings in the AWS Connector Wizard

You enable the Managed Kubernetes Services capability when you configure the AWS connector. See Create a New AWS Connector.

You will need the Assume Role ARN for each EKS cluster. For more information, see: https://docs.aws.amazon.com/STS/latest/APIReference/API_AssumeRole.html

If you are using the AWS user to access the EKS cluster, allow the user to access the Assume Role.

If you are using a cross-account IAM role, allow the IAM role to access the Assume Role.

Support for EKS Load Balancer

We add support for load balancer services in EKS. The CSW agents enforce rules on consumer hosts and provider hosts/pods.

An EKS Load Balancer has two options:

  1. Preserve Client IP.

  2. On provider pod, we generate

  3. Target Type.

Before starting with cases, for the following policy intent:

Consumer to provider service, service protocol and port with allow action rules for various cases are generated as follows:

Case

Preserve Client

Target Type

1

On

IP

2

On

Instance

3

Off

IP

4

Off

Instance

Case 1:

On consumer node we generate an egress rule with consumer to load balancer service (lb ingress ip) service protocol and port allow.

There are no host rules on the provider node, but we generate an Ingress rule on the provider pod with source as the consumer, the destination as provider pod (any), the protocol as the target protocol, the port as the target port, and the action as allow.

Case 2:

On consumer node we generate an egress rule with consumer to load balancer service (lb ingress ip) service protocol and port allow.

On provider node there is a prerouting rule generated with source as consumer and destination as all provider nodes, protocol as service protocol, port as node port of the service and an action as allow.

On provider pod, we generate an Ingress rule with source as provider nodes, destination as provider pod (any), protocol as target protocol, port as target port and action as allow.

Case 3:

On consumer node we generate an egress rule with consumer to load balancer service (lb ingress ip) service protocol and port allow.

There are no host rules on the provider node. On provider pod, we generate an Ingress rule with source as lb ingress ip's destination as provider pod (any), protocol as target protocol, port as target port and action as allow.

Case 4:

On consumer node we generate an egress rule with consumer to load balancer service(lb ingress ip) service protocol and port allow.

The provider node generates a prerouting rule that sets the lb ingress IPs as the source and all provider nodes as the destination. The rule specifies the service protocol as the protocol and the node port of the service as the port, with the action set to allow.

On provider pod, we generate an Ingress rule with source as provider nodes, destination as provider pod (any), protocol as target protocol, port as target port and action as allow.

Support for non-local AKS clusters

This feature enables discovery and management of Azure Kubernetes Service (AKS) clusters with local accounts disabled.

When this security setting is enabled in Azure, Kubernetes admin credentials are not available. Previously, these clusters could not be discovered or managed. Now, the system automatically detects this setting and uses the appropriate authentication method.

Key Features
  • No configuration required: No manual configuration, toggle, or additional setup is needed. The system detects the local account status during discovery and applies the correct authentication method automatically.

  • Azure RBAC permissions:

    For clusters with local accounts disabled, authentication uses Azure AD Bearer tokens. The connector’s Azure service principal or managed identity must have sufficient RBAC permissions like Azure Kubernetes Service Cluster Admin Role on the AKS cluster. The IAM policy template now includes the listClusterUserCredential permission for non-local clusters.

  • TLS verification for non-local clusters: Authentication uses Azure AD Bearer tokens, and the connection to the API server uses TLS with the cluster CA certificate (extracted from user credentials) for server certificate verification. Client certificate-based mTLS is not used because admin credentials are unavailable.

  • Backward compatible: Existing clusters with local accounts enabled continue to work exactly as before, using mTLS. No action is needed for these current deployments.

Setup

To support AKS clusters with local accounts disabled, complete the following setup.

  1. Update the Azure IAM policy.

    Secure Workload managed Azure IAM policy now includes the following permission: Microsoft.ContainerService/managedClusters/listClusterUserCredential/action

  2. Assign Azure RBAC permissions on the AKS cluster.

    You must assign an Azure AD Kubernetes RBAC role on the AKS cluster to the service principal or managed identity.
    az role assignment create \
      --role "Azure Kubernetes Service RBAC Cluster Admin" \
      --assignee <tetration-sp-object-id> \
      --scope "/subscriptions/<sub-id>/resourceGroups/<rg>/providers/Microsoft.ContainerService/managedClusters/<cluster-name>"

Note


To assign the role from the Azure Portal UI, see Microsoft’s guide about Use Azure RBAC for Kubernetes Authorization.


Back up and Restore Security Groups Using AWS Connector

The AWS connector now includes the capability to back up and restore your security groups (SGs).

The following are the key functionalities:

  • Automatic Backup of Security Groups: When the segmentation option is enabled for a Virtual Private Network (VPC) in AWS, all the associated SGs are automatically backed up. This backup captures the SGs in their current state before any segmentation-related changes are applied.

  • Automatic Restore of Security Groups: When the segmentation option is disabled, the previously backed-up firewall rules are restored to their original state, that is, the state they were in when the segmentation was first enabled. Note that only SGs modified by Secure Workload are restored, ensuring that other unrelated configurations remain unaffected.


Note


When a backup is collected for the first time with segmentation enabled, and subsequent updates include changes to VPCs, a new backup will be created to capture the latest information. At any given time, only one backup state exists for each VPC. Restores will always use the most recent backup state, not the initial backup collected.


Back up Security Groups Using AWS Connector

In order to back up Security Groups (SGs), you must enable segmentation.

To enable segmentation and back up SGs, perform the following steps.

Procedure

Step 1

From the navigation pane, choose Manage > Workloads > Connectors.

Step 2

Click AWS Connector and select Resources > Resources Tree.

Step 3

Select the Virtual Private Cloud (VPC) for which you want to enable segmentation, and click the Segementation radio button next to it.

The system automatically creates a backup of all the associated SGs. The backup process runs in the background and does not require any manual action.

After segmentation is enabled, Secure Workload updates your SGs to enforce segmentation policies. These updates are implemented to enhance the security and segmentation of your AWS environment while ensuring compliance with your organization's security standards.


Restore Security Groups Using AWS Connector

In order to restore Security Groups (SGs), you must disable segmentation. For more information, see Back up Security Groups Using AWS Connector.


Note


The restore action is applicable only to the Virtual Private Cloud (VPCs) where segmentation was enabled and then disabled. Restoration of a backup is not possible if segmentation was never enabled.


To disable segmentation and restore SGs, perform the following steps:

Procedure

Step 1

From the navigation pane, choose Manage > Workloads > Connectors.

Step 2

Click AWS Connector and select Resources > Resources Tree.

Step 3

Select the VPC for which you want to disable segmentation, and deselect the Segementation radio button next to it.

The system automatically reverts all the SGs that were modified by Secure Workload to their original state, which is the state they were in when segmentation was initially enabled.


Azure Connector

The Azure connector connects with your Microsoft Azure account to perform these functions:


Note


Note that the Azure connector supports multiple subscriptions. Choose the capabilities you wish to enable for each VNet.


  • Automated ingestion

    • Automated ingestion of inventory: Azure allows automated ingestion of inventory and its tags from Azure virtual networks (VNets) in real-time. Meta data is assigned to resources in the form of tags. Secure Workload can ingest the tags associated with virtual machines and network interfaces, which can then be used as labels in Secure Workload for inventory and traffic flow data visualization and policy definitions. This metadata is synchronized constantly.

      The tags from workloads and network interfaces of the subscription associated with the connector are ingested. If both workloads and network interfaces are configured, the tags are merged and displayed in Secure Workload. For more information, see Labels generated by cloud connectors.

    • Automated ingestion of Azure asset types: Azure allows automated ingestion of several asset types: Load Balancers (Standard and Application Gateways), Private Link Services, Private Endpoints, Azure SQL Servers, and Azure Function Applications. The Azure connector automatically discovers and imports key Azure networking and PaaS access constructs, not just virtual machines.

      It ingests Standard Load Balancers and Application Gateways, modeling their frontend IPs and rules as services and their backend pools as machines with port and health‑probe metadata. It also ingests Private Link Services and maps their private IPs and relationships to load balancers or gateways into tags. Private Endpoints are also ingested as assets, each with a private IP. The underlying Azure resource, such as a storage account, is identified as a label for both type and name. As a result, service entry points, traffic paths, and PaaS resources appear as services or workloads, and label objects in Secure Workload.

    • Automated ingestion of metadata from AKS clusters: When Azure Kubernetes Services are running on Azure, you can choose to gather all the node, service, and pod metadata related to all the selected Kubernetes clusters.

  • Ingestion of flow logs: The connector can ingest flow logs that you set up in Azure using VNET flow logs. You can then use the telemetry data in Secure Workload to generate visualization and segmentation policy.

  • Segmentation: When enforcement of the segmentation policy is enabled for a virtual network, Secure Workload policies are enforced using Azure's native Network Security Groups.

Requirements and Prerequisites for Azure

For all capabilities: A single connector can handle multiple subscriptions. You must have a subscription ID to configure a connector. This subscription ID can be one of the many subscription IDs that are being onboarded to a connector.

In Azure, create or register an application using Azure Active Directory (AD). You need the following information from this application:

  • Application (client) ID

  • Directory (tenant) ID

  • Client credentials (you can use either a certificate or a client secret)

  • Subscription ID

The Connector Configuration wizard generates an Azure Resource Manager (ARM) template.

  • Use the ARM template to create a custom role with the permissions required for the connector capabilities you choose to enable.

  • Apply these permissions to all the resources in the subscription for the connector.

  • Ensure that you have the necessary permissions in Azure to upload this template.

Connectivity requirements:

  • If required, ensure that an HTTP proxy is available.

Virtual Network (VNet) considerations:

  • Each VNet can belong to only one Azure connector.

  • An Azure account can have multiple Azure connectors.

  • An Azure connector does not require a virtual appliance.

Special requirements:

  • No additional prerequisites are required to gather labels and inventory.

  • A VNet must have flow logs configured and enabled to ingest flow logs.


Note


  • Azure VNet flow logs do not support the export of ICMP flow data; these only capture and log TCP and UDP flow data.

  • Azure VNet flow logs do not capture TCP flag information.


  • In Azure, enable storage account key access for successful integration. The storage account must be accessible from the Secure Workload cluster to pull the logs from the storage account containers. When disabled, the system fails to connect and displays an error message.

  • The flow logs must use Version 2.

  • Retention time can be two days (the connector pulls new flow data every minute, and two days should be enough to set right connection failures, if any).

For segmentation: Enabling segmentation requires Gather Labels to be enabled.

When you enable segmentation for a virtual network (VNet), all the existing rules are removed from the NSGs associated with subnets and the network interfaces that are a part of those subnets. Back up your existing NSG rules in the subnet and network interface before you enable segmentation in the connector.

See also Best Practices When Enforcing Segmentation Policy for Azure Inventory.

For managed Kubernetes services (AKS): If you want to enable the Kubernetes AKS option, see the requirements and prerequisites in the Managed Kubernetes Services running on Azure (AKS) section, .

Limitations

  • Only resources associated with the configured Virtual Network are discovered. Resources in other VNets within the same subscription are not included.

  • Azure Function Apps are identified by their Kind property. Only apps with functionapp in their kind are included. Regular Azure Web Apps are excluded.

Azure Asset Types and Visibility

The Azure connector provides visibility into a broader set of Azure asset types beyond virtual machines and Kubernetes clusters. When enabled, the connector ingests configuration and metadata for these assets and represents them as services, machines, and labels in Secure Workload.

  • Standard Load Balancers distribute TCP and UDP traffic across a pool of backend resources.

    • Load balancing rules are ingested as service objects in Secure Workload (Service_Details), including the virtual IP (VIP) and frontend port.

    • Backend pool IP addresses are ingested as Machine_Details, allowing you to see which workloads are serving traffic behind a given service.

    • Backend ports and health check (probe) ports are captured as tags on the corresponding services, so you can use them for inventory, flow analysis, and policy definitions.

  • Application Gateways provide application‑layer (HTTP/HTTPS) load balancing and advanced routing for web applications.

    • Application Gateway listeners, rules, and backend pools are ingested in a manner similar to Standard Load Balancers.

    • Each rule is converted into a service with associated frontend and backend information. This includes the listener IP/port and the backend pool members.

  • Private Link Services provide private access to services over a private IP within a consumer virtual network.

    • The Private Link IP address is ingested as Machine_Details so that the private entry point to the service appears in inventory.

    • Links from Private Link Services to private endpoints are captured as tags, along with the frontend IP configuration of the associated load balancer or application gateway.

  • Private Endpoint Services are network interfaces with private IP addresses that connect to Private Link Services or Microsoft‑managed PaaS services. These labels let you identify which Azure resource a private endpoint connects to. You can then use that information in label‑based policies.

    For example:
    privateLinkServiceId": "/subscriptions/<>/resourceGroups<>/providers/Microsoft.Storage/storageAccounts/bucket_name

    Gets converted to following labels:

  • orchestrator_system/azure_resource_type: "Microsoft.Storage/storageAccounts”
  • orchestrator_system/azure_resource_name: "bucket_name”

By combining these asset types with labels and flow telemetry, the Azure connector provides a comprehensive view of how services are exposed, how traffic flows through load balancers and gateways, and how workloads and PaaS resources are connected within your Azure environment.

Azure Connector Configuration

The following graphic gives a high-level overview of the connector configuration process. For more information, see Create an Azure Connector section.

Figure 86. Azure Connector Configuration Overview
Azure connector configuration overview

Note


Note that the numbers in the graphic do not correspond to step numbers in the detailed procedure.


Create an Azure Connector

Procedure

Step 1

From the navigation pane, choose Manage > Workloads > Connectors.

Step 2

Click Azure Connector.

Step 3

Click Configure your New Connector.

Generate a Azure Resource Manager template with the roles and policies required for the capabilities you wish to enable, and then upload the template to Azure.

Note that without this step, you will not be able to create an Azure Connector Configuration.

Step 4

Configuration Settings:

Attribute

Description

Connector Name

The name of the connector associating with the Azure connector.

Description

Short description of the connector.

ClientID

The Application (client) ID from the application that you created in Azure for this connector.

ClientID

The Application (client) ID from the application that you created in Azure for this connector.

TenantID

The Directory (tenant) ID from the application that you created in Azure for this connector.

Client Secret or Client Certificate

For authentication, you can use either a client secret or a client certificate and key. Obtain either from the Client credentials link in the application that you created in Azure for this connector. If you use a certificate: The certificate should be unencrypted. Only RSA certificates are supported. Private keys can be either PKCS1 or PKCS8.

HTTP Proxy

Proxy required for Secure Workload to reach Azure. Supported proxy ports: 80, 8080, 443, and 3128.

Full Scan Interval

Frequency with which Secure Workload refreshes complete inventory data from Azure. Default and minimum is 3600 seconds.

Delta Scan Interval

Frequency with which Secure Workload fetches incremental changes in inventory data from Azure. Default and minimum is 600 seconds.

Step 5

Click either of the below options to create a new Azure connector:

  • Get Started Guide

    OR
  • Generate Templates

Step 6

Get Started Guide: Use this option to gather labels and flow data from Azure to enforce segmentation policy using cloud-native constructs, and or to gather labels from EKS clusters.

Before you configure this connector, see:

  • Requirements and Prerequisites: Understand the general requirements and prerequisites for the Azure cloud connector and the specific requirements for each capability.

  • This wizard creates an Azure Resource Manager (ARM) template with the permissions required for the capabilities you enable. You can upload this template to a custom role in Azure to assign the necessary permissions.

  • Segmentation and policy enforcement: Before you enable policy enforcement for any VPC, read about important caveats and take action to avoid unintended results.

Step 7

Click Get Started and under Settings, configure the new connector. For more information, see Edit a New Azure Connector section.

Step 8

Click Generate Templates.

Cisco Secure Workload requires relevant permissions to access and read flow logs settings and perform policy enforcement. Choose the desired capabilities and based on the capabilities selected, CloudFormation Template (CFT) is generated.

Use the generated CFT template in your Azure CloudFormation to create the policy for the User or Role. Select activities to be performed with Cisco Secure Workload on your Azure Resources.

  • Context Gathering

  • Ingest Flow Logs

  • Segmentation

  • Managed Kubernetes Services

  • PaaS/FaaS Asset Ingestion for Load Balancers, Application Gateways, Private Links, and Private Endpoints.

Note


The above selections will determine the RBAC recommendations. The ARM template generated will include the necessary RBAC permissions for the asset types you select to ingest.

Step 9

Click Next and read the information on the configuration page.

Step 10

Configure settings:

Attribute

Description

SubscriptionID

The ID of the Azure subscription that you are associating with this connector.

ClientID

The Application (client) ID from the application that you created in Azure for this connector.

TenantID

The Directory (tenant) ID from the application that you created in Azure for this connector.

Client Secret or Client Certificate

For authentication, you can use either a client secret or a client certificate and key. Obtain either from the Client credentials link in the application that you created in Azure for this connector. If you use a certificate: The certificate should be unencrypted. Only RSA certificates are supported. Private keys can be either PKCS1 or PKCS8.

HTTP Proxy

Proxy required for Secure Workload to reach Azure. Supported proxy ports: 80, 8080, 443, and 3128.

Full Scan Interval

Frequency with which Secure Workload refreshes complete inventory data from Azure. Default and minimum is 3600 seconds.

Delta Scan Interval

Frequency with which Secure Workload fetches incremental changes in inventory data from Azure. Default and minimum is 600 seconds.

Step 11

Your subscription must have the required privileges before you can continue to the next page in the wizard.

To use the provided Azure Resource Manager (ARM) template to assign required permissions for the connector:

  1. Download the ARM template from the wizard.

  2. Edit the template text to replace Subscription_ID with your subscription ID.

    Note


    For a connector, you can create multiple subscription IDs in the Azure account.

    You can enter multiple subscription IDs where the credentials belong to the same subscription ID.

  3. In Azure, create a custom role in the applicable subscription.

  4. In the custom role form, for the Baseline permissions, choose Start from scratch.

  5. In the JSON tab of the custom role creation form, paste the text from the edited file you downloaded from the connector wizard.

  6. Save the custom role.

  7. Attach the custom role to the application you configured in the prerequisites for this procedure.

This template has the IAM permissions required for the capabilities that you selected in the previous step.

If you enabled the Kubernetes managed services option, you must separately configure permissions for AKS. For more information, see Managed Kubernetes Services Running on Azure (AKS).

Step 12

Click Next.

Step 13

The next page displays a Resource Tree where the user can expands to view various region and inside the region you can select or unselect the resource check boxes to obtain the list of VNets and AKS clusters from Azure.

Step 14

From the list of VNets and AKS clusters for each VNet, choose the VNets and AKS clusters for which you want to enable your selected capabilities.

Generally, you should enable flow ingestion as soon as possible, so that Secure Workload can begin to collect enough data to suggest accurate policies.

Note that since AKS only supports Gather Labels capability, no explicit capability selection has been provided. Selecting an AKS cluster will implicitly enable the supported capability. Upload the client certificate and key for each cluster for which you enable this functionality.

Generally, you should not choose Enable Segmentation during initial configuration. Later, when you are ready to enforce segmentation policy for specific VNets, you can edit the connector and enable segmentation for those VNets. For more information, see Best Practices When Enforcing Segmentation Policy for Azure Inventory.

Step 15

Once your selections are complete, click Create and wait a few minutes for the validation check to complete.

The View Groups page shows all VNets that you enabled for any functionality on the previous page, grouped by region. Each region, and each VNet in each region, is a new scope.

Step 16

(Optional) Choose the parent scope under which to add the new set of scopes. If you have not yet defined any scopes, your only option is the default scope.

Step 17

(Optional) To accept all settings configured in the wizard, including the hierarchical scope tree, click Save.

To accept all settings, except the hierarchical scope tree, click Skip this step.

You can manually create or edit the scope tree later, under Organize > Scopes and Inventory.


What to do next

If you have enabled gathering labels, ingesting flows data, and or segmentation:

  • If you have enabled PaaS/FaaS asset ingestion (Load Balancers, Private Links, Private Endpoints), allow 5-10 minutes for initial asset discovery and ingestion. Navigate to Manage > Workloads > Inventory to view discovered assets and their auto-generated labels.

  • Use asset labels in segmentation policies for enhanced visibility and control.

  • If you enabled flow ingestion, it may take up to 25 minutes for flows to begin appearing on the Investigate > Traffic page.

  • (Optional) For richer flow data and other benefits including visibility into host vulnerabilities (CVEs), install the appropriate agent for your operating system on your VNet-based workloads. For requirements and details, see the agent installation chapter.

  • After you have successfully configured the Azure connector to gather labels and ingest flows, follow the standard process for building segmentation policies. For example: Allow Secure Workload to gather sufficient flow data to generate reliable policies; define or modify scopes (typically one for each VNet); create a workspace for each scope; automatically discover policies based on your flow data, and/or manually create policies; analyze and refine your policies; ensure that your policies meet the guidelines and best practices below; and then, when you are ready, approve and enforce those policies in the workspace. When you are ready to enforce segmentation policy for a particular VNet, return to the connector configuration to enable segmentation for the VNet. For details, see Best Practices When Enforcing Segmentation Policy for Azure Inventory.

If you have enabled the Kubernetes managed services (AKS) option:

Install Kubernetes agents on your container-based workloads. For details, see Install Kubernetes or OpenShift Agents for Deep Visibility and Enforcement.

Event Log:

The event logs can be used to know significant events happening per connector from different capabilities. We can filter them using various attributes like Component, Namespace, Messages and Timestamp.

Figure 87. Event Log

Edit an Azure Connector

You can edit an Azure connector, for example, to enable segmentation enforcement for specific VNets or to make other changes.

Changes are not saved until you finish the wizard.

Procedure

Step 1

From the navigation pane, choose Manage > Workloads > Connectors.

Step 2

Click Azure Connector.

Step 3

If you have more than one Azure connector, choose the connector to edit from the top of the window.

Step 4

Click Edit Connector.

Step 5

Click through the wizard again and make changes. For detailed descriptions of the settings, see the Create a new Azure Connector section.

Step 6

If you enable different capabilities (gathering labels, ingesting flows, enforcing segmentation, or gathering AKS data), you must download the revised ARM template, edit the new template text to specify the subscription ID, and upload the new template to the custom role you created in Azure before continuing the wizard.

Step 7

To enable enforcement of segmentation policy, first make sure you have completed recommended prerequisites described in Best Practices When Enforcing Segmentation Policy for Azure Inventory. Then, on the wizard page that lists the VNets, choose Enable Segmentation for the VNets on which you want to enable enforcement.

Step 8

If you have already created scopes for any of the selected VNets, either using the wizard or manually, click Skip this step to complete the wizard.

You can edit the scope tree manually using the Organize > Scopes and Inventory page.

Step 9

If you have not already created any scopes for the selected VNets and you want to keep the proposed hierarchy, choose the parent scope from above the scope tree, then click Save.


Deleting Connectors and Data

If you delete a connector, data already ingested by that connector is not deleted.

Labels and inventory are automatically deleted from active inventory after 24 hours.

Best Practices When Enforcing Segmentation Policy for Azure Inventory


Warning


Before you enable segmentation enforcement on any VNet, create a backup of the network security groups on that VNet. Enabling segmentation for a VNet removes existing rules from the network security group associated with that virtual network. Disabling segmentation does not restore the old network security groups.


When creating policies: As with all discovered policies, ensure that you have enough flow data to produce accurate policies.

We recommend that you enable enforcement in the workspace before you enable segmentation for the associated VNet. If you enable segmentation for a VNet that is not included in a workspace that has enforcement enabled, all traffic will be allowed on that VNet.

When you are ready to enforce policy for a VNet, edit the Azure connector (see Edit an Azure Connector) and enable segmentation for that VNet.

Note that if a subnet does not have a Network Security Group associated with it, Secure Workload does not enforce segmentation policy on that subnet. When you enforce segmentation policy on a VNet, the NSG at the subnet level is changed to allow all traffic, and Secure Workload policies overwrite the interface-level NSGs. An NSG for the interface is automatically created if not already present.

View Azure Inventory Labels, Details, and Enforcement Status

To view summary information for an Azure connector, from the navigation pane, choose Manage > Workloads > Connectors, and then choose the connector from the top of the page. For more information, click a VNet row.

To view information about Azure VNet inventory, click an IP address on the Azure Connectors page to view the Inventory Profile page for that workload. For more information about inventory profiles, see Inventory Profile.

For information about labels, see:

Concrete policies for VNet inventory are generated based on their orchestrator_system/interface_id label value. You can see this on the Inventory Profile page.

To view enforcement status, choose Defend > Enforcement Status from the navigation bar on the left side of the Secure Workload window. For more information, see Enforcement Status for Cloud Connectors.

Azure Resources or Asset Inventory Reference

Labels let you identify which Azure resource, a private endpoint, connects to and use that information in label‑based policies. This is especially useful when controlling access to PaaS and serverless services that do not expose underlying virtual machines.

Table 4. Azure Asset Discovery

Asset Type

Layer

Ingestion Method

Key Components

Labels Generated

Standard Load Balancer

Layer 4

Service_Details

Rules, Backend Pools, Health Checks service, backend_port, health_check_port

Application Gateway

Layer 7

Service_Details

Rules (converted to services) frontend_ip, backend_config

Basic Load Balancer

-

❌ Not Supported

Note


If you continue to use Basic Load Balancers, they may not appear in inventory or flow‑based views, and their configuration will not be translated into services.

NA

NA

Private Link Service

Network

Machine_Details + Tags

Service IP, Endpoint Links, LB Frontend Config private_link_service_id

Private Endpoint

Network

Machine_Details + Tags

Endpoint IP, PrivateLink URI azure_resource_type, azure_resource_name

Azure SQL Servers

PaaS

Machine_Details + Tags

NA

NA

Azure Function Apps

PaaS

Machine_Details + Tags

NA

NA

Troubleshoot Azure Connector Issues

  • Problem: Azure unexpectedly allows all traffic.

    Solution: Make sure your catch-all policy in Secure Workload is set to deny.

  • Problem: Specific resources are not ingested.

    Solution:

    If a specific resource is not being ingested, ensure the following:

    • The resource belongs to the selected virtual network.

    • The Azure app requires the necessary privileges to ingest the application.

    • The resource is not hidden or if the app has a restricted viewership scope.

  • Problem: If a load balancer (standard or application) does not appear.

    Solution:

    • Verify that rules are defined for this load balancer. Each rule translates to a service.

    • Review the event logs for any clues, errors, or warning messages that may provide insights into the issue.

  • Problem: Private link services/endpoints not visible.

    Solution:

    • Confirm the endpoint IP belongs to the selected VNet.

    • Verify that the Azure app has permissions to read Private Link configurations.

      Ensure the PrivateLink URI format is correct; for example:
      /subscriptions/<>/resourceGroups<>/providers/Microsoft.Storage/...)
    • Problem: Missing private endpoint read permission.

      If the `Microsoft.Network/privateEndpoints/read` permission is not granted, Azure SQL Server and Function App discovery is skipped entirely. The following error is recorded in the event logs:

      Skipping Azure PaaS resource discovery (SQL Servers, Function Apps): Private
              Endpoint data is required but could not be fetched. Please ensure the
              Microsoft.Network/privateEndpoints/read permission is granted.

      Solution

      Grant the `Microsoft.Network/privateEndpoints/read` permission to the connector's service principal.

    • Problem: Missing individual resource permissions.

      If a specific resource permission is missing (for example, `Microsoft.Sql/servers/read`), only that resource type fails to list. An error is recorded in the event logs indicating the API call failure.

      Solution

      Grant the missing permission to the connector's service principal.

    • Problem: Resource not appearing in inventory

      If an expected resource does not appear in the inventory, verify the configuration or required permissions.

      Solution

      • For PaaS resources (SQL Server, Function App): Verify the resource has a Private Endpoint whose subnet is in the configured Virtual Network. PaaS resources without a Private Endpoint in the target VNet will not be discovered.

      • For networking resources (Private Endpoint, Private Link Service, Load Balancer, Application Gateway): Verify the resource's subnet or backend pool is associated with the configured Virtual Network.

      • For all resources: Verify the required Azure permission is granted to the service principal.

Managed Kubernetes Services Running on Azure (AKS)

If you have deployed Azure Kubernetes Services (AKS) on your Azure cloud, then you can use an Azure connector to dynamically pull in inventory and labels (AKS tags) from your Kubernetes cluster.

When an Azure connector is configured to pull metadata from managed Kubernetes services, Secure Workload tracks the status of nodes, pods and services in that cluster.

For the Kubernetes labels gathered and generated using this connector, see Labels Related to Kubernetes Clusters.

Requirements and Prerequisites for AKS
  • Verify that your Kubernetes version is supported. See the Compatibility Matrix for the operating systems, external systems, and connectors for Secure Workload agents.

  • Enable and configure the Managed Kubernetes Services (AKS) capability when you configure the Azure connector. For more information, see Configure an Azure Connector section.

Support for AKS Load Balancer

AKS supports Preserve client IP.

For the following policy intent:

Consumer to provider service, service protocol and port with allow action rules for various cases generates as follows:

Case

Preserve Client

1

On

2

Off

Case 1: Preserve client IP is on.

On the consumer node we generate an egress rule with consumer to load balancer service (lb ingress ip) service protocol and port allow.

A prerouting rule generated for provider node, which specifies the consumer as the source and all provider nodes as the destination. The rule includes the service protocol as the protocol and the node port of the service as the port, with the action set to allow.

On the provider pod, we generate an Ingress rule with src as provider nodes, dest as provider pod (any), protocol as target protocol, port as target port and action as allow.

Case 2: Preserve client IP is off.

On the consumer node we generate an egress rule with consumer to load balancer service (lb ingress ip) service protocol and port allow.

The provider node generates a prerouting rule that sets the lb ingress IPs as the source and all provider nodes as the destination. The rule specifies the service protocol as the protocol and the node port of the service as the port, with the action set to allow.

On the provider pod, we generate an Ingress rule with source as provider nodes, destination as provider pod (any), protocol as target protocol, port as target port and action as allow.

Back up and Restore Network Security Groups Using Azure Connector

The Azure connector now includes the capability to back up and restore your network security groups (NSGs).

The following are the key functionalities:

  • Automatic Backup of Security Groups: When the segmentation option is enabled for a Virtual Network (VNet) in Azure, all the associated NSGs are automatically backed up. This backup captures the NSGs in their current state before any segmentation-related changes are applied.

  • Automatic Restore of Security Groups: When the segmentation option is disabled, the previously backed-up NSGs are restored to their original state, that is, the state they were in when the segmentation was first enabled. Note that only NSGs modified by Secure Workload are restored, ensuring that other unrelated configurations remain unaffected.


Note


When a backup is collected for the first time with segmentation enabled, and subsequent updates include changes to VPCs, a new backup will be created to capture the latest information. At any given time, only one backup state exists for each VPC. Restores will always use the most recent backup state, not the initial backup collected.


Back up Network Security Groups Using Azure Connector

In order to back up Network Security Groups (NSGs), you must enable segmentation.

To enable segmentation and back up NSGs, perform the following steps.

Procedure

Step 1

From the navigation pane, choose Manage > Workloads > Connectors.

Step 2

Click Azure Connector and select Resources > Resources Tree.

Step 3

Select the VNet for which you want to enable segmentation, and click the Segementation radio button next to it.

The system automatically creates a backup of all the associated NSGs. The backup process runs in the background and does not require any manual action.

After segmentation is enabled, Secure Workload updates your NSGs to enforce segmentation policies. These updates are implemented to enhance the security and segmentation of your Azure environment while ensuring compliance with your organization's security standards.


Restore Network Security Groups Using Azure Connector

In order to restore Network Security Groups (NSGs), you must disable segmentation. For more information, see Back up Network Security Groups using Azure Connector.


Note


The restore action is applicable only to the VNet where segmentation was enabled and then disabled. Restoration of a backup is not possible if segmentation was never enabled.


To disable segmentation and restore NSGs, perform the following steps:

Procedure

Step 1

From the navigation pane, choose Manage > Workloads > Connectors.

Step 2

Click Azure Connector and select Resources > Resources Tree.

Step 3

Select the VNet for which you want to disable segmentation, and deselect the Segementation radio button next to it.

The system automatically reverts all the NSGs that were modified by Secure Workload to their original state, which is the state they were in when segmentation was initially enabled.


Selective Workload Enforcement Using Azure Connector

Azure connectors now provide the capability to selectively enforce specific workloads or a group of workloads instead of the entire virtual network (VNet).

Selective enforcement enables you to apply network segmentation policies to specific workloads within a VNet by defining configuration intent with an appropriate filter. The intent ensures that only the selected workloads are managed by Secure Workload for applying Network Security Group (NSG) policies.

Configure Selective Enforcement for Azure Workloads
To configure selective enforcement for Azure workloads, follow these steps.
Before you begin
  • Grant Azure role privileges to selectively manage Application Security Groups (ASGs).

  • Grant Microsoft.Network/applicationSecurityGroups/* Azure role permission to the account managing ASGs.

  • Ensure that Azure roles are assigned to the appropriate user or service principal.

Procedure

Step 1

Ensure that the Azure connector is configured and active. For more information, see Azure Connector Configuration.

Step 2

Ensure that segmentation is enabled. For more information, see Best Practices When Enforcing Segmentation Policy for Azure Inventory.

Step 3

Create an Agent Configuration Intent. For more information, see Creating an Agent Config Intent.

Step 4

Enable segmentation for the virtual network (VNet).

To enable segmentation, follow these steps.

  1. From the navigation pane, choose Manage > Workloads > Connectors.

  2. Click Azure Connector and select Resources > Resources Tree.

  3. Select the VNet for which you want to enable segmentation, and click the Segementation radio button next to it.


One-Click Setup for Onboarding Azure Connector

The One-Click setup for Onboarding Azure is a tool that is designed to simplify and automate the configuration of Azure applications, roles, and permissions. It minimizes manual setup, allowing you to onboard Azure connectors efficiently. The tool is hosted on GitHub and supports both interactive execution and default-value deployment to suit your specific needs.

The following are the key functionalities.

  • Automatically sets up the Microsoft Entra ID (formerly know as Azure Active Directory [AAD]) applications that are required for Secure Workload.

  • Assigns the necessary roles and permissions to enable Secure Workload connectors.

  • Reduces the risk of misconfiguration by automating the end-to-end process.

  • Offers interactive prompts for customization or allows execution with default values for faster deployment.

Prerequisites for Azure One-Click Onboarding
  • Azure Account Requirements

    • You need an active Azure subscription with sufficient privileges to create AAD applications and assign roles.

    • We recommend that the user or account running the script has Owner privileges to ensure that all permissions are properly configured.

  • Environment Requirements

    We recommend that you access the Azure Cloud Shell for executing the script. This environment provides the necessary tools and connectivity to run the script effectively.

Instructions for Azure One-Click Onboarding

For detailed step-by-step instructions, including options for customization and troubleshooting to successfully onboard your Azure connectors, see Azure One-Click Onboarding Script.

GCP Connector

The Google Cloud Platform connector connects with GCP to perform the following high-level functions:

  • Automated ingestion of inventory (and its tags) live from GCP Virtual Private Cloud (VPC)

    GCP allows you to assign metadata to your resources in the form of tags. Secure Workload will query the tags for these resources which can then be used for inventory and traffic flow data visualization, and policy definition. This capability keeps the resource tag mapping updated by constantly synchronizing this data.

    The tags from workloads and network interfaces of a GCP VPC are ingested. If both workloads and network interfaces are configured then the tags are merged and displayed in Secure Workload. For more information, see Labels generated by cloud connectors.

  • Ingestion of flow logs from VPC If you have set up VPC flow logs in GCP for monitoring purposes, Secure Workload can ingest flow log information by reading the corresponding Google Storage bucket. This telemetry can be used for visualization and segmentation policy generation.

  • Segmentation Enabling this option will allow Secure Workload to program security policies using GCP native VPC firewall. When enforcement is enabled for a VPC, relevant policies will be automatically programmed to the VPC firewall.

  • Automated ingestion of metadata from GKE clusters (K8s capabilities) when Google Kubernetes Engine (GKE) is running on GCP, you can choose to gather all node, service, and pod metadata related to all selected Kubernetes clusters.

You can choose which of the above capabilities to enable for each VPC.

Requirements and Prerequisites for GCP Connector

For all capabilities: Create a dedicated service account in GCP, or identify an existing GCP service account for this connector. The connector configuration wizard generates a IAM policy list that you can use to assign required privileges to this service account. Make sure you have permissions in GCP to upload this IAM policy list.


Note


The recommended method for applying the permission in the IAM policy list to the service account is through the CLI.


Each VPC can belong to only one GCP connector. An Secure Workload cluster can have multiple GCP connectors. Gather the information described in the tables in Create a GCP Connector, below.

This connector does not require a virtual appliance.

  • For gathering labels and inventory: No additional prerequisites are required.

  • For ingesting flow logs: VPC level flow log definitions are required in order to trigger the collection of flow logs.

    To use the flow log ingestion, user is required to enable flow logs on the desired VPCs and setup a log router sink.

    Inclusion filter for the log router sink:

    1. resource.type="gce-subnetwork"

    2. log_name="projects/<project_id>/logs/compute.googleapis.com%2Fvpc_flows"

    Choose the sink destination as a cloud storage bucket and then choose the desired storage bucket.

    While configuring the GCP connector with ingress flow logs, it is mandatory to enter the storage bucket name.

    Only flow logs from VPC can be ingested.

    Flow logs must be published to Google storage bucket; Secure Workload cannot collect flow data from Google Cloud Operations Suite.

    Secure Workload can ingest flow logs from an Google Storage bucket associated with any account, if the GCP user account provided during connector creation have access to both the VPC flow logs and the Google storage bucket.

    The following flow log attributes (in any order) are required in the flow log: Source Address, Destination Address, Source Port, Destination Port, Protocol, Packets, Bytes, Start Time, End Time, Action, TCP Flags, Interface-ID, Log status and Flow Direction. Any other attributes are ignored.

    Flow logs must capture both Allowed and Denied traffic.

  • For segmentation: Enabling segmentation requires Gather Labels to be enabled.

    Back up your existing security groups before enabling segmentation in the connector, as all existing rules will be overwritten when you enable segmentation policy enforcement for a VPC.

    See also Best Practices When Enforcing Segmentation Policy for GCP Inventory, below.

  • For managed Kubernetes services (GKE): If you enable the Kubernetes option, see requirements and prerequisites in the Managed Kubernetes Services Running on GCP (GKE) section below, including required access privileges.

Configure Multiple Projects Access in GCP

To configure cross multiple projects access in GCP, you can follow these steps:

Procedure

Step 1

Sign in to your GCP console.

Step 2

Click on the project drop-down menu in the top navigation bar and select New Project or you can either create a new Project or use an existing project with service Account.

Step 3

Enter a name for your new project. Choose the organization that own the new project or select No organization if you do not have one.

Step 4

Click on the Create button to create the new project.

Note


You can repeat the step 2 to 4 to create as many projects as you need.

Step 5

To link multiple projects in a single service account, navigate to IAM & Admin page and choose Service Account.

Step 6

Click on the Create Service Account button. Follow the prompts to create the service account and grant it the necessary permissions.

Note


You can either use an existing service account or create a new service account.

Step 7

From the Keys tab, click Add Key to generate a private key in JSON file.

Step 8

Go to the IAM & Admin page in the GCP console and select IAM.

Note


You have to first change the project before you click on IAM & Admin and then try to grant privilege.

Step 9

Click on the Grant access button to add a new project.

Step 10

In the New principals field, enter the email address of the service account you want to link to the project.

Step 11

Click on the Save button to associate the service account to your project.

Note


Repeat these steps for each project that you want to link to your original project.

You can manage the service account permissions by going to the IAM & Admin page in the GCP console and selecting IAM for each project.

Step 12

Make sure that the Service Account has permissions to least common ancestor (common ancestor to all the projects selected) resource level, such as a folder or organization.


GCP Connector Configuration Overview

The following graphic gives a high-level overview of the connector configuration process. For essential details, see the next topic (Create a GCP Connector.)

Figure 88. GCP connector configuration overview

(Note that the numbers in the graphic do not correspond to step numbers in the detailed procedure.)

Create a New GCP Connector

Procedure

Step 1

From the navigation pane, choose Manage > Connectors.

Step 2

Click GCP Connector.

Step 3

Click either of the options to create a new GCP connector:

  • Get Started Guide

    OR
  • Generate Templates

Step 4

Get Started Guide: Use this option to gather labels and flow data from GKE clusters. Before you configure this connector, see:

  • Requirements and prerequisites

    Understand the general requirements and prerequisites for the GCP cloud connector as well as the specific requirements for each capability.

  • GCP Roles and Permissions

    This wizard creates a GCP Cloud Deployment Manager template with the roles and policies required for the capabilities you enable. You will upload this template to GCP.

  • Segmentation policy enforcement: Before you enable policy enforcement for any VPC, read about important caveats and take action to avoid unintended results.

Step 5

Click Get Started. For more information, see Edit a New GCP Connector.

Step 6

Click Generate Templates.

Cisco Secure Workload requires relevant permissions to access and read flow logs settings and perform policy enforcement. Based on the capability selections, a Cloud Deployment Manager template is auto-generated. Use this template to apply the relevant permissions to the desired user. Copy or paste commands to create the recommended built-in role on GCP CLI.

Select activities to be performed with Cisco Secure Workload on your GCP Resources.

  • Context Gathering

  • Ingest Flow Logs

  • Segmentation

  • Managed Kubernetes Services

Note


The above selections will determine the RBAC recommendations.

Step 7

Create new Service Accounts and grant IAM roles to service accounts in the Google Cloud console.

Use IAM roles with custom service accounts to-

  • Limit the instances access to Google Cloud APIs using granular IAM roles.

  • Provide each instance, or set of instances, a unique identity.

  • Limit the access of the default service account.

Step 8

Create and manage service accounts using the Identity and Access Management (IAM) API, and the Google Cloud console.

Step 9

In addition to basic roles (viewer, editor, owner) and custom roles, assign the Compute Engine predefined roles to the members of your project:

  • Compute Network Viewer

  • Kubernetes Engine Roles and Permissions

Step 10

Create and manage Google Cloud resources and services directly on the command line or through scripts using the Google Cloud CLI. You can either Copy or Download the template.


What to do next

If you have enabled Context Gathering, Ingest Flow Logs, Segmentation, and or Managed Kubernetes Services:

  • If you enabled flow ingestion, it may take up to 25 minutes for flows to begin appearing on the Investigate > Traffic page.

  • (Optional) For richer flow data and other benefits including visibility into host vulnerabilities (CVEs), install the appropriate agent for your operating system on your VPC-based workloads. For requirements and details, see the agent installation chapter.

  • After you have successfully configured the GCP connector to gather labels and ingest flows, follow the standard process for building segmentation policies. For example: Allow Secure Workload to gather sufficient flow data to generate reliable policies; define or modify scopes (typically one for each VPC); create a workspace for each scope; automatically discover policies based on your flow data, and/or manually create policies; analyze and refine your policies; ensure that your policies meet the guidelines and best practices below; and then, when you are ready, approve and enforce those policies in the workspace. When you are ready to enforce segmentation policy for a particular VPC, return to the connector configuration to enable segmentation for the VPC.

    For more information, see Best Practices When Enforcing Segmentation Policy for GCP Inventory.

If you have enabled Managed Kubernetes Services (GKE) option:

Event Log:

The event logs can be used to know significant events happening per connector from different capabilities. We can filter them using various attributes like Component, Namespace, Messages and Timestamp.

Create a GCP Connector

Procedure

Step 1

From the navigation pane, choose Manage > Connectors.

Step 2

Click GCP Connector.

Step 3

Click Enable for the first connector (in a root scope) or Enable Another for additional connectors in the same root scope.

Step 4

Understand and meet requirements and prerequisites in Requirements and Prerequisites for GCP Connector and Managed Kubernetes Services Running on GCP (GKE), then click Get Started.

Step 5

Enter a name for the connector and choose desired capabilities, then click Next.

Selections you make on this page are used only to determine the privileges included in the IAM policy list that will be generated in the next step, and to display the settings that you will need to configure.

If the Injest Flow Logs capabilities is checked, you must enter Flow Log Storage Bucket Name in the next step.

In order to enable Segmentation, you must check Gather Labels.

Step 6

Create Service Accounts in the Google Cloud console.

Step 7

Download the generated IAM custom role policy list.

This IAM custom role policy list has the IAM privileges required for the capabilities that you selected in the previous step.

If you have enabled the Kubernetes option, you must separately configure permissions for GKE.

For more information, see Managed Kubernetes Services Running on GCP (GKE).

Step 8

Generate a Service Accounts custom role in the Google Cloud console; use the sample command below using Google Cloud CLI:

gcloud iam roles create <Role Name> --project=<Project id> --file=<File path>

Step 9

Upload the service account json file with required capabilities that was created as a prerequisite.

Note


In GCP, the single connector supports multiple projects and ensure that the service account is directly linked to all projects.

Step 10

Enter the Flow Log Storage Bucket Name if the Ingress Flow logs capability is checked.

Step 11

Enter the Root Resource Id, which is also the GCP folder ID or organization ID.

Note


To obtain the Root Resource ID, navigating to the IAM & Admin, Settings section and you can view it directly in the Cloud Console. Alternatively, you can also utilize the Cloud SDK command to retrieve the Root Resource ID.

Step 12

Configure the following settings:

Attribute

Description

HTTP Proxy

Proxy required for Secure Workload to reach GCP.

Full Scan Interval

Frequency with which Secure Workload refreshes complete inventory data from GCP. Default and minimum is 3600 seconds.

Delta Scan Interval

Frequency with which Secure Workload fetches incremental changes in inventory data from GCP. Default and minimum is 600 seconds.

Step 13

Click Next.

Step 14

The next page displays a Resource Tree where the user can expands to view various region and inside the region you can select or unselect the resource check boxes to obtain the list of VPCs and GKE clusters from GCP.

Step 15

From the list of VPCs (Virtual Networks) and GKE clusters, choose the resources and their respective capabilities.

Generally, you should enable flow ingestion as soon as possible, so that Secure Workload can begin to collect enough data required to suggest accurate policies.

Generally, you should not choose Enable Segmentation during initial configuration. Later, when you are ready to enforce segmentation policy for specific VPCs, you can edit the connector and enable segmentation for those VPCs. See the Best Practices When Enforcing Segmentation Policy for GCP Inventory.

Step 16

Click Create and wait a few minutes for the validation check to complete.

The View Groups page shows all VPCs that you enabled for any functionality on the previous page, grouped by logical_group_id (CSW), which is also a project_id (GCP). Each logical_group_id, and each VPC in each logical_group_id, is a new scope.

Step 17

Choose the parent scope under which to add the new set of scopes. If you have not yet defined any scopes, your only option is the default scope.

Step 18

To accept all settings configured in the wizard including the hierarchical scope tree, click Save.

To accept all settings, except the hierarchical scope tree, click Skip this step.

You can manually create or edit the scope tree later, under Organize > Scopes and Inventory.


What to do next

If you have enabled gathering labels, ingesting flow data, and/or segmentation:

  • If you enabled flow ingestion, it may take up to 25 minutes for flows to begin appearing on the Manage > Workloads > Connectors page.

  • (Optional) For richer flow data and other benefits including visibility into host vulnerabilities (CVEs), install the appropriate agent for your operating system on your VPC-based workloads. For requirements and details, see the agent installation chapter.

  • After you have successfully configured the GCP connector to gather labels and ingest flows, follow the standard process for building segmentation policies. For example: Allow Secure Workload to gather sufficient flow data to generate reliable policies; define or modify scopes (typically one for each VPC); create a workspace for each scope; automatically discover policies based on your flow data, and/or manually create policies; analyze and refine your policies; ensure that your policies meet the guidelines and best practices below; and then, when you are ready, approve and enforce those policies in the workspace. When you are ready to enforce segmentation policy for a particular VPC, return to the connector configuration to enable segmentation for the VPC. For details, see Best Practices When Enforcing Segmentation Policy for GCP Inventory.

If you have enabled the Kubernetes managed services (GKE) option:

Event Log:

The event logs can be used to know significant events happening per connector from different capabilities. We can filter them using various attributes like Component, Namespace, Messages and Timestamp.

Edit a GCP Connector

If you want to enable gathering data from different or additional VPCs or GKE clusters, you may need to upload a service account json file with required capabilities with different permissions before you can select different VPCs or GKEs.

Changes are not saved until you finish the wizard.

Procedure

Step 1

From the navigation bar at the left side of the window, choose Manage > Workloads > Connectors.

Step 2

Click GCP Connector.

Step 3

If you have more than one GCP connector, choose the connector to edit from the top of the window.

Step 4

Click Edit Connector.

Step 5

Click through the wizard again and make changes. For detailed descriptions of the settings, see Create a GCP Connector.

Step 6

If you enable different capabilities (gathering labels, ingesting flows, enforcing segmentation, or gathering GKE data), you must download the revised IAM template and upload it to GKE before continuing the wizard.

Step 7

To enable enforcement of segmentation policy, first ensure that you have completed recommended prerequisites described in Best Practices When Enforcing Segmentation Policy for GCP Inventory. On the page that lists the VPCs, select Enable Segmentation for the VPCs on which you want to enable enforcement.

Step 8

If you have already created scopes for any of the selected VPCs, either using the wizard or manually, click Skip this step to complete the wizard.

You can edit the scope tree manually using the Organize > Scopes and Inventory page.

Step 9

If you have not already created any scopes for the selected VPCs and you want to keep the proposed hierarchy, choose the parent scope from above the scope tree, then click Save.


Deleting Connectors and Data GCP

If you delete a connector, data already ingested by that connector is not deleted.

Labels and inventory are automatically deleted from active inventory after 24 hours.

Best Practices When Enforcing Segmentation Policy for GCP Inventory


Warning


Before you enable segmentation enforcement on any VPC, create a backup of the security groups on that VPC. Enabling segmentation for a VPC removes existing Security Groups from that VPC. Disabling segmentation does not restore the old security groups.


When creating policies:

  • As with all discovered policies, ensure that you have enough flow data to produce accurate policies.

  • Because GCP allows both ALLOW/DENY rules in firewall policy. Since GCP has very strict limitation on number of rules. So, it is better to have only ALLOW-list.

We recommend that you enable enforcement in the workspace before you enable segmentation for the associated VPC. If you enable segmentation for a VPC that is not included in a workspace that has enforcement enabled, all traffic will be allowed on that VPC.

When you are ready to enforce policy for a VPC, edit the GCP connector (see Edit a GCP Connector) and enable segmentation for that VPC.

GKE Inventory Labels, Details, and Enforcement Status

To view summary information for a GCP connector, navigate to Connector > and choose GCP Connector on the Connectors page.

To view information about inventory, click the IP address of a particular workload from the Scopes and Inventory page. You can also access the Inventory Profile from the interface tab on the VPC Profile. For more information about the Inventory profile, see Inventory Profile.

Similarly, to view all Concrete Policies under the VPC profile, from the Inventory Profile Concrete Policies tab, navigate to the parent VPC Profile to see all the Concrete Policies under the VPC.

The VPC Profile is accessible from the GCP Configuration or Enforcement Status page (either global or within a workspace). You can view the Enforcement Status and Concrete Policies at the VPC level on the VPC Profile. You can also view the combined VPC Firewall Polices of all the interfaces on the VPC Firewall Policies tab.

For more information on labels, see:

Troubleshoot GCP Connector Issues

Problem: The Enforcement Status page shows that a Concrete Policy was SKIPPED.

Solution: This occurs when the number of rules in firewall policy exceeds the GCP limits, as configured in the GCP connector.

When a concrete policy shows as SKIPPED, the new security groups are not implemented and the previously existing security groups on GCP remain in effect.

To resolve this issue, see if you can consolidate policies, for example by using a larger subnet in one policy rather than multiple policies with smaller subnets.

Background:

Concrete policies are generated for each VPC when segmentation is enabled. These concrete policies are used to create firewall policy in GCP. However, GCP and Secure Workload count policies differently. When converting Secure Workload policies to GCP firewall rules in firewall policy, GCP counting mechanism is complex. For more details, see GCP.

Problem: GCP unexpectedly allows all traffic

Solution: Make sure your Catch-All policy in Secure Workload is set to Deny.

Managed Kubernetes Services Running on GCP (GKE)

You can use a cloud connector to gather metadata from Google Kubernetes Engine (GKE) clusters running on Google Cloud Platform (GCP).

The connector gathers all node, service, and pod metadata related to all selected Kubernetes clusters.

Requirements and Prerequisites

Secure Workload requirements: This connector does not require a virtual appliance.

Platform requirements:

  • Make sure you have permissions in GCP to configure the required access for this connector.

  • Each GKE cluster can only belong to one GCP connector.

  • Gather the information described in the tables in Configure a GCP connector, below.

GKE requirements:

Backup and Restore Google Cloud VPC Firewall Rules Using GCP Connector

The GCP connector now includes the capability to back up and restore your Google Cloud VPC Firewall Rules.

The following are the key functionalities:

  • Automatic Backup of Firewall Rules: When the segmentation option is enabled for a Google Cloud VPC, all the associated firewall rules are automatically backed up. This backup captures the firewall rules in their current state before any segmentation-related changes are applied.

  • Automatic Restore of Firewall Rules: When the segmentation option is disabled, the previously backed-up firewall rules are restored to their original state, that is, the state they were in when the segmentation was first enabled. Note that only firewall rules modified by Secure Workload are restored, ensuring that other unrelated configurations remain unaffected.


Note


When a backup is collected for the first time with segmentation enabled, and subsequent updates include changes to VPCs, a new backup will be created to capture the latest information. At any given time, only one backup state exists for each VPC. Restores will always use the most recent backup state, not the initial backup collected.


Back up Google Cloud VPC Firewall Rules Using GCP Connector

In order to back up Google Cloud VPC firewall rules, you must enable segmentation.

To enable segmentation and back up Google Cloud VPC firewall rules, perform the following steps.

Procedure

Step 1

From the navigation pane, choose Manage > Workloads > Connectors.

Step 2

Click GCP Connector and select Resources > Resources Tree.

Step 3

Select the Google Cloud VPC for which you want to enable segmentation, and click the Segementation radio button next to it.

The system automatically creates a backup of all the associated firewall rules. The backup process runs in the background and does not require any manual action.

After segmentation is enabled, Secure Workload updates your firewall rules to enforce segmentation policies. These updates are implemented to enhance the security and segmentation of your GCP environment while ensuring compliance with your organization's security standards.


Restore Google Cloud VPC Firewall Rules Using GCP Connector

In order to restore Google Cloud VPC Firewall Rules, you must disable segmentation. For more information, see Backup and Restore Firewall Rules using GCP Connector.


Note


The restore action is applicable only to the Google Cloud VPC Firewall Rules where segmentation was enabled and then disabled. Restoration of a backup is not possible if segmentation was never enabled.


To disable segmentation and restore Firewall rules, perform the following steps:

Procedure

Step 1

From the navigation pane, choose Manage > Workloads > Connectors.

Step 2

Click GCP Connector and select Resources > Resources Tree.

Step 3

Select the Google Cloud VPC Firewall Rules for which you want to disable segmentation, and deselect the Segementation radio button next to it.

When segmentation is disabled, Secure Workload restores the previously backed-up firewall rules to the exact state they were in when segmentation was first enabled. Only rules that Secure Workload modified are restored, ensuring unrelated firewall configurations remain unchanged. From the UI, when a user turns off segmentation, a dialog prompts them to select the VPC(s) to restore; once confirmed, Secure Workload initiates the restore for the selected VPC(s).


Cloud Connector Alerts

Alerts are generated when a cloud connector stops functioning or there is no heartbeat in the past one minute.

Step 1: To enable alerts, from the navigation pane, choose Investigate > Configuration. The Alerts Config page displays.

Step 2: To configure/manage alerts, on the Alerts Config page, click the + icon against Connector.

Step 3: Use the Enable toggle to enable Connector Alerts.

Step 5: Click Submit. After the connector alerts are enabled, any type of connector alerts will be received based on rules or configuration on the respective pages.

Figure 89. Enable Connector Alerts
Figure 90. Example of Cloud Connector Azure Alert
Table 5. Alert Details

Field

Type

Description

Name

String

Cloud connector name

Type

String

The different types of alerts categorized under Compliance, Forensics, Enforcement, Connector, Platform, and Traffic.

Desc

String

Summary of the alert.

Open

String

The services deployed that are still open.

Recently closed

String

The services deployed that are closed.

Service

String

Services deployed on the cloud connector.

For example, Azure Kubernetes Services (AKS) on your Azure cloud.

Summary ID

String

Summary information for the cloud connector.

Event Logs

Event Log:

The event logs can be used to know significant events happening per connector from different capabilities. We can filter them using various attributes like Component, Namespace, Messages and Timestamp.

Figure 91. Event Log

ACI Connector

Cisco Application Centric Infrastructure (ACI) connector is a logical component that acts as a bridge, extending the policy-driven capabilities of the Cisco ACI fabric to external systems and workloads. Its primary purpose is to enable seamless communication, policy enforcement, and operational visibility between the ACI network and various endpoints. The ACI connector supports virtualization (VMware vCenter, Hyper-V, and OpenStack), containers (Kubernetes and OpenShift), and clouds (AWS, Azure, and GCP). It enables endpoint discovery, policy application using Endpoint Security Groups (ESGs), and telemetry collection with TLS-encrypted communication.​ The ESGs gather telemetry regardless of where the workloads reside or how the workloads are managed.

The ACI connector supports the capabilities of cloud connectors and FMC connector with additional capabilities of:

  • Visibility of workloads or IPs belonging to Cisco ACI fabric.

  • Visibility of labels ingested from ACI.

  • Scope-to-ACI-mapping.


Note


The ACI fabric can have more than one connector; however, we recommended a single connector for every fabric to avoid unknown policy issues. Configure the IP addresses of APICs and Admin credentials in the ACI connector.


Configure an ACI Connector in Secure Workload

To configure an ACI connector, perform the steps below:

Procedure


Step 1

From the navigation pane, choose Manage > Workloads > Connectors.

Step 2

Click ACI Connector > Configure your New Connector and configure the settings.

Attribute

Description

Connector Name

The name of the connector associating with the ACI connector.

Description

Short description of the connector.

APIC nodes

The IP addresses and the port numbers of the APIC nodes for this connector.

Note


Note that you can add only 7 APIC nodes for the connector.

Credentials

Enter the username and the password. Check or unselect the check box of the Self-signed certificate.

No proxy

Secure Workload can directly connect to the destination system.

Secure Connector

Enable if a Secure Connector is used to tunnel connections from Secure Workload.

Before you can enable this option, you should have deployed a Secure Connector.

For more information, see Secure Connector.

HTTP Proxy

Proxy required for Secure Workload to reach APIC. Supported proxy ports: 80, 8080, 443, and 3128.

Step 3

Click Save to save the changes.


Figure 92. Configure a new ACI Connector
ACI Connector1 configuration tab showing name, APIC nodes, username, and proxy settings.

Configure the VRF to Scope Mapping

To configure the mapping of Virtual Routing and Forwarding (VRF) with scopes in Secure Workload, make sure you map one VRF to only one scope. This ensures that when policies are enforced, all the child scopes under the mapped scope is considered while configuring the mapping.


Note


You can enable and disable segmentation in this tab for the VRFs that are mapped.


Procedure
Command or Action Purpose

Click Add mapping to configure a VRF with a Secure Workload scope. Edit the VRF EPG and tick the “allow micro-segmentation” option

Figure 93. ACI Connector - Segmentation
ACI segmentation tab showing VRF to scope mapping and enforcement status.

The Status tab provides TCAM utilization information for all fabric switches. When policy enforcement process starts, it checks the status of the TCAM availability and when all the participating switches have sufficient TCAMs available then the policies are pushed, and the enforcement process gets completed.

Figure 94. ACI Connector - TCAM utilization
ACI connector status tab showing TCAM consumption status for multiple leaf switches.

Secure Connector

In order for Secure Workload to import user tags or enforce policies on external orchestrators (see External Orchestrators), Secure Workload needs to establish outgoing connections to the orchestrator API servers (vCenter, Kubernetes, F5 BIG-IP, etc.). Sometimes it is not possible to allow direct incoming connections to the orchestrators from the Secure Workload cluster. Secure Connector solves this issue by establishing an outgoing connection from the same network as the orchestrator to the Secure Workload cluster. This connection is used as a reverse tunnel to pass requests from the cluster back to the orchestrator API server.

Figure 95. Secure Connector
Secure Connector

For each root scope, only one tunnel may be active at any time. Attempts to start additional tunnels will be rejected with an error message indicating that one is already active. The active tunnel can be used to connect to multiple orchestrators that are reachable from the network in which the client is running. A per-orchestrator configuration is used to indicate whether connections to that orchestrator should go through the Secure Connector tunnel.

All communication between the Secure Connector client and the Secure Workload cluster is mutually authenticated and encrypted using TLS.

For improved security, customers are advised to install the Secure Connector client on an isolated appropriately secured machine. The machine should have firewall rules to allow outgoing connections only to the Secure Workload cluster and any external orchestrator API servers Secure Workload should be allowed to access.

To configure orchestrators to use the Secure Connector tunnel, see instructions for configuring the external orchestrator for your product.

For more details on OpenAPI endpoints for the Secure connector, see Secure Connector API endpoints

Technical Details

To bootstrap the tunnel, the Secure Connector client creates a public or private key pair and signs its public key certificate remotely by the server. A cryptographic single-use time-limited token is used to secure this remote signing process and identify the root scope to which the client belongs. On the server side, each root scope has a unique certificate that the client uses to authenticate the server. These certificates are periodically rotated to ensure the continued secrecy of communication.

The Secure Connector client is internally constructed of a tunnel client and a SOCKS5 server. After the tunnel is started, the client waits for incoming tunnelling connections from the Secure Workload Cluster. Incoming connections are handled by the SOCKS5 server and forwarded to the destination host.

Requirements for Secure Connector Client

The following are the requirements for the Secure Connector client:

  • For information on RHEL and CentOS, see the Secure Workload Compatibility Matrix.

  • Sufficient network bandwidth for handling data from the on-premises orchestrators that use the Secure Connector.

  • Outgoing connectivity to the Secure Workload cluster on port 443 (direct or through HTTP(S) proxy).

  • Outgoing connectivity to internal Orchestrator API servers (direct).

Secure Connector Client Deployment

Proxy Support

The Secure Connector client supports connecting to the Secure Workload cluster through an HTTP(S) proxy. If needed, the proxy server must be configured by setting the HTTPS_PROXY environment variable for the client. To set the variable, add the following line in the [Service] section of the systemd service file located at /etc/systemd/system/tetration- secure-connector.service. This setting will not persist across re-installations. For a sticky configuration, the line can be added in a new file at /etc/systemd/system/tetration-secure-connector.service.d/10-https-proxy.conf. For either configurations to take effect, reload the systemd config by running systemctl daemon-reload.
[Service]
Environment="HTTPS_PROXY=<Proxy Server Address>"

Deploy the Secure Connector Client

Download Latest Secure Connector Client RPM
Procedure

Step 1

In the navigation pane, click Manage > Workloads > Secure Connector.

Step 2

Click Download Latest RPM.

Step 3

Copy the RPM package to the Linux host for deployment, and then execute the following command with root privileges: rpm -ivh <rpm_filename>


Generate Registration Token
Procedure

Step 1

Click Manage > Workloads > Secure Connector.

Step 2

Click Generate Registration Token.


Copy the Token and Start the Client

After generating a registration token on the Secure Connector page, you will have a registration.token file that contains the single-use limited-time token for bootstrapping the client. Stop the Secure Connector client on the host and copy the token file where you have installed the Secure Connector client package.

  1. To stop the client, run the following command: systemctl stop tetration-secure-connector

  2. Copy the registration.token file to the /etc/tetration/cert/ folder.

  3. To restart the client, run the following command: systemctl start tetration-secure-connector

[Optional] Deploy Specific Version of Secure Connector Client

Procedure

Step 1

Download a specific version of Secure Connector Client RPM.

  1. In the navigation pane, click Manage > Workloads > Agents.

  2. Click the Installer tab.

  3. Click Manual Install using classic packaged installers, then click Next.

    The Secure Connector Client packages have the agent type as Secure Connector.

  4. Find the appropriate version (if multiple are available on the cluster) and click Download.

  5. Copy the RPM package to the Linux host for deployment, and then execute the following command with root privileges: rpm -ivh <rpm_filename>.

Step 2

Retrieve a new token using the API.

Secure Connector tokens can also be retrieved through OpenAPI (Get Token endpoint). The following Python and Bash snippets can be used to retrieve a new token. Note that the API key used must have the external_integration capability and must have write access to the specified root scope. See OpenAPI Authentication for information on installing the Secure Workload OpenAPI client for python and creating a new API key.

  • Python snippet for token retrieval


    from tetpyclient import RestClient
    from urllib import quote

    API_ENDPOINT = "https://<UI_VIP_OR_DNS_FOR_TETRATION_DASHBOARD>"
    ROOT_SCOPE_NAME = r"""<ROOT_SCOPE_NAME>"""
    API_CREDENTIALS_FILE = "<API_CREDENTIALS_JSON_FILE>"
    OUTPUT_TOKEN_FILE = "registration.token"

    if __name__ == "__main__":
      client = RestClient(API_ENDPOINT,
                          credentials_file=API_CREDENTIALS_FILE)  # Add (verify=False) to skip certificate verification
      escaped_root_scope_name = quote(ROOT_SCOPE_NAME, safe='')
      resp = client.get('/secureconnector/name/{}/token'.format(escaped_root_scope_name))
      if resp.status_code != 200:
        print 'Error ({}): {}'.format(resp.status_code, resp.content)
        exit(1)
      else:
        with open(OUTPUT_TOKEN_FILE, 'w') as f:
          f.write(resp.content)
  • BASH snippet for token retrieval


    #!/bin/bash
    HOST="https://<UI_VIP_OR_DNS_FOR_TETRATION_DASHBOARD>"
    API_KEY="<API_KEY>"
    API_SECRET="<API_SECRET>"
    ROOTSCOPE_NAME="<ROOT_SCOPE_NAME>" # if the name contains spaces or special characters, it should be url-encoded
    TOKEN_FILE="registration.token"
    INSECURE=1 # Set to 0 if you want curl to verify the identity of the cluster

    METHOD="GET"
    URI="/openapi/v1/secureconnector/name/$ROOTSCOPE_NAME/token"
    CHK_SUM=""
    CONTENT_TYPE=""
    TS=$(date -u "+%Y-%m-%dT%H:%M:%S+0000")
    CURL_ARGS="-v"
    if [ $INSECURE -eq 1 ]; then
        CURL_ARGS=$CURL_ARGS" -k"
    fi

    MSG=$(echo -n -e "$METHOD\n$URI\n$CHK_SUM\n$CONTENT_TYPE\n$TS\n")
    SIG=$(echo "$MSG"| openssl dgst -sha256 -hmac $API_SECRET -binary | openssl enc -base64)
    REQ=$(echo -n "curl $CURL_ARGS $HOST$URI -w '%{http_code}' -H 'Timestamp: $TS' -H 'Id: $API_KEY' -H 'Authorization: $SIG' -o $TOKEN_FILE")
    status_code=$(sh -c "$REQ")
    if [ $status_code -ne 200 ]; then
        echo "Failed to get token. Status: " $status_code
    else
        echo "Token retrieved successfully"
    fi

Step 3

Copy the token and start the client. For detailed instructions, see Copy the Token and start the Client.


Secure Connector Client Status

On the External Orchestrators page, the status of the configured external orchestrators and Secure Connector tunnel is displayed. If Secure Connector is enabled while configuring the external orchestrators, you can view the Secure Connector client metrics on the Secure Connector page.

However, if the Secure Connector tunnel status is Active but the client metrics are not visible, it implies an older version of Secure Connector is installed. A message to upgrade the Secure Connector Client version is displayed as shown:

Figure 96. Secure Connector Client upgrade message
Secure Connector Client upgrade message

Note


For instructions on installing the latest Secure Connector RPM, see Download and Install Latest Secure Connector Client RPM


To view the client metrics:

Procedure


Step 1

Under Configure Details, click the Status row. The Secure Connector page is displayed.

Note


To access the status of the Secure Connector tunnel, select Manage > Workloads > Secure Connector in the left pane.

Step 2

Select the tabs - General, Interface, or Routes to access more details on the connectivity status between the client and Secure Workload cluster.

Tabs

Description

General

Lists the following information:

  • Tunnel Status

  • Hostname

  • IP Address

  • HTTP/HTTPS Proxy

  • Version- Lists the build version.

  • No. vCPU’s

  • Total Memory (GB)

  • Uptime- Lists the uptime of the VM where the Secure Connector client is running.

  • Last Heartbeat Received- Lists the day and timestamp of heartbeat last received from client.

  • No. of Heartbeat Failures (Last 1 day)- Lists the number of times the connectivity to the Secure Connector client failed in a day. If the client remains to stay inactive, the count is not incremented. The count is reset at the end of day.

  • Round Trip Latency (ms)

Interface

Lists the interface details of the VM where the Secure Connector client is running.

Routes

The route table lists the destination IP addresses, gateway, genmask, and interface.


Verify Secure Connector Client State

  • To check if the Secure Connector client is installed, query the RPM database for the tet- secureconnector-client-site package by running the following command: rpm -q tet-secureconnector-client-site

  • To check the state of the installed client, you can check the status of the tetration-secure- connector systemd service by running the following command: systemctl status tetration-secure-connector

Secure Connector Alerts

The alert is generated when Secure Connector stops functioning or if there is no heartbeat in the past one minute.

Step 1: To enable alert, click Manage > Workloads > Secure Connector.

Step 2: Click the Alerts tab.

Step 3: Check the Enable Alert checkbox.

Step 4: Choose a Severity value from the drop-down.

Step 5: Click Update Config.

Figure 97. Enable Secure Connector Alerts

Note


Ensure that the Connectors alerts is enabled in the Manage > Alerts - Configuration page.


Navigate to Investigate > Alerts and click on an alert to view more details.

Alert text: Secure Connector: <reason for connection failure>

Figure 98. Secure Connector Alert
Table 6. Alert Details

Field

Type

Description

Name

String

Secure Connector name

Type

String

Secure Connector type

Last Checkin At

String

Last known time when there was a heartbeat

Hostname

String

Name of the machine hosting this Secure Connector

Total Memory (GB)

String

RAM in GB

No. vCPU's

String

Number of CPUs

VM IPs

String

List of network interfaces on the Secure Connector client host

Upgrade Secure Connector Client

The Secure Connector client does not support automatic updates. To deploy a new version:

  1. Run the following command to uninstall the current version: rpm -e tet-secureconnector-client-site

  2. Deploy the new version. For detailed instructions, see Deploy the Secure Connector Client.

Uninstall Secure Connector Client

The Secure Connector Client can be uninstalled using the following command: rpm -e tet-secureconnector-client-site

Secure Connector Client Maintenance

This document describes best practices to maintain your Secure Connector client installation.

Secure Workload can be configured to import user tags or enforce policies on external orchestrators. For this, Secure Workload needs to establish outgoing connections to the orchestrator API servers (vCenter, Kubernetes, F5 BIG-IP, etc.).

Sometimes it is not possible for customers to allow direct incoming connections to the orchestrators from the Secure Workload cluster due to network boundaries such as cloud into Enterprise networks or from cloud to secure private endpoints in other clouds. In some cases, customers have partitioning within their enterprise networks that prevents connecting from Secure Workload clusters to other parts of the enterprise networks.

Secure Workload solves this issue by establishing an outgoing connection from the same network as the orchestrator to the Secure Workload cluster. This connection is used as a reverse tunnel to pass requests from the cluster back to the orchestrator API server.

Figure 99. Secure Connector
Secure Connector

Distribution of Secure Connector client software

The Secure Connector client functionality MUST be run on a customer owned machine/VM to solve this networking connectivity issue. We cannot run this client on our cloud or on-premises cluster.

The client thus needs to be supplied by Secure Workload to customers to install, run and maintain on their own VMs - we supply the software as an RPM installer package downloadable from our UI.

Installation and Upgrade of Secure Connector Client software

The client software is distributed as an RPM - the RPM contains a single statically linked Golang binary and some configuration files and installs itself as a systemd service.

As RPM-distributed software goes, it can be installed and upgraded using rpm upgrade commands and providing a newer RPM package. The user must download the latest available secure connector client software RPM from our UI and run upgrade commands as documented in the user guides.

Since this RHEL/CentOS VM is not managed or maintained in any way by our software, all RPM install/upgrade and security and operation maintenance operations are up to the owner of the VM.

Release Schedule of Secure Connector client software

The Secure connector client RPM is upgraded whenever new functionality is added or a fix is needed or a newer version of the Go compiler is released, which is 6 months for major versions and could be monthly for minor security updates. In general, users may expect to see a new RPM with every release of Secure Workload software.

Changes to the communication protocol are backwards compatible so users may choose not to upgrade and will still get basic functionality. However, they may miss out on new features and security fixes if they do not upgrade.

Network Attack Surface of Secure Connector Client daemons

Customers are advised to install the Secure Connector client on a dedicated and isolated appropriately secured machine.

The Secure Connector client is a daemon running on the VM but has no ports open for listening. It is always the initiator of TCP connections and all communication between the Secure Connector client and the Secure Workload cluster is mutually authenticated and encrypted using TLS.

No inbound ports need to be opened on the VM firewall.

The machine should have firewall rules to allow outgoing connections only to the Secure Workload cluster and any external orchestrator API servers Secure Workload should be allowed to access.

High Availability Best Practices for Secure Connector client

A single VM running Secure Connector client is a single point of failure.

The recommended best practice is to create 2 dedicated VMs in different failure zones and install Secure Connector client software on both of them. The registration token is a OTP and must be generated twice and put at the required path on each installation (at /etc/tetration/cert/registration.token).

At the Secure Workload server, we only allow one active tunnel, but the clients will all keep trying to connect and become the active tunnel. So multiple installations of Secure Connector clients will act as a single hot and multiple cold standby clients - the currently active tunnel client VM can be discovered from the UI as we report its hostname and IP on the Secure Connector UI page.

Identity Connectors

An Identity Connector serves as a bridge between Secure Workload and various identity stores, such as OpenLDAP, Active Directory and Microsoft Entra ID. The connector enables you to synchronize the information that is stored in the identity stores without the need for manual intervention. You can now configure an identity connector to import user data, user group data from LDAP, Active Directory and Microsoft Entra ID.

Figure 100. Types of Identity Sources

OpenLDAP Connector

Lightweight Directory Access Protocol (LDAP) is a protocol designed for retrieving information about users, user groups, organizations, and other attributes. Its primary objective is to store data in the LDAP directory to streamline user management.

Note


The supported version for OpenLDAP data ingestion is OpenLDAP 2.6.


Configure Identity Connector with OpenLDAP

Create an Identity Connector for LDAP in Secure Workload to establish communication with OpenLDAP.

Procedure


Step 1

From the navigation pane, choose Manage > Workloads > Connectors.

Step 2

Click Identity Connector and select Configure your new connector here.

Step 3

On the New Connection page, enter the following details:

Fields

Description

Connector Name

Enter a name for the connector.

Description

Enter a description.

Domain Name

Enter a domain name. The domain name must be unique in the selected scope, for example, csw.com.

Base DN

Enter the Base DN, or Distinguished Name that serves as the starting point for searches within the directory tree. For example, dc=csw, dc=com.

User Filter

Enter a filter to define the criteria for identifying entries that contain certain kinds of information.

Example 1: To identify users, you candistinguish them by having two objectClass attributes—one set to 'person' and another to 'user.' The matching criteria can be (&(objectClass=person)(objectClass=user))

Example 2: To retrieve all the entries that have the objectClass=user and the cn attribute containing the word Marketing, the search filter can be(&(objectClass=user)(cn=*Marketing*))

Username and Password

Enter the credentials to connect to the OpenLDAP server.

CA Certificate

Upload the CA certificate and enter the SSL server name that Secure Workload uses to authenticate. If not, Disable SSL.

Server IP/FQDN and Port

Enter the server IP address and port number.

Secure Connector

Enable if a Secure Connector is used to tunnel connections from Secure Workload to OpenLDAP.

Before you can enable this option, you should have deployed a Secure Connector.

For more information, see Secure Connector.

Step 4

Click Create.

Figure 101. Configure a New Connector

A new Identity Connector is created and the communication is established between Secure Workload and OpenLDAP.


Inventory

After you have established the connection between Secure Workload and OpenLDAP, you can view a list of Users and User Groups in the Inventory tab. All the user groups that a user belongs to are displayed in the Users tab. Only unique user groups are displayed in the User Groups tab.

Procedure


Step 1

Enter the attributes to filter. Hover your cursor over the info icon to view the properties to filter.

Step 2

Click the menu icon to download the data in JSON or CSV format.

Figure 102. Users and User Groups

Note


The recommended limit for the number of users displayed is 300,000, while for user groups, it is 30,000.


Event Log

The Event Log tab displays information, warnings, and errors that occur while establishing the connection with OpenLDAP.

Procedure


Step 1

Enter the attributes to filter. Hover your cursor over the info icon to view the properties to filter.

Step 2

Click the menu icon to download the data in JSON or CSV format.

Figure 103. Event Log

Note


Color codes for the logs are Information (blue), Warning (orange), and Error (red).


Advanced Settings

The Advanced Settings tab displays the schedule for synchronizing the user data and the user attributes.

Procedure


Step 1

Under Synchronize Schedule, you can choose a time frequency at which Secure Workload synchronizes the user data from the LDAP server.

Step 2

In the User Attributes field, enter up to six user attributes to be displayed.

Figure 104. Advanced Settings

Active Directory

Active Directory (AD) is Microsoft's directory service that manages user accounts, permissions, and access to network resources for networks. AD provides several key features that facilitate management and security of networked elements.

Configure Active Directory with Identity Connector

Active Directory (AD) is supported in Secure Workload through an Identity Connector as a source for identity management. The Identity Connector is designed to integrate with AD to authenticate users and manage their access to resources within the Secure Workload environment.

Create an Identity Connector for Active Directory (AD) in Secure Workload to establish communication with AD.

Procedure


Step 1

From the navigation pane, choose Manage > Workloads > Connectors.

Step 2

Choose Identity Connector and click Configure your new connector here.

Step 3

On the New AD Connection page, enter the following details:

Fields

Description

Connector Name

Enter a name for the connector.

Description

Enter a description.

Domain Name

Enter a domain name. The domain name must be unique in the selected scope, for example, csw.com.

Base DN

Enter the Base DN, or Distinguished Name that serves as the starting point for searches within the directory tree. For example, dc=csw, dc=com.

User Filter

Enter a filter to define the criteria for identifying entries that contain certain kinds of information.

Example 1: To identify users, you can distinguish them by having two objectClass attributes—one set to 'person' and another to 'user.' The matching criteria can be (&(objectClass=person)(objectClass=user))

Example 2: To retrieve all the entries that have the objectClass=user and the cn attribute containing the word Marketing, the search filter can be(&(objectClass=user)(cn=*Marketing*))

Username and Password

Enter the credentials to connect to the OpenLDAP server.

CA Certificate

Upload the CA certificate and enter the SSL server name that Secure Workload uses to authenticate. If not, Disable SSL.

Server IP/FQDN and Port

Enter the server IP address and port number.

Does your network require HTTP Proxy to reach IDENTITY?

(Optional) Proxy required for Secure Workload to reach Identity Connector.

If Yes, enter the proxy URL and the port number.

Secure Connector

Enable this option if a Secure Connector is used to establish tunnel connections from Secure Workload. Before you can enable this option, you should have deployed a Secure Connector.

For more information, see Secure Connector.

Step 4

Click Create.

Figure 105. Configure an Active Directory Connector

A new Identity Connector is created and the communication between Secure Workload and Active Directory is established.


Active Directory Inventory

After the connection between Secure Workload and Active Directory (AD) is established, you can view a list of Users and User Groups in the Inventory tab. All the user groups that a user belongs to are displayed in the Users tab. Only unique user groups are displayed in the User Groups tab.

Procedure


Step 1

Under Users and Groups, enter the attributes you want to filter by, and click Search Inventory. Hover your cursor over the info icon to view the attribute properties that you want to filter.

Step 2

Click the menu icon to download the data in JSON or CSV format.

Figure 106. Users and User Groups

Note


The limit for the number of users displayed is 3,00,000, while for user groups, it is 30,000.


Event Log

The Event Log tab displays information, warnings, and errors that occur while establishing the connection with OpenLDAP.

Procedure


Step 1

Enter the attributes to filter. Hover your cursor over the info icon to view the properties to filter.

Step 2

Click the menu icon to download the data in JSON or CSV format.

Figure 107. Event Log

Note


Color codes for the logs are Information (blue), Warning (orange), and Error (red).


Advanced Settings

Procedure


Step 1

Under Synchronize Schedule, you can choose frequency at which Secure Workload synchronizes the user data from the Active Directory server.

Step 2

In the User Attributes field, enter up to fifteen user attributes to be displayed.

Step 3

In the custom User Name Mapping field, map the username to sAMAccountName.

Figure 108. Advanced Settings

Microsoft Entra ID Connector

Microsoft Entra ID (formerly, Azure Active Directory) is a cloud-based identity and access management service that provides authentication and authorization capabilities for users, apps, and services. Microsoft Entra ID is supported on Identity Connector in Secure Workload through the use of Active Directory as a source for identity management.

Add Azure Permissions

For Microsoft Entra ID, you will need to add API permissions for an application. In the Azure portal, perform the following steps:

Procedure


Step 1

From the navigation pane, click Microsoft Entra ID > App Registrations.

Step 2

Open the application you are using for the feature. Choose Manage > API Permissions.

Step 3

Choose Manage > API Permissions.

Step 4

Choose Add Permissions > Microsoft Graph API.

Step 5

In the Application Permissions tab, add the below roles:

API/Permissions Name

Type

Description

Director.Read.All

Application

Read Directory Data

GroupMember.Read.All

Application

Read all group memberships

User.Read.All

Application

Read all users' full profile

AuditLog.Read.All

Application

Read all auditlog data.

Note


This permission is only required if you want to Enable Sign in Logs while configuring the connector.


Configure Microsoft Entra ID

Create an Identity Connector for Microsoft Entra ID in Secure Workload to establish communication with Microsoft Entra ID.

Procedure


Step 1

From the navigation pane, choose Manage > Workloads > Connectors.

Step 2

Click Identity Connector and select Configure your new connector here.

Step 3

On the New Entra ID Connection page, enter the following details:

Fields

Description

Connector Name

Enter a name for the connector.

Description

Enter a description.

Domain Name

Enter a domain name. The domain name must be unique in the selected scope, for example, csw.com.

TenantID

The Application TenantID from the application that you create in Entra ID for this connector.

ClientID

The Director ClientID from the application that you create in Entra ID for this connector.

Client Secret or Client Certificate and Key

For authentication, you can use either a Client Secret or a Client Certificate and Key. Obtain either from the Client credentials link in the application that you created in Entra ID for this connector. If you use a certificate: The certificate should be unencrypted. Only RSA certificates are supported. Private keys can be either PKCS1 or PKCS8.

CA Certificate

Upload the CA certificate and enter the SSL server name that Secure Workload uses to authenticate. If not, Disable SSL.

Does your network require HTTP Proxy to reach IDENTITY?

Check Yes or No depending on if your network requires an HTTP proxy.

Secure Connector

Enable if a Secure Connector is used to tunnel connections from Secure Workload to OpenLDAP.

Before you can enable this option, you should have deployed a Secure Connector.

For more information, see Secure Connector.

Step 4

Click Create.

Figure 109. Configure a New Entra ID Connector
Configuration screen for a new Entra ID Connecto

A new Identity Connector is created and the communication between Secure Workload and Entra ID is established.


Microsoft Entra ID Inventory

After the connection between Secure Workload and Microsoft Entra ID is established, you can view a list of users and user groups in the Inventory tab. All the user groups that a user belongs to are displayed in the Users tab. Only unique user groups are displayed in the User Groups tab.

Procedure


Step 1

Enter the attributes to filter. Hover your cursor over the info icon to view the attribute properties to filter.

Step 2

Click the menu icon to download the data in JSON or CSV format.

Figure 110. Users and User Groups

Note


The limit for the number of users displayed is 300,000, while for user groups, it is 30,000.


Microsoft Entra ID Event Log

The Event Log tab displays information, warnings, and errors that occur while establishing the connection with Microsoft Entra ID.

Procedure


Step 1

Enter the attributes to filter. Hover your cursor over the info icon to view the properties to filter.

Step 2

Click the menu icon to download the data in JSON or CSV format.

Figure 111. Event Log

Note


Color codes for the logs are Information (blue), Warning (orange), and Error (red).


Advanced Settings

Procedure


Step 1

Under Synchronize Schedule, choose the frequency at which Secure Workload synchronizes the user data from the Active Directory.

Step 2

In the User Attributes field, enter up to six user attributes to be displayed.

Step 3

In the custom User Name Mapping field, map the username to displayName.

Figure 112. Advanced Settings

Cisco Secure Firewall Management Center Connector

Combine the power of Secure Workload with the power of Cisco Secure Firewall (formerly known as Cisco Firepower) for a security solution that makes use of:

  • Segmentation

    Firewall-based segmentation is suitable for workloads where software agents are not installed. However, you can also use this method for agent-based workloads. You can easily and broadly apply different sets of policies for traffic entering your network, for traffic exiting your network, and for traffic between workloads within your network.

  • Virtual Patching

    Virtual patching adds Cisco Intrusion Prevention System (IPS) protection to workloads where software agents are installed. You can use virtual patching rules to protect your application from malicious traffic. You can create virtual patching rules by filtering the most critical vulnerabilities in your workloads using Cisco Security Risk Score or CVSS V2 or V3 scores and the corresponding attributes. After virtual patching is configured on Secure Workload, the Common Vulnerabilities and Exposures (CVEs) are published to Cisco Secure Firewall for consideration while creating the IPS policies.

With this integration, Secure Workload automatically enforces and manages segmentation policies on the Secure Firewall Threat Defense (formerly known as Firepower Threat Defense) firewalls managed by the Secure Firewall Management Center instance. Policies are updated dynamically, and the set of workloads to which policies apply is refreshed continually as the application environment changes.

Network inventory is dynamically updated by Secure Workload inventory filters on which your segmentation policies are based; when workloads are added, changed, or removed from your network, Secure Workload automatically updates the Dynamic Objects in the Secure Firewall Management Center on which the corresponding access control rules are based. All enforced policy changes are automatically deployed to managed Secure Firewall Threat Defense (formerly known as Firepower Threat Defense or FTD) devices; you never need to redeploy changes in Secure Firewall Management Center.

For complete information about this integration, including more details about how it works, supported platforms, limitations, setup instructions for both products, and troubleshooting information, see Cisco Secure Workload and Cisco Secure Firewall Management Center Integration Guide.

Cloud-Delivered Firewall Management Center Connector

Definition:

The Cloud-Delivered Firewall Management Center (cdFMC) connector is a cloud-native enhancement to Cisco Secure Workload that

  • integrates with a Cloud-Delivered Firewall Management Center (cdFMC) instance provisioned and managed through Cisco Security Cloud Control (SCC),

  • eliminates the need for manual credential entry, hostname configuration, or Secure Connector deployment because both and cdFMC operate within the same SCC organization, and

  • provides the same flow ingestion and enforcement functionality as the existing Cisco Secure Firewall Connector after onboarding is complete.

Cisco Security Cloud Control (SCC) and cdFMC

Cisco Security Cloud Control (SCC) is Cisco's unified cloud management platform. When both Secure Workload and Cisco Secure Firewall Management Center are subscribed and operational within the SCC organization, Secure Workload can automatically discover and connect to the cdFMC instance without requiring any additional credentials or network tunneling.


Note


The cdFMC connector is available post Cisco Secure Workload Release 4.0.4.17.


How to Configure the cdFMC Connector

Definition:

Because cdFMC and Cisco Secure Workload operate within the same SCC organization, connector setup requires no credential entry or manual network configuration. Secure Workload automatically discovers the cdFMC instance and populates all required connection details.

Reference Info:

  1. From the Cisco Secure Workload navigation pane, choose Manage > Workloads > Connectors.

  2. Click New Connector.

  3. Select cdFMC from the list of available connector types.

  4. Click Create. Secure Workload automatically discovers the cdFMC instance within the same SCC organization and populates all connection details, including hostname and port.

  5. Review the auto-populated configuration and confirm.


Note


A Secure Connector client is not required for the cdFMC Connector. All communication occurs natively within the Cisco Security Cloud.


Note


If the cdFMC instance is not yet provisioned in SCC or its status is not active, the connector creation will fail. Ensure cdFMC is fully provisioned before proceeding. See Prerequisites for the cdFMC Connector.


After the cdFMC Connector is created, the following configurations are available:

  • Log: Configure connector logging settings. For more information, see Log Configuration.

In addition, the listening ports of the connector can be updated on the Docker container in the Secure Workload Ingest appliance using the allowed update-listening-ports command. Provide the connector ID (found on the connector page in the Secure Workload UI), the type of port to update, and the new port information.

Life Cycle Management of Connectors

Connectors can be enabled, deployed, configured, troubleshooted, and deleted from Secure Workload directly.

Enable a Connector

From the navigation pane, choose Manage > Workloads > Connectors, a connector can be selected and enabled. The connector can be deployed on a new virtual appliance (which has to be provisioned first and become Active before a connector can be enabled on it) or an existing virtual appliance. Once the virtual appliance is chosen, Secure Workload sends the rpm package for the connector to the appliance.

When Appliance Controller on the chosen appliance receives the rpm, it does the following:

  1. Construct a Docker image using the rpm package received from Secure Workload. This Docker image includes the configuration required to communicate with Kafka topic on which appliance management messages are sent. This enables the service instantiated from this image to be able to send and receive messages for managing the corresponding connector.

  2. Create a Docker container from the Docker image.

  3. On Secure Workload Ingest appliance, the following additional tasks are performed.

    • A free slot is identified and the corresponding IP address is determined.

    • Connector listening ports (for example, 4729 and 4739 ports on NetFlow connector to receive flow records from NetFlow V9 or IPFIX enabled switches and routers), are exposed to the host on IP corresponding to the chosen slot.

    • A Docker volume is created and added to the container.

  4. The Docker container is started and it executes the connector as a supervisord managed service. The service starts Service Controller as tet-controller which registers with Secure Workload and spawns the actual connector service.

Figure 113. Docker Images
Docker Images
Figure 114. Docker Volumes
Docker Volumes
Figure 115. Docker containers
Docker containers
Figure 116. Slot used by the Docker container and list of exposed ports
Slot used by the Docker container and list of exposed ports
Figure 117. List of ports exposed by Docker container
List of ports exposed by Docker container
Figure 118. Docker Volume mounted to a container
Docker Volume mounted to a container

Service Controller is responsible for the following functions:

  1. Registration: registers the connector with Secure Workload. Until the connector is registered and marked Enabled, no configuration updates can be pushed to the connector. When Secure Workload receives a registration request for a connector, it updates the state of the connector to Enabled.

  2. Configuration updates on connector: tests and applies configuration updates on the connector. For more information, see Configuration Management on Connectors and Virtual Appliances.

  3. Troubleshooting commands on connector: executes allowed commands on the connector service for troubleshooting and debugging issues on the connector service. For more information, see Troubleshooting .

  4. Heartbeats: periodically sends heartbeats and statistics to Secure Workload to report the health of the connector. For more information, see Monitoring a Virtual Appliance .

Viewing Connector-Related Information

Enabled Connectors: To view a list of all enabled connectors, from the navigation pane, choose Manage > Workloads > Connectors.

Connector Details: Click the connector for viewing the details about the connector. This page shows the port bindings, if any, that can be used to configure upstream network elements to send telemetry data to the correct IP and port.

Figure 119. Connector details
Connector details

Deployed Virtual Appliances: A list of deployed virtual appliances can be found at Manage > Workloads > Virtual Appliances.

Figure 120. List of Deployed Virtual Appliances
List of deployed virtual appliances

Virtual Appliance Details A detailed view of an appliance can be fetched by clicking on the appliance directly from List of deployed virtual appliances.

Figure 121. Details of Appliance and Connectors
Appliance details and the connectors

Deleting a Connector

When a connector is deleted, Appliance Controller on the appliance where the connector is enabled will receive a message to remove the services created for the connector. Appliance Controller does the following:

  1. Stop the Docker container corresponding to the connector.

  2. Remove the Docker container.

  3. If the connector is deployed on a Secure Workload Ingest appliance and it exposes ports, then remove the Docker volume that was mounted to the container.

  4. Remove the Docker image that was created for the connector.

  5. Finally, send a message back to Secure Workload indicating the status of the delete request.

Monitoring a Connector

Connector services periodically send heartbeats and statistics to Secure Workload. The heartbeat interval is 5 minutes. The heartbeat messages include statistics about the health of the service include system statistics, process statistics, and statistics about how many messages sent/received/error-ed over the Kafka topic that is used for the appliance management. In addition, it includes statistics exported by the connector service itself.

All metrics are available in Digger (OpenTSDB) and are annotated with appliance ID, connector ID, and root scope name. Additionally, Grafana dashboards for connector services are also available for important metrics from the service.

Troubleshooting

Connectors and virtual appliances support various troubleshooting mechanisms to debug possible issues.


Note


This section does not apply to the following:

ERSPAN virtual appliance: Refer to the ERSPAN appliance page for the troubleshooting details.

Cloud connectors: To troubleshoot cloud connectors, see the section for your cloud connector, for example Troubleshoot AWS Connector Issues.


Allowed set of commands

The allowed set of commands enables you to run some debug commands on the appliances and Docker containers (for connectors). Allowed commands include the ability to retrieve logs and current running configuration, test network connectivity, and capture packets matching a specified port.

Figure 122. Troubleshoot page on Secure Workload virtual appliance
Troubleshoot page on Secure Workload virtual appliance

Note


Troubleshooting using the allowed set of commands is available on the appliances and connectors only for users with the Customer Support role.


Show Logs

Show the contents of a controller log file and optionally grep the file for a specified pattern. Secure Workload sends the command to appliance/connector where the command was issued. The controller on the appliance/connector service returns the result (tailed for the last 5000 lines). When the result is available at Secure Workload, a download button is presented to download the file.

Argument Name

Type

Description

Grep Pattern

string

Pattern string to grep from the logfile

Allowed Secure Workload virtual appliances: All

Allowed connectors: NetFlow, NetScaler, F5, AnyConnect, Syslog, Email, Slack, PagerDuty, Kinesis, ISE, ASA, and Meraki.

Figure 123. Download Show Logs output from Secure Workload Ingest appliance
Download Show Logs output from Secure Workload Ingest appliance

Show Service Logs

Show the contents of service log files and optionally grep the file for a specified pattern. Secure Workload sends the command to appliance/connector where the command was issued. The controller on the appliance/connector service returns the result (tailed for the last 5000 lines). When the result is available at Secure Workload, a download button is presented to download the file.

Argument Name

Type

Description

Log File

dropdown

The name of the logfile to collect

  • Service log

Logs of the connector service

  • Upgrade log

Upgrade logs of the service

  • LDAP loader log

Logs of the LDAP snapshot for connectors that have LDAP enabled

Grep Pattern

string

Pattern string to grep from the logfile

Allowed Secure Workload virtual appliances: None (only available on valid connector services)

Allowed connectors: NetFlow, NetScaler, F5, AnyConnect, Syslog, Email, Slack, PagerDuty, Kinesis, ISE, ASA, and Meraki.

Figure 124. Download Show Service Logs output from AnyConnect connector for LDAP loader log log file
Download Show Service Logs output from AnyConnect connector for LDAP loader log log file

Show Running Configuration

Show running configuration of an appliance/connector controllers. The controller on appliance/connector retrieves the configuration corresponding to the requested argument and returns the result. When the result is available at Secure Workload, the contents of the configuration are shown in a text box.

Argument Name

Type

Description

Configuration Type

dropdown

Configuration file to collect

  • Controller conf

Configuration file of the appliance controller

  • Supervisor conf

Configuration file of the supervisor that runs the controller

  • NTP conf

NTP configuration file

  • Chrony conf

/etc/chrony.conf

Allowed Secure Workload virtual appliances: All

Allowed connectors: NetFlow, NetScaler, F5, AnyConnect, Syslog, Email, Slack, PagerDuty, Kinesis, ISE, ASA, and Meraki.

Figure 125. Show running configuration for NTP conf on a Secure Workload Ingest Appliance
Show running configuration for NTP conf on a Secure Workload Ingest Appliance

Show Service Running Configuration

Show running configuration of an services instantiated for connectors on the appliances. The controller on the service retrieves the configuration corresponding to the requested argument and returns the result. When the result is available at Secure Workload, the contents of the configuration are shown in a text box.

Argument Name

Type

Description

Configuration Type

dropdown

Configuration file to collect.

  • Controller conf

Configuration file of the service controller.

  • Supervisor conf

Configuration file of the supervisor that runs the controller.

  • Service conf

Service configuration file.

  • LDAP conf

LDAP configuration for connectors that have LDAP enabled.

Allowed Secure Workload virtual appliances: None (only available on valid connector services)

Allowed connectors: NetFlow, NetScaler, F5, AnyConnect, Syslog, Email, Slack, PagerDuty, Kinesis, ISE, ASA, and Meraki.

Show System Commands

Execute a system command and optionally grep for a specified pattern. The controller on the appliance/connector service returns the result (tailed for the last 5000 lines). Optionally, a grep pattern can be provided as argument and the output is filtered accordingly. When the result is available at Secure Workload, the result is shown in a text box.

Argument Name

Type

Description

System Command

dropdown

System command to execute

  • IP configuration

ifconfig
  • IP route configuration

ip route
  • IP packet filtering rules

iptables -L
  • Network status

netstat
  • Network status (EL9)

ss
  • Process status

ps -aux
  • List of top processes

top -b -n 1
  • NTP status

ntpstat
  • Chrony status (EL9)

chronyc tracking
  • Chrony query (EL9)

chronyc sources
  • CPU info

lscpu
  • Memory info

lsmem
  • Disk free

df -H

Grep Pattern

string

Pattern string to grep from the output

Allowed Secure Workload virtual appliances: All

Allowed connectors: NetFlow, NetScaler, F5, AnyConnect, Syslog, Email, Slack, PagerDuty, Kinesis, ISE, ASA, and Meraki.

Figure 126. Show system command on Secure Workload Ingest appliance to retrieve list of top processes
Show system command on Secure Workload Ingest appliance to retrieve list of top processes

Show Docker Commands

Execute a Docker command and optionally grep for a specified pattern. The command is executed on the appliance by the appliance controller. The result tailed for the last 5000 lines. Optionally, a grep pattern can be provided as argument and the output is filtered accordingly. When the result is available at Secure Workload, the result is shown in a text box.

Argument Name

Type

Description

Docker Command

dropdown

Docker command to execute

  • Docker info

docker info
  • List images

docker images --no-trunc
  • List containers

docker ps --no-trunc
  • List networks

docker network ls --no-trunc
  • List volumes

docker volume ls
  • Container stats

docker stats --no-trunc--no-stream
  • Docker disk usage


docker system df -v
  • Docker system events

docker system events --since '10m'
  • Version

docker version

Grep Pattern

string

Pattern string to grep from the output

Allowed Secure Workload virtual appliances: All

Allowed connectors: None
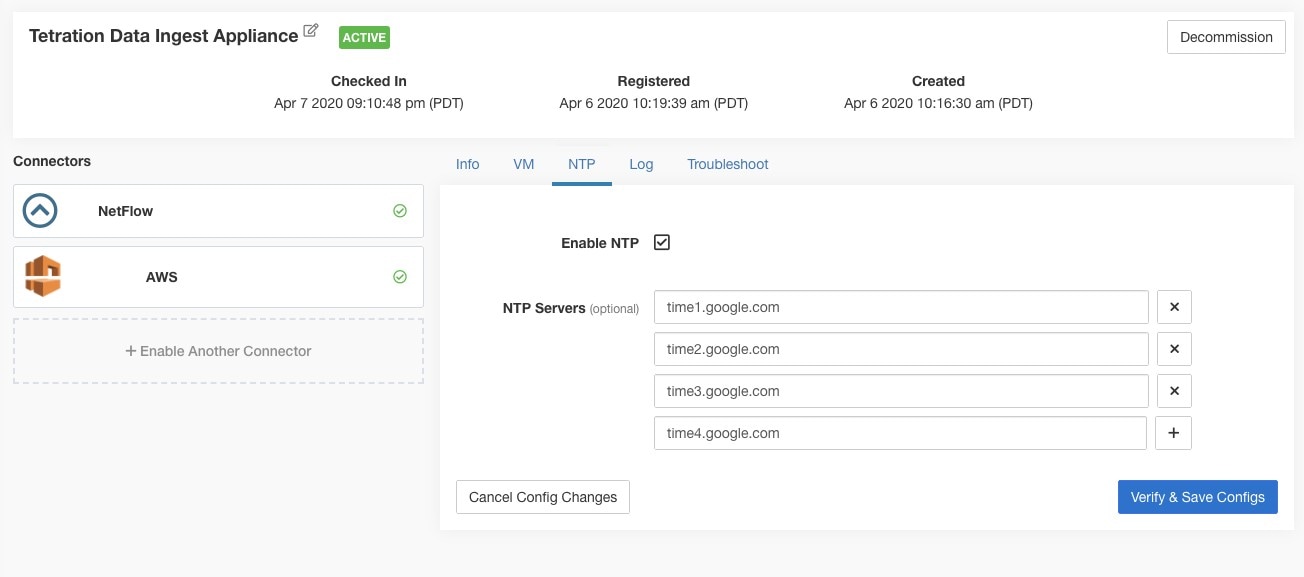
Figure 127. Execute a docker command on Secure Workload Ingest appliance to show container stats
Execute a docker command on Secure Workload Ingest appliance to show container stats

Show Docker Instance Commands

Execute a docker command on a specific instance of a Docker resource. The instance ID can be fetched using Show Docker Commands. The command is executed on the appliance by the appliance controller. The result tailed for the last 5000 lines. Optionally, a grep pattern can be provided as argument and the output is filtered accordingly. When the result is available at Secure Workload, the result is shown in a text box.

Argument Name

Type

Description

Docker Command

dropdown

Docker command to execute

  • Image info

docker images --no-trunc <instance>
  • Network info

docker network inspect <instance>
  • Volume info

docker volume inspect <instance>
  • Container info

docker container inspect--size <instance>
  • Container logs

docker logs --tail 5000 <instance>
  • Container port mappings

docker port <instance>
  • Container resource usage stats

docker stats --no-trunc--no-stream <instance>
  • Container running processes

docker top <instance>

Instance

string

Docker resource (image, network, volume,

container) ID (See Show Docker Commands)

Grep Pattern

string

Pattern string to grep from the output

Allowed Secure Workload virtual appliances: All

Allowed connectors: None
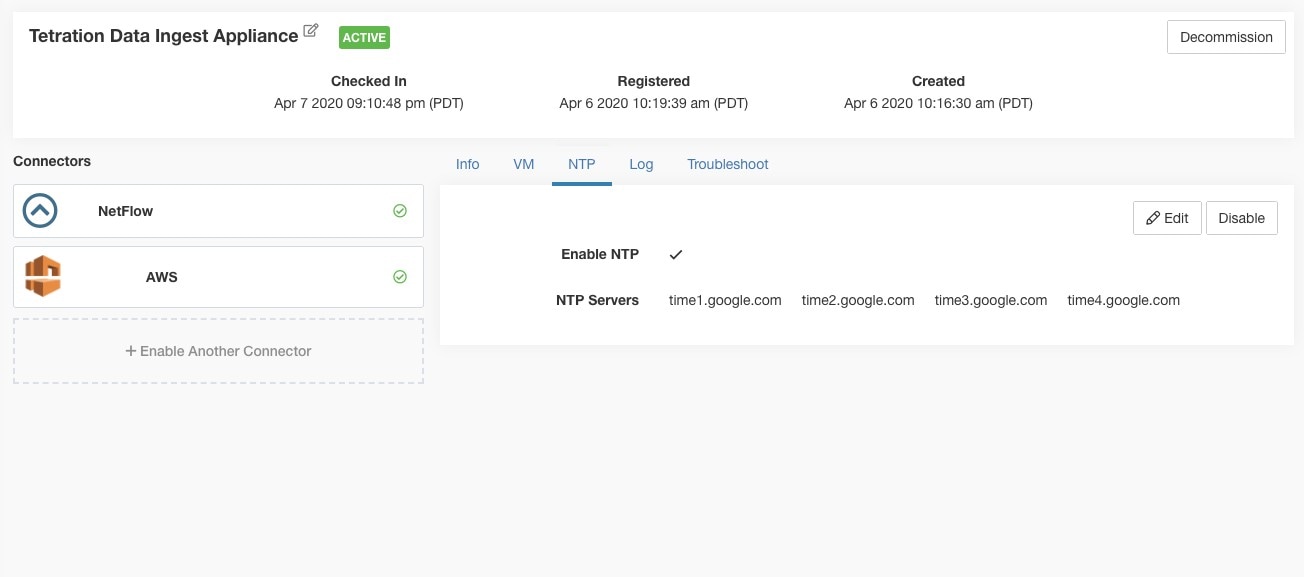
Figure 128. Execute a docker instance command on Secure Workload Ingest appliance to retrieve container info
Execute a docker instance command on Secure Workload Ingest appliance to retrieve container info

Show Supervisor Commands

Execute a supervisorctl command and return the result. Secure Workload sends the command to appliance/connector where the command was issued. The controller on the appliance/connector service returns the result When the result is available at Secure Workload, the result is shown in a text box.

Argument Name

Type

Description

SupervisorCtl Command

dropdown

supervisorctl command to execute

  • Status of all services

supervisorctl status
  • PID of supervisor

supervisorctl pid
  • PID of all services

supervisorctl pid all

Allowed Secure Workload virtual appliances: All

Allowed connectors: NetFlow, NetScaler, F5, AnyConnect, Syslog, Email, Slack, PagerDuty, Kinesis, ISE, ASA, and Meraki.

Figure 129. Execute supervisorctl command on NetFlow connector to get the status of all services
Execute supervisorctl command on NetFlow connector to get the status of all services

Show Supervisor Service Commands

Execute a supervisorctl command on a specific service. The service name can be fetched using Show Supervisor Commands. Secure Workload sends the command to appliance/connector where the command was issued. The controller on the appliance/connector service returns the result. When the result is available at Secure Workload, the result is shown in a text box.

Argument Name

Type

Description

SupervisorCtl Command

dropdown

supervisorctl command to execute

  • Status of a service

supervisorctl status <service name>
  • PID of a service

supervisorctl pid <service name>

Service name

string

Name of the supervisor controlled service (see Show Supervisor Commands)

Figure 130. Execute supervisorctl command on NetFlow connector to get the status of specified service name
Execute supervisorctl command on NetFlow connector to get the status of specified service name

Allowed Secure Workload virtual appliances: All

Allowed connectors: NetFlow, NetScaler, F5, AnyConnect, Syslog, Email, Slack, PagerDuty, Kinesis, ISE, ASA, and Meraki.

Network Connectivity Commands

Test network connectivity from the appliance/connector. The command is executed on the appliance by the appliance controller. When the result is available at Secure Workload, the result is shown in a text box.

Argument Name

Type

Description

Network Command

dropdown

Network connectivity command to execute

  • ping

ping -c 5 <destination>
  • curl

curl -I <destination>

Destination

string

Destination to use for the test

Allowed Secure Workload virtual appliances: All

Allowed connectors: NetFlow, NetScaler, F5, AnyConnect, Syslog, Email, Slack, PagerDuty, Kinesis, ISE, ASA, and Meraki.

Figure 131. Test network connectivity on F5 connector by running a curl
Test network connectivity on F5 connector by running a curl

List Files

List the files in well known locations of the appliance. Optionally, grep for a specified pattern. Secure Workload sends the command to appliance where the command was issued. The controller on the appliance returns the result. When the result is available at Secure Workload, the result is shown in a text box.

Argument Name

Type

Description

Location

dropdown

List files in a target location

  • Controller configuration folder

List the contents in the folder where controller configuration files are kept.

  • Controller cert folder

List the contents in the folder where controller certs are kept.

  • Log folder

List the contents in the folder where log files are present.

Grep Pattern

string

Pattern string to grep from the output

Allowed Secure Workload virtual appliances: All

Allowed connectors: None

Figure 132. List the files in log folder in Secure Workload Ingest appliance
List the files in log folder in Secure Workload Ingest appliance

List Service Files

List the files in well known locations of the connector service. Optionally, grep for a specified pattern. Secure Workload sends the command to connector where the command was issued. The controller on the connector service returns the result. When the result is available at Secure Workload, the result is shown in a text box.

Argument Name

Type

Description

Location

dropdown

List files in a target location.

  • Service configuration folder

List the contents in the folder where service configuration files are kept.

  • Service cert folder

List the contents in the folder where service certs are kept.

  • Log folder

List the contents in the folder where log files are present.

  • DB folder

List the contents in the folder where state of endpoints (esp. for AnyConnect and ISE connectors) are kept.

Grep Pattern

string

Pattern string to grep from the output

Allowed Secure Workload virtual appliances: None

Allowed connectors: NetFlow, NetScaler, F5, AnyConnect, Syslog, Email, Slack, PagerDuty, Kinesis, ISE, ASA, and Meraki.

Figure 133. List the files in configuration folder of F5 connector in Secure Workload Ingest appliance
List the files in configuration folder of F5 connector in Secure Workload Ingest appliance

Packet Capture

Capture incoming packets on an appliance/connector. Secure Workload sends the command to the appliance/connector where the command was issued. The controller on the appliance/connector service captures packets, encodes them and returns the result to Secure Workload. When the result is available at Secure Workload, a download button is presented to download the file in .pcap format.

Argument Name

Type

Description

Listening port

number

Capture packets that are sent/received on this port

Max packets to collect

number

Maximum packets to collect before returning the result. Should be <1000

Max collection duration in seconds

number

Maximum duration to collect before return the result. Should be <600 seconds.

Allowed Secure Workload virtual appliances: All

Allowed connectors: NetFlow, NetScaler, F5, AnyConnect, Syslog, Email, Slack, PagerDuty, Kinesis, ISE, ASA, and Meraki.

Figure 134. Capture packets on a given port on NetFlow connector
Capture packets on a given port on NetFlow connector

Update Listening Ports of Connectors

Update the listening port on a connector in Secure Workload Ingest appliance. Secure Workload sends the command to the appliance controller on the appliance where the command is issued. The controller does the following actions:

  • Stops the Docker service corresponding to the connector.

  • Collect the current running configuration of the service.

  • Remove the Docker service.

  • Update the running configuration of the service to use the new ports.

  • Start a new container from the same Docker image that was used in the removed container with new exposed ports. Also, if a Docker volume was mounted to the removed container earlier, the same volume is mounted to the new container.

  • Return the new IP bindings of the connector to Secure Workload.

  • Secure Workload shows the result in a text box.

Argument Name

Type

Description

Connector ID

string

Connector ID of the connector for which listening ports need to be updated

Listening port label

dropdown

The type of port that is updated.

NET-FLOW9

NetFlow v9 listening port

IPFIX

IPFIX listening port

Listening port

string

New port for the connector

Allowed Secure Workload virtual appliances: Secure Workload Ingest

Allowed connectorsNone

Figure 135. Update listening port on Meraki connector to 2055 in Secure Workload Ingest appliance
Update listening port on Meraki connector to 2055 in Secure Workload Ingest appliance
Figure 136. Retrieve the port mappings on Meraki connector in Secure Workload Ingest appliance
Retrieve the port mappings on Meraki connector in Secure Workload Ingest appliance

Update Alert Notifier Connector Log Configuration

Update log configuration for Secure Workload Alert Notifier (TAN) service that hosts Syslog, Email, Slack, PagerDuty, and Kinesis alert notifier connectors. Since TAN hosts multiple connectors, log configuration cannot be updated from connector page directly. This allowed command allows the user to update the log configuration.
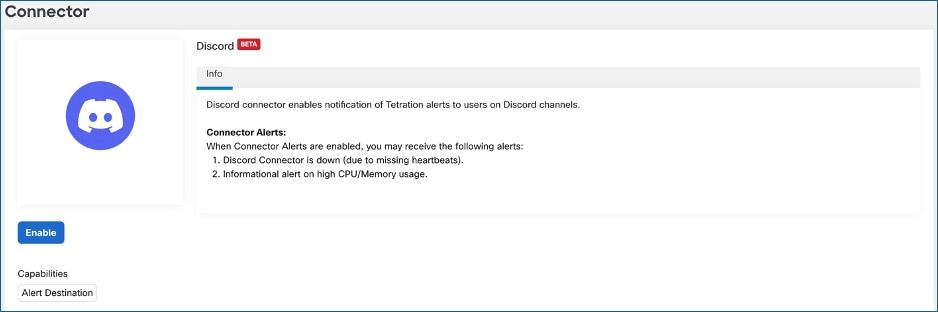
Secure Workload sends the command to the service controller on TAN Docker service of Secure Workload Edge appliance. The controller applies the configuration on the service and returns the status of the configuration update.

Argument Name

Type

Description

Logging level

dropdown

Logging level to be used by the service

  • debug

Debug log level

  • info

Informational log level

  • warn

Warning log level

  • error

Error log level

Max log file size (in MB)

number

Maximum size of a log file before log rotation kicks in

Log rotation (in days)

number

Maximum age of a log file before log rotation kicks in

Log rotation (in instances)

number

Maximum instances of log files kept

Allowed Secure Workload virtual appliances:Secure Workload Edge

Allowed connectors:None

Figure 137. Update the log configuration on Secure Workload Alert Notifier Docker service in Secure Workload Edge appliance
Update the log configuration on Secure Workload Alert Notifier Docker service in Secure Workload Edge appliance

Collect Snapshot From Appliance

Secure Workload sends the command to the appliance where the command was issued. When the controller on the appliance receives this command from Secure Workload, it collects appliance snapshot, encodes them and returns the result to Secure Workload. When the result is available at Secure Workload, a download button is presented to download the file in .tar.gz format.

Files included in the snapshot:

  • /local/tetration/appliance/appliance.conf

  • /local/tetration/{logs, sqlite, user.cfg}

  • /opt/tetration/tet_vm_setup/conf/tet-vm-setup.conf

  • /opt/tetration/tet_vm_setup/docker/Dockerfile

  • /opt/tetration/ova/version

  • /usr/local/tet-controller/conf

  • /usr/local/tet-controller/cert/{topic.txt, kafkaBrokerIps.txt}

  • /var/run/supervisord.pid

  • /etc/resolv.conf

Command outputs included in the snapshot:

  • ps aux

  • iptables -L

  • netstat {-nat, -rn, -suna, -stna, -tunlp}

  • ss {-nat, -rn, -suna, -stna, -tunlp}

  • /usr/local/tet-controller/tet-controller -version

  • supervisorctl status

  • rpm -qi tet-nic-driver tet-controller

  • du -shc /local/tetration/logs

  • ls {/usr/local/tet-controller/cert/, -l /local/tetration/sqlite/, -l /opt/tetration/tet_vm_setup/.tet_vm.done, -l/opt/tetration/tet_vm_setup/templates/}

  • docker {images, ps -a}

  • blkid/ifconfig/lscpu/uptime

  • free -m

  • df -h

Argument Name

Type

Description

Max time for collection in minutes

number

Maximum duration to collect before returning the results. Should be <20 minutes.

Allowed Secure Workload virtual appliances : Secure Workload Ingest and Secure Workload Edge

Figure 138. Collect snapshot from Secure Workload appliance
Collect snapshot from Secure Workload appliance

Collect Snapshot From Connector

Secure Workload sends the command to the appliance where the connector is deployed. According to connector ID, the controller collects connector snapshot, encodes them and returns the result to Secure Workload. When the result is available at Secure Workload, a download button is presented to download the file in .tar.gz format.

Files included in the snapshot:

  • /usr/local/tet-netflow/conf

  • /local/tetration/{logs, sqlite}

  • /var/run/{supervisord.pid, tet-netflow.pid}

Command outputs included in the snapshot:

  • ps aux

  • netstat {-nat, -rn, -suna, -stna, -tunlp}

  • ss {-nat, -rn, -suna, -stna, -tunlp}

Argument Name

Type

Description

Connector ID

string

Connector ID of the connector for which the snapshot command is run.

Capture packets

check-box

Should packets be captured?

Max time for collection in

minutes

number

Maximum duration to collect before returning the results. Should be < 20 minutes.

Allowed Secure Workload virtual appliances: Secure Workload Ingest and Secure Workload Edge

Figure 139. Collect snapshot from Secure Workload connector on designated connector ID
Collect snapshot from Secure Workload connector on designated connector ID

Collect Controller Profile

Collect controller process profiling result on appliance or connectors. Secure Workload sends the command to the connector where the command was issued. The service controller restarts the connector service in the specified profiling mode. After collecting the profiling result, service controller restarts the service in normal mode and send the result to Secure Workload. When the result is available at Secure Workload, a download button is presented to download the file in .tar.gz format.

Argument Name

Type

Description

Profile Mode

dropdown

Profiling mode.

  • memory

Memory profiling mode.

  • cpu

CPU profiling mode.

  • block

Block profiling mode.

  • mutex

Mutex profiling mode.

  • goroutine

Goroutine profiling mode.

Maximum time for collection (in minutes)

number

Maximum duration to collect before returning the result.

Memory profile rate (only valid when choosing “memory” mode)

number

Memory profiling rate. This field is optional. If not provided, default value in Golang will be used.

Allowed Secure Workload virtual appliances: Secure Workload Ingest and Secure Workload Edge

Allowed connectors: NetFlow, NetScaler, F5, AnyConnect, Syslog, Email, Slack, PagerDuty, Kinesis, ISE, and Meraki.

Figure 140. Collect controller profile from Secure Workload appliance
Collect controller profile from Secure Workload appliance

Collect Connector Profile

Collect connector process profiling result on connectors. Secure Workload sends the command to the connector where the command was issued. The service controller restart the connector service in the specified profiling mode. After collecting the profiling result, service controller restart the service in normal mode and send the result to Secure Workload. When the result is available at Secure Workload, a download button is presented to download the file in .tar.gz format.

Argument Name

Type

Description

Profile Mode

dropdown

Profiling mode.

  • memory

Memory profiling mode.

  • cpu

CPU profiling mode.

  • block

Block profiling mode.

  • mutex

Mutex profiling mode.

  • goroutine

Goroutine profiling mode.

Maximum time for collection (in minutes)

number

Maximum duration to collect before returning the result.

Memory profile rate (only valid when choosing “memory” mode)

number

Memory profiling rate. This field is optional. If not provided, default value in Golang will be used.

Allowed Secure Workload virtual appliances: Secure Workload Ingest and Secure Workload Edge

Allowed connectors: NetFlow, NetScaler, F5, AnyConnect, Syslog, Email, Slack, PagerDuty, Kinesis, ISE, and Meraki.

Figure 141. Collect connector profile from Secure Workload connector
Collect connector profile from Secure Workload connector

Override connector alert interval for Appliance

Override default connector alert interval for appliance. Secure Workload restricts same connector alert to send only once a day in default. This command is for administrator to override interval when they think once a day is too long. When the result is available at Secure Workload, the result is shown in a text box.

Argument Name

Type

Description

Alert Type

dropdown

The connector alert type to override.

  • Check-in missed

Miss appliance’s check-in.

  • CPU usage

High CPU usage.

  • Memory usage

High memory usage.

  • Disk usage

High disk usage.

Interval (in minutes)

number

Duration to override interval in minutes.

Allowed Secure Workload virtual appliances: Secure Workload Ingest and Secure Workload Edge

Allowed connectors: None

Figure 142. Override connector alert interval for Secure Workload appliance
Override connector alert interval for Secure Workload appliance

Override connector alert interval for Connector

Override default connector alert interval for connector. Secure Workload restricts same connector alert to send only once a day in default. This command is for administrator to override interval when they think once a day is too long. When the result is available at Secure Workload, the result is shown in a text box.

Argument Name

Type

Description

Alert Type

dropdown

The connector alert type to override.

  • Check-in missed

Miss connector’s check-in.

Interval (in minutes)

number

Duration to override interval in minutes.

Allowed Secure Workload virtual appliances: None

Allowed connectors: NetFlow, NetScaler, F5, AnyConnect, Syslog, Email, Slack, PagerDuty, Kinesis, ISE, ASA, Meraki, ServiceNow, WAD.

Figure 143. Override connector alert interval for Secure Workload connector
Override connector alert interval for Secure Workload connector

Hawkeye Dashboards

Hawkeye dashboards provide insights about health of the connectors and virtual appliances where the connectors are enabled.

Appliance Controller Dashboard

Appliance controller dashboard provides information about network statistics, system metrics such as CPU usage percentage, memory usage percentage, disk usage percentage, and number of open file descriptors.

Figure 144. Appliance controller dashboard
Appliance controller dashboard

Service Dashboard

Service dashboard provides information about export metrics -if applicable- including number of flow observations exported to Secure Workload, number of packets exported to Secure Workload, and number of bytes exported to Secure Workload. In addition, this dashboard also provides information about protocol processing and decoding (for example, services that process NetFlow v9, and IPFIX). Metrics such as decoded count, decoded error count, flow count, packet count, and byte count are available in this dashboard. Furthermore, system metrics for the Docker container where the service is running are also included in this dashboard. Metrics such as CPU usage percentage, memory usage percentage, disk usage percentage, and number of open file descriptors are part of this dashboard.

Figure 145. Service dashboard
Service dashboard

AnyConnect Service Dashboard

AnyConnect service dashboard provides information about AnyConnect specific service information. Metrics such as number of endpoints, number of inventories, number of users reported by AnyConnect connector to Secure Workload are available in this dashboard. In addition, this dashboard also provides information about IPFIX protocol processing and decoding. Metrics such as decoded count, decoded error count, flow count, packet count, and byte count are available in this dashboard.
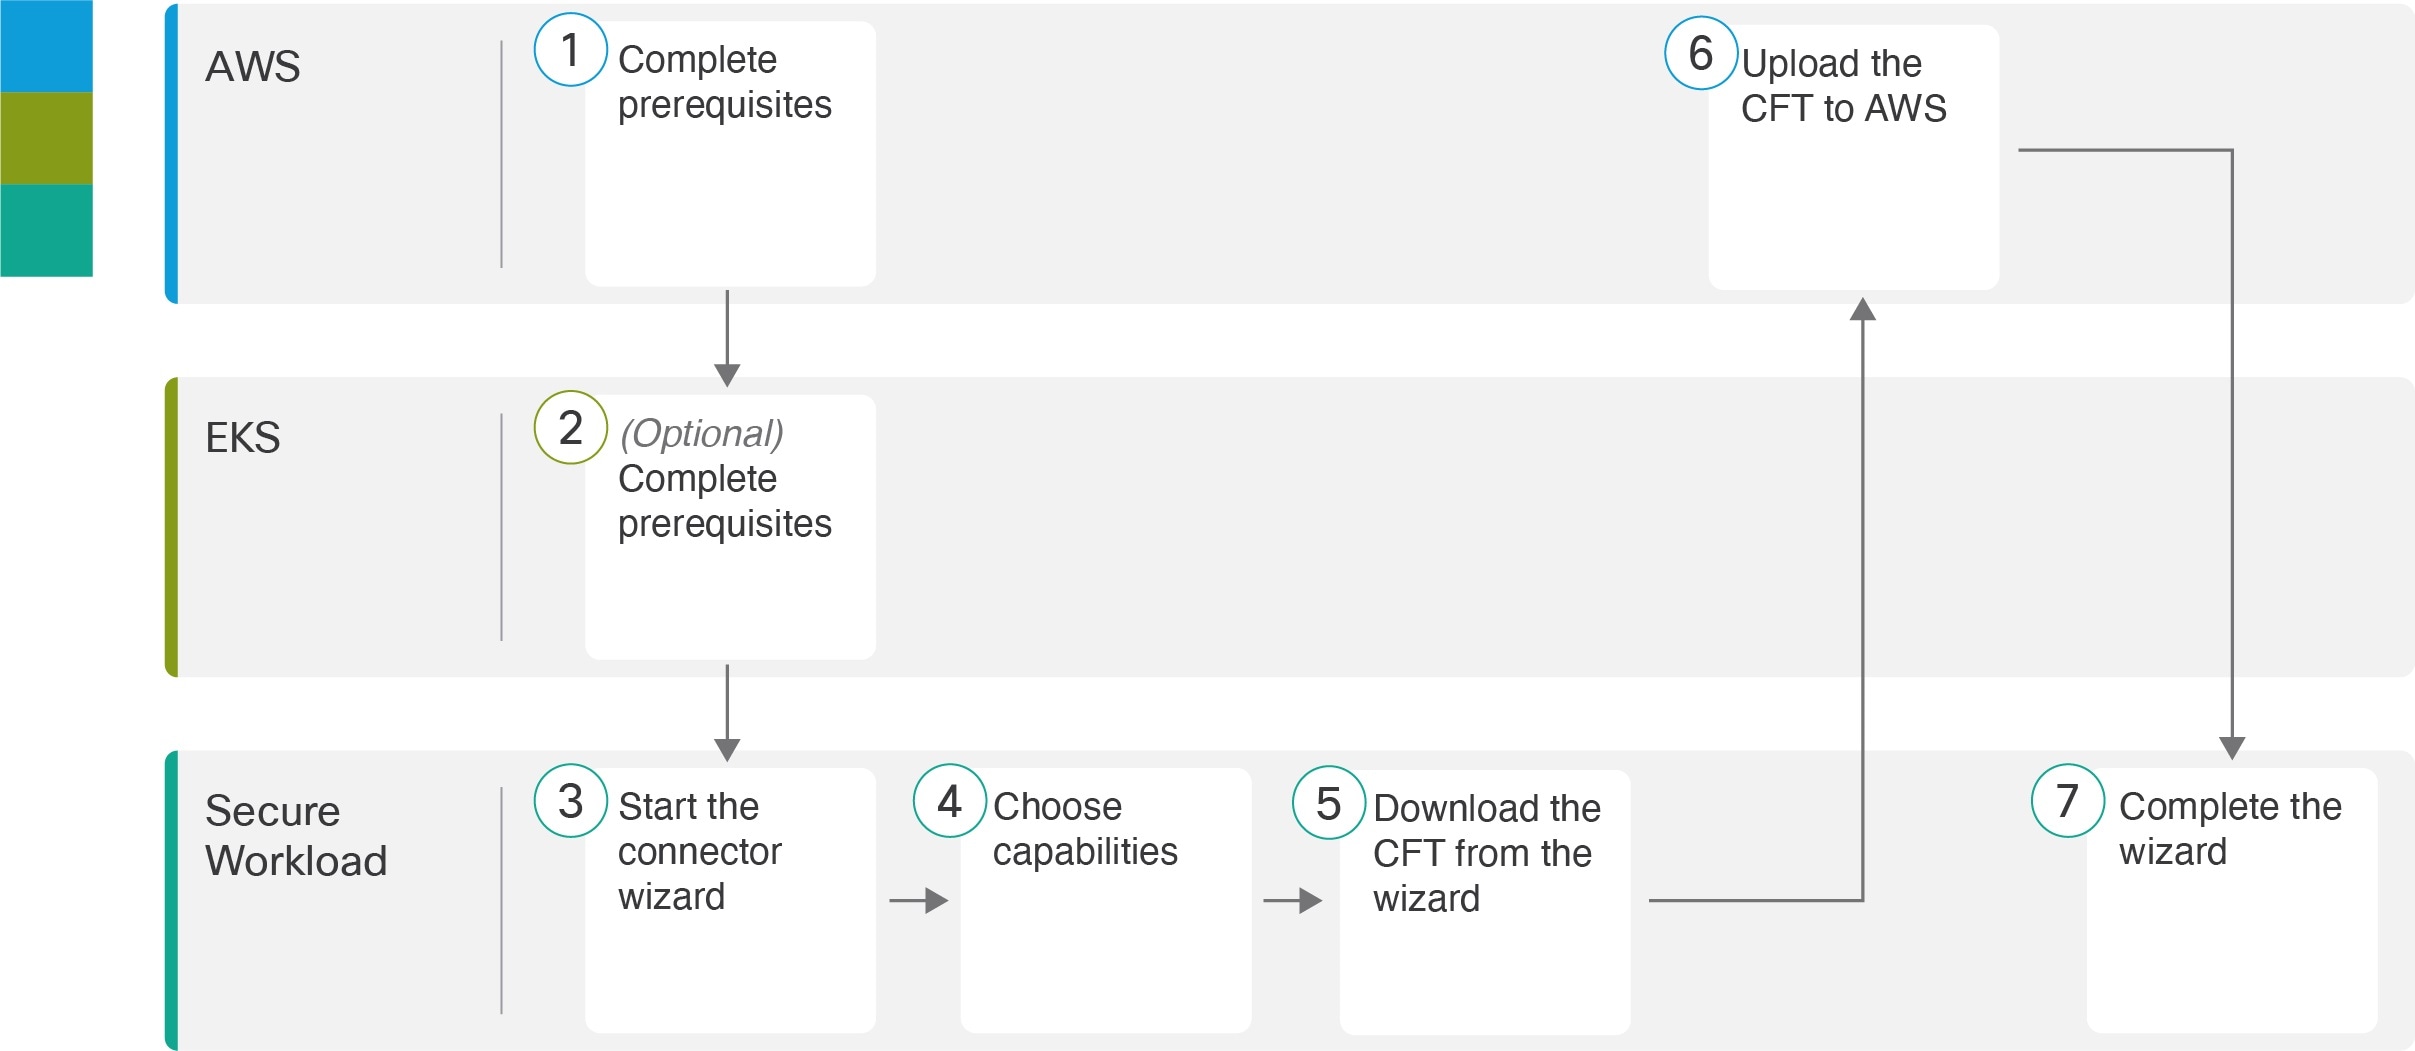
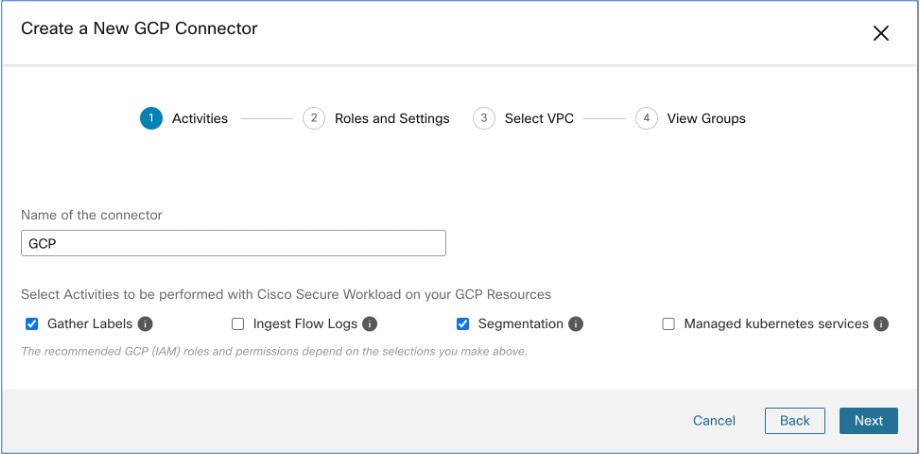
Figure 146. AnyConnect dashboard
AnyConnect dashboard

Appliance and Service DIO Dashboard

Appliance and service DIO dashboard provides information about number of messages exchanged in the Kafka topic on which the appliance manager and appliance/service controllers communicate. Metrics such as number of messages received, number of messages sent, number of messages failed are included in this dashboard. In addition, the last offset read by the controllers are also provided to understand whether the controller is lagging behind in processing the control messages from the manager.

Figure 147. Appliance and service DIO dashboard
Appliance and service DIO dashboard

General Troubleshooting Guidelines

Once a connector show in active state in connectors page in Secure Workload, no action is needed on the appliance where the connector is enabled; user does not need to log into it. If that is not happening, following information helps to troubleshoot such problems.

In normal conditions, on the appliance:

  • systemctl status tet_vm_setup.service reports an inactive service with SUCCESS exit status.

  • systemctl status tet-nic-driver reports an active service.

  • supervisorctl status tet-controller reports RUNNING service. This indicates that the appliance controller is up and running.

  • docker network ls reports three networks: bridge, host, and none.

  • docker ps reports the containers that are running on the appliance. Typically, when a connector is enabled successfully on an appliance, a Docker container is instantiated on the appliance. For Syslog, Email, Slack, PagerDuty and Kinesis connectors, a Secure Workload alert notifier service is instantiated as a Docker container on Secure Workload edge appliance.

  • docker logs <cid> for each container should report that tet-netflowsensor entered RUNNING state.

  • docker exec <cid> ifconfig reports only one interface, besides the loopback.

  • docker exec <cid> netstat -rn reports the default gateway.

  • cat /local/tetration/appliance/appliance.conf on the appliance to see the list of Docker services running on the appliance. It includes details about service ID, connector ID, container, image ID and port mappings (if applicable). On a Secure Workload Ingest appliance, at most three services be running on the appliance. The port mappings and Docker volumes that are mounted on the containers are available in this file.

Figure 148. Secure Workload appliance deployment service and status
Secure Workload appliance deployment service and status
Figure 149. Secure Workload network driver service status
Secure Workload network driver service status
Figure 150. Appliance controller status
Appliance controller status

If any of the preceding doesn’t hold true, check the deployment script logs in /local/tetration/logs for the reason why the appliance and/or the connector deployment failed.

You can troubleshoot any other connector registration/connectivity issues as follows.

docker exec <cid> ps -ef reports tet-netflowsensor-engine, /usr/local/tet/ tet-netflowsensor -config /usr/local/tet-netflow/conf/tet-netflow.conf instances, along with the process manager /usr/bin/supervisord -c /usr/local/tet-netflow/ conf/supervisord.conf -n instance.

Figure 151. Running processes on Secure Firewall ASA connector in Secure Workload Ingest appliance
Running processes on Secure Firewall ASA connector in Secure Workload Ingest appliance

Log Files

The following commands can be used to view the logs from various services on the appliance.

  • /local/tetration/logs/tet-controller.log shows the logs of the appliance controller.

  • docker exec <cid> cat /local/tetration/logs/tet-controller.log shows the logs of the service controller on the connector.

  • docker exec <cid> cat /local/tetration/logs/tet-netflow.log shows the logs of the connector service.

  • docker exec <cid> cat /local/tetration/logs/tet-ldap-loader.log shows the logs of LDAP snapshot creation (if LDAP config is applicable for the connector).

  • docker exec <cid> cat /local/tetration/logs/check_conf_update.log shows the configuration update polling logs (for connectors on the Ingest appliance).


Note


There are allowed set of commands on Secure Workload that can pull these logs from the appliance and/or connectors directly. For more information, see Allowed set of commands .


Debug Mode

The default logging level for the appliance/service controller and connector service is set to info level. For troubleshooting issues, we may need to set the agent in debug mode. To do this, update the log configuration on the appliance/connector on Secure Workload directly for the desired appliance/connector. The log levels for both the controller and services are updated if the configuration is updated on the connector. For more information, see Log Configuration .