Global Visualization of Network Traffic Flows

In today’s complex and challenging networking world, securing the network is crucial for any organization. To address the challenges of visibility into network and data traffic, Global Visualization feature provides comprehensive visibility into the intricate details of connections, patterns, and relationships within a network.


Attention


Due to recent GUI updates, some of the images or screenshots used in the user guide may not fully reflect the current design of the product. We recommend using this guide in conjunction with the latest version of the software for the most accurate visual reference.


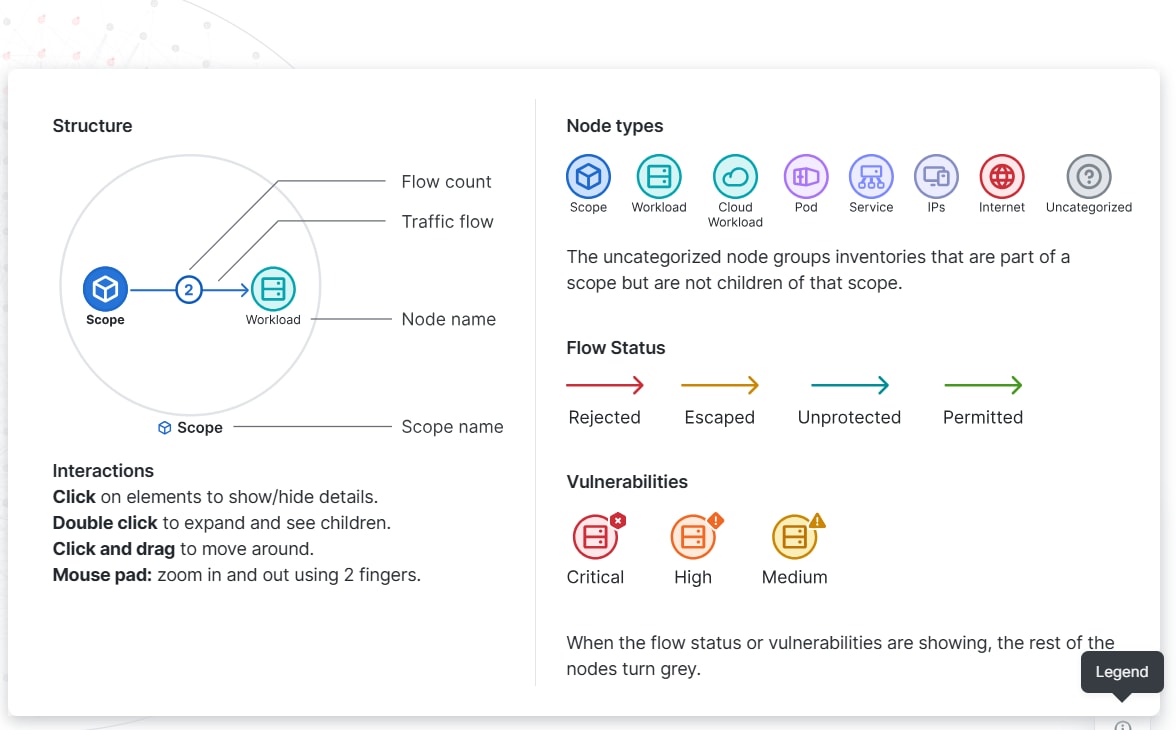
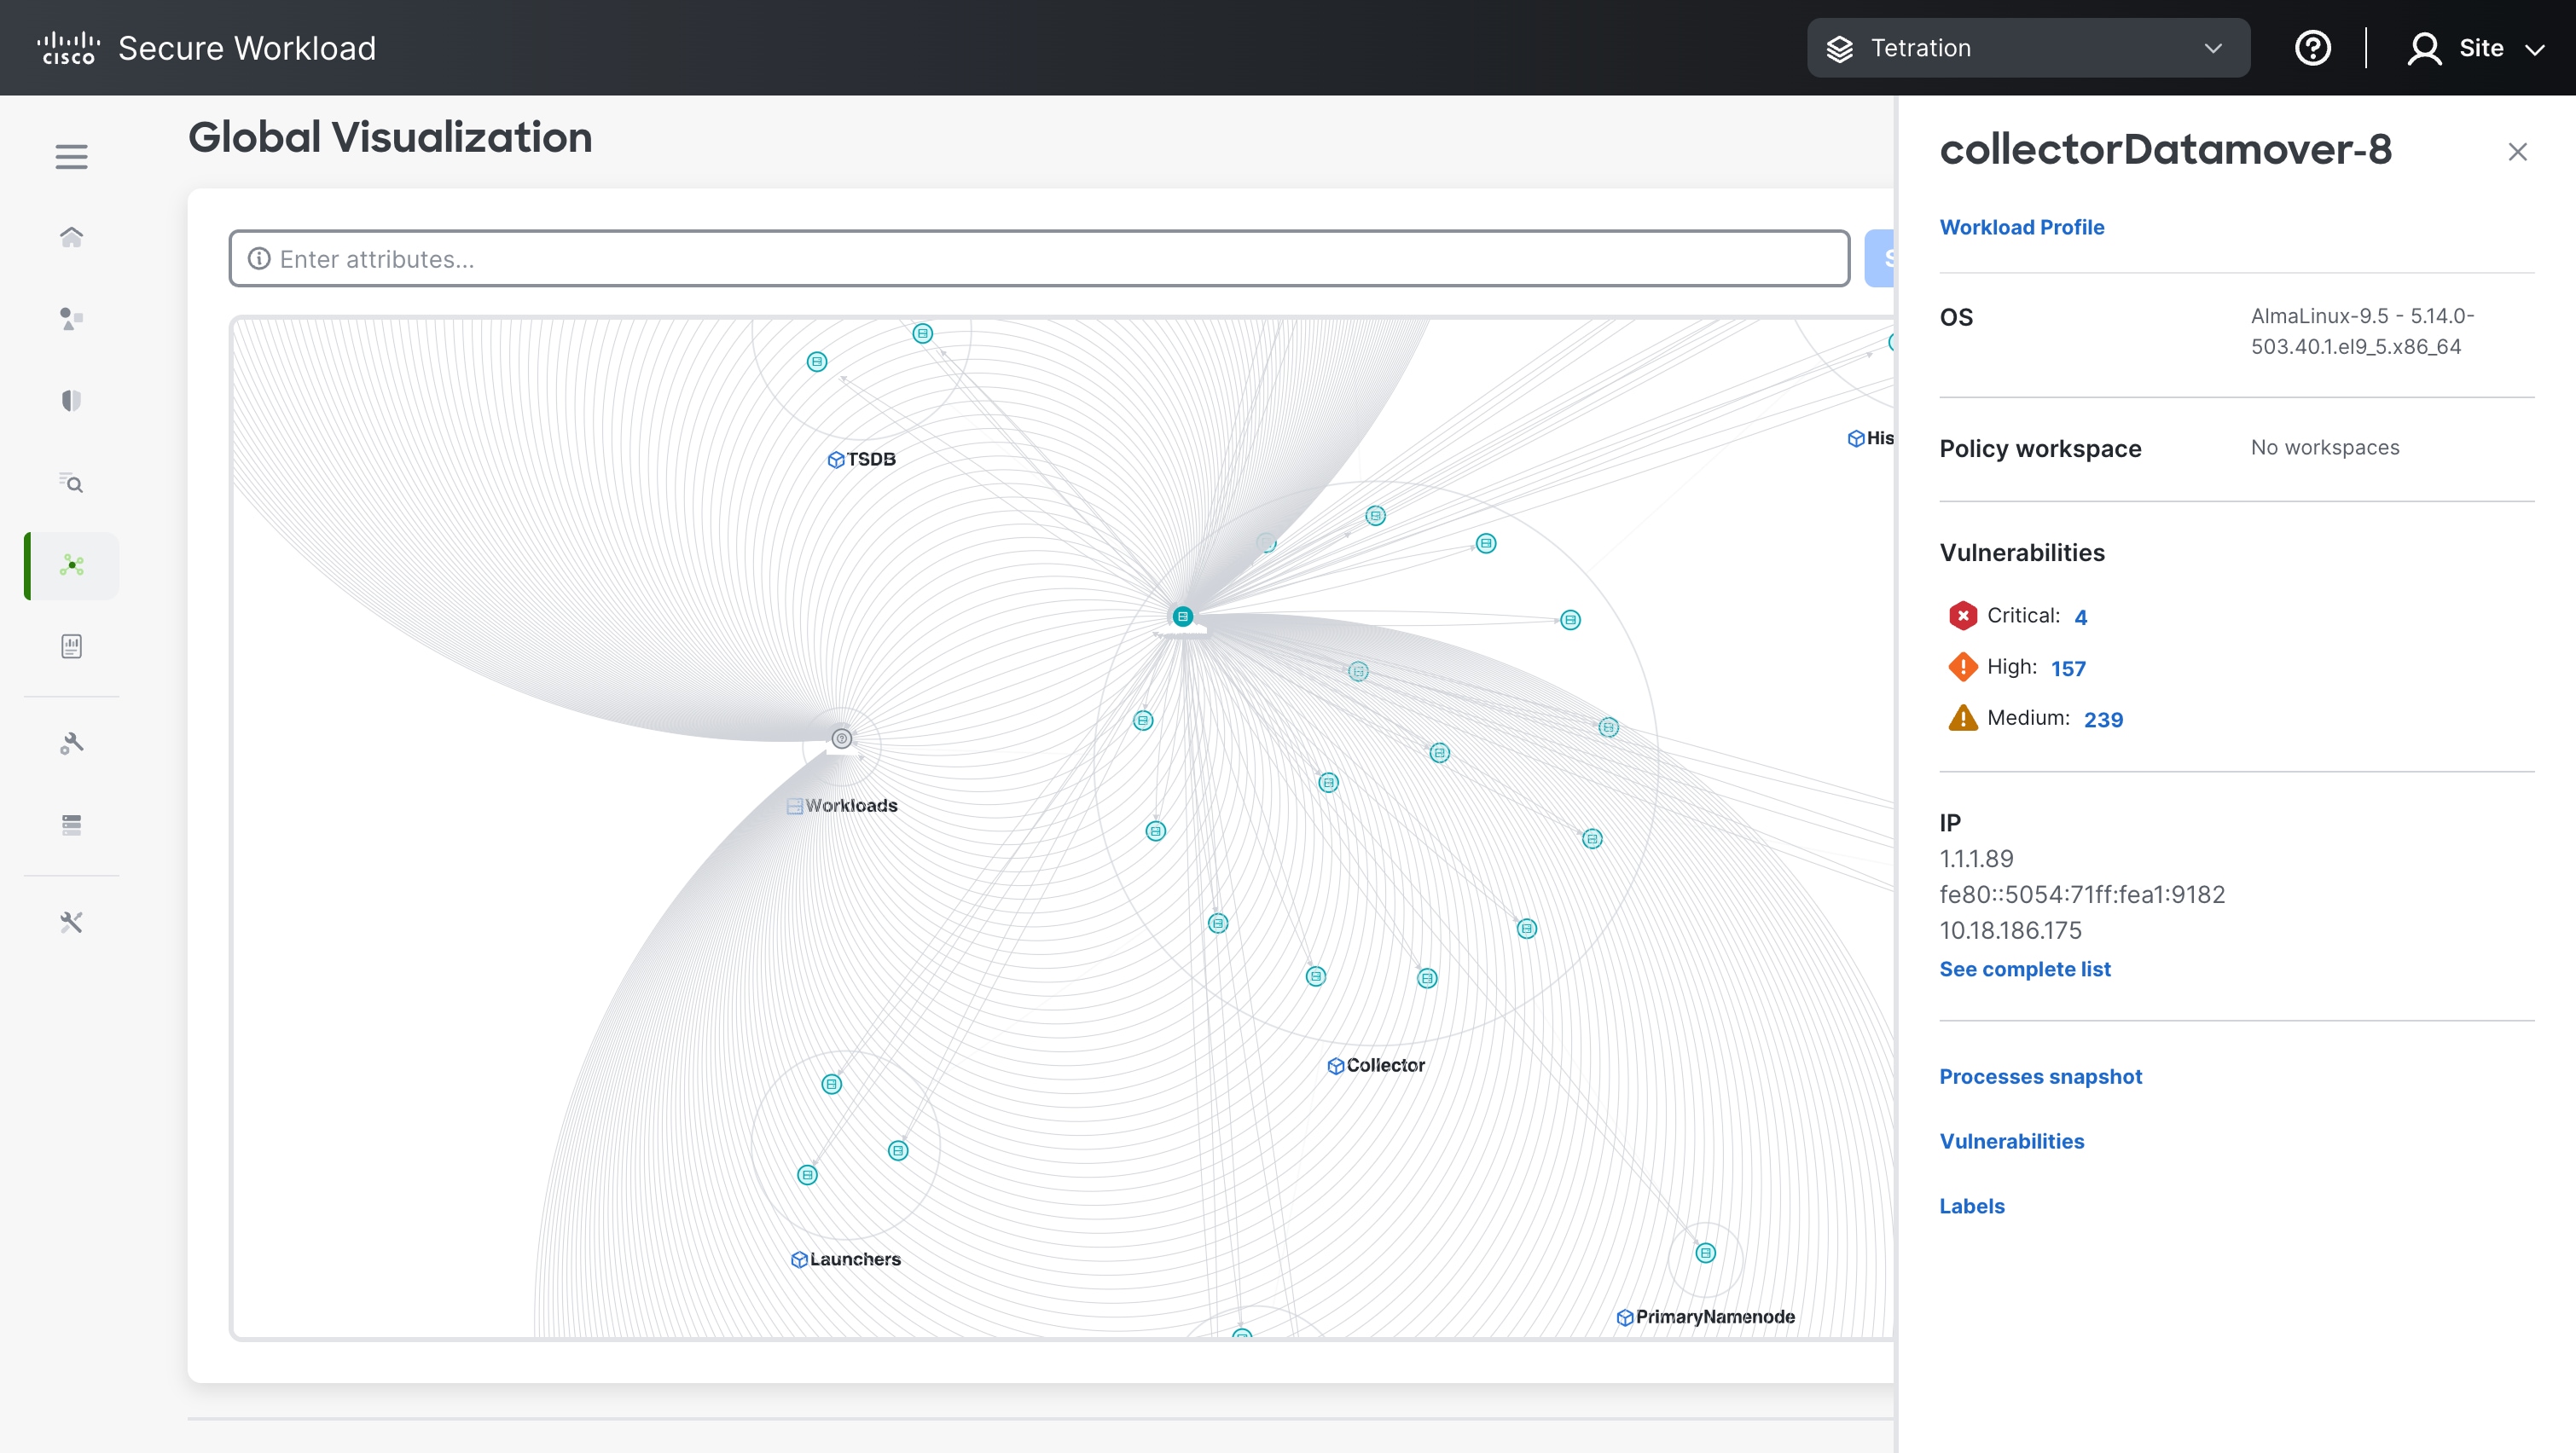
Introduction to Global Visualization

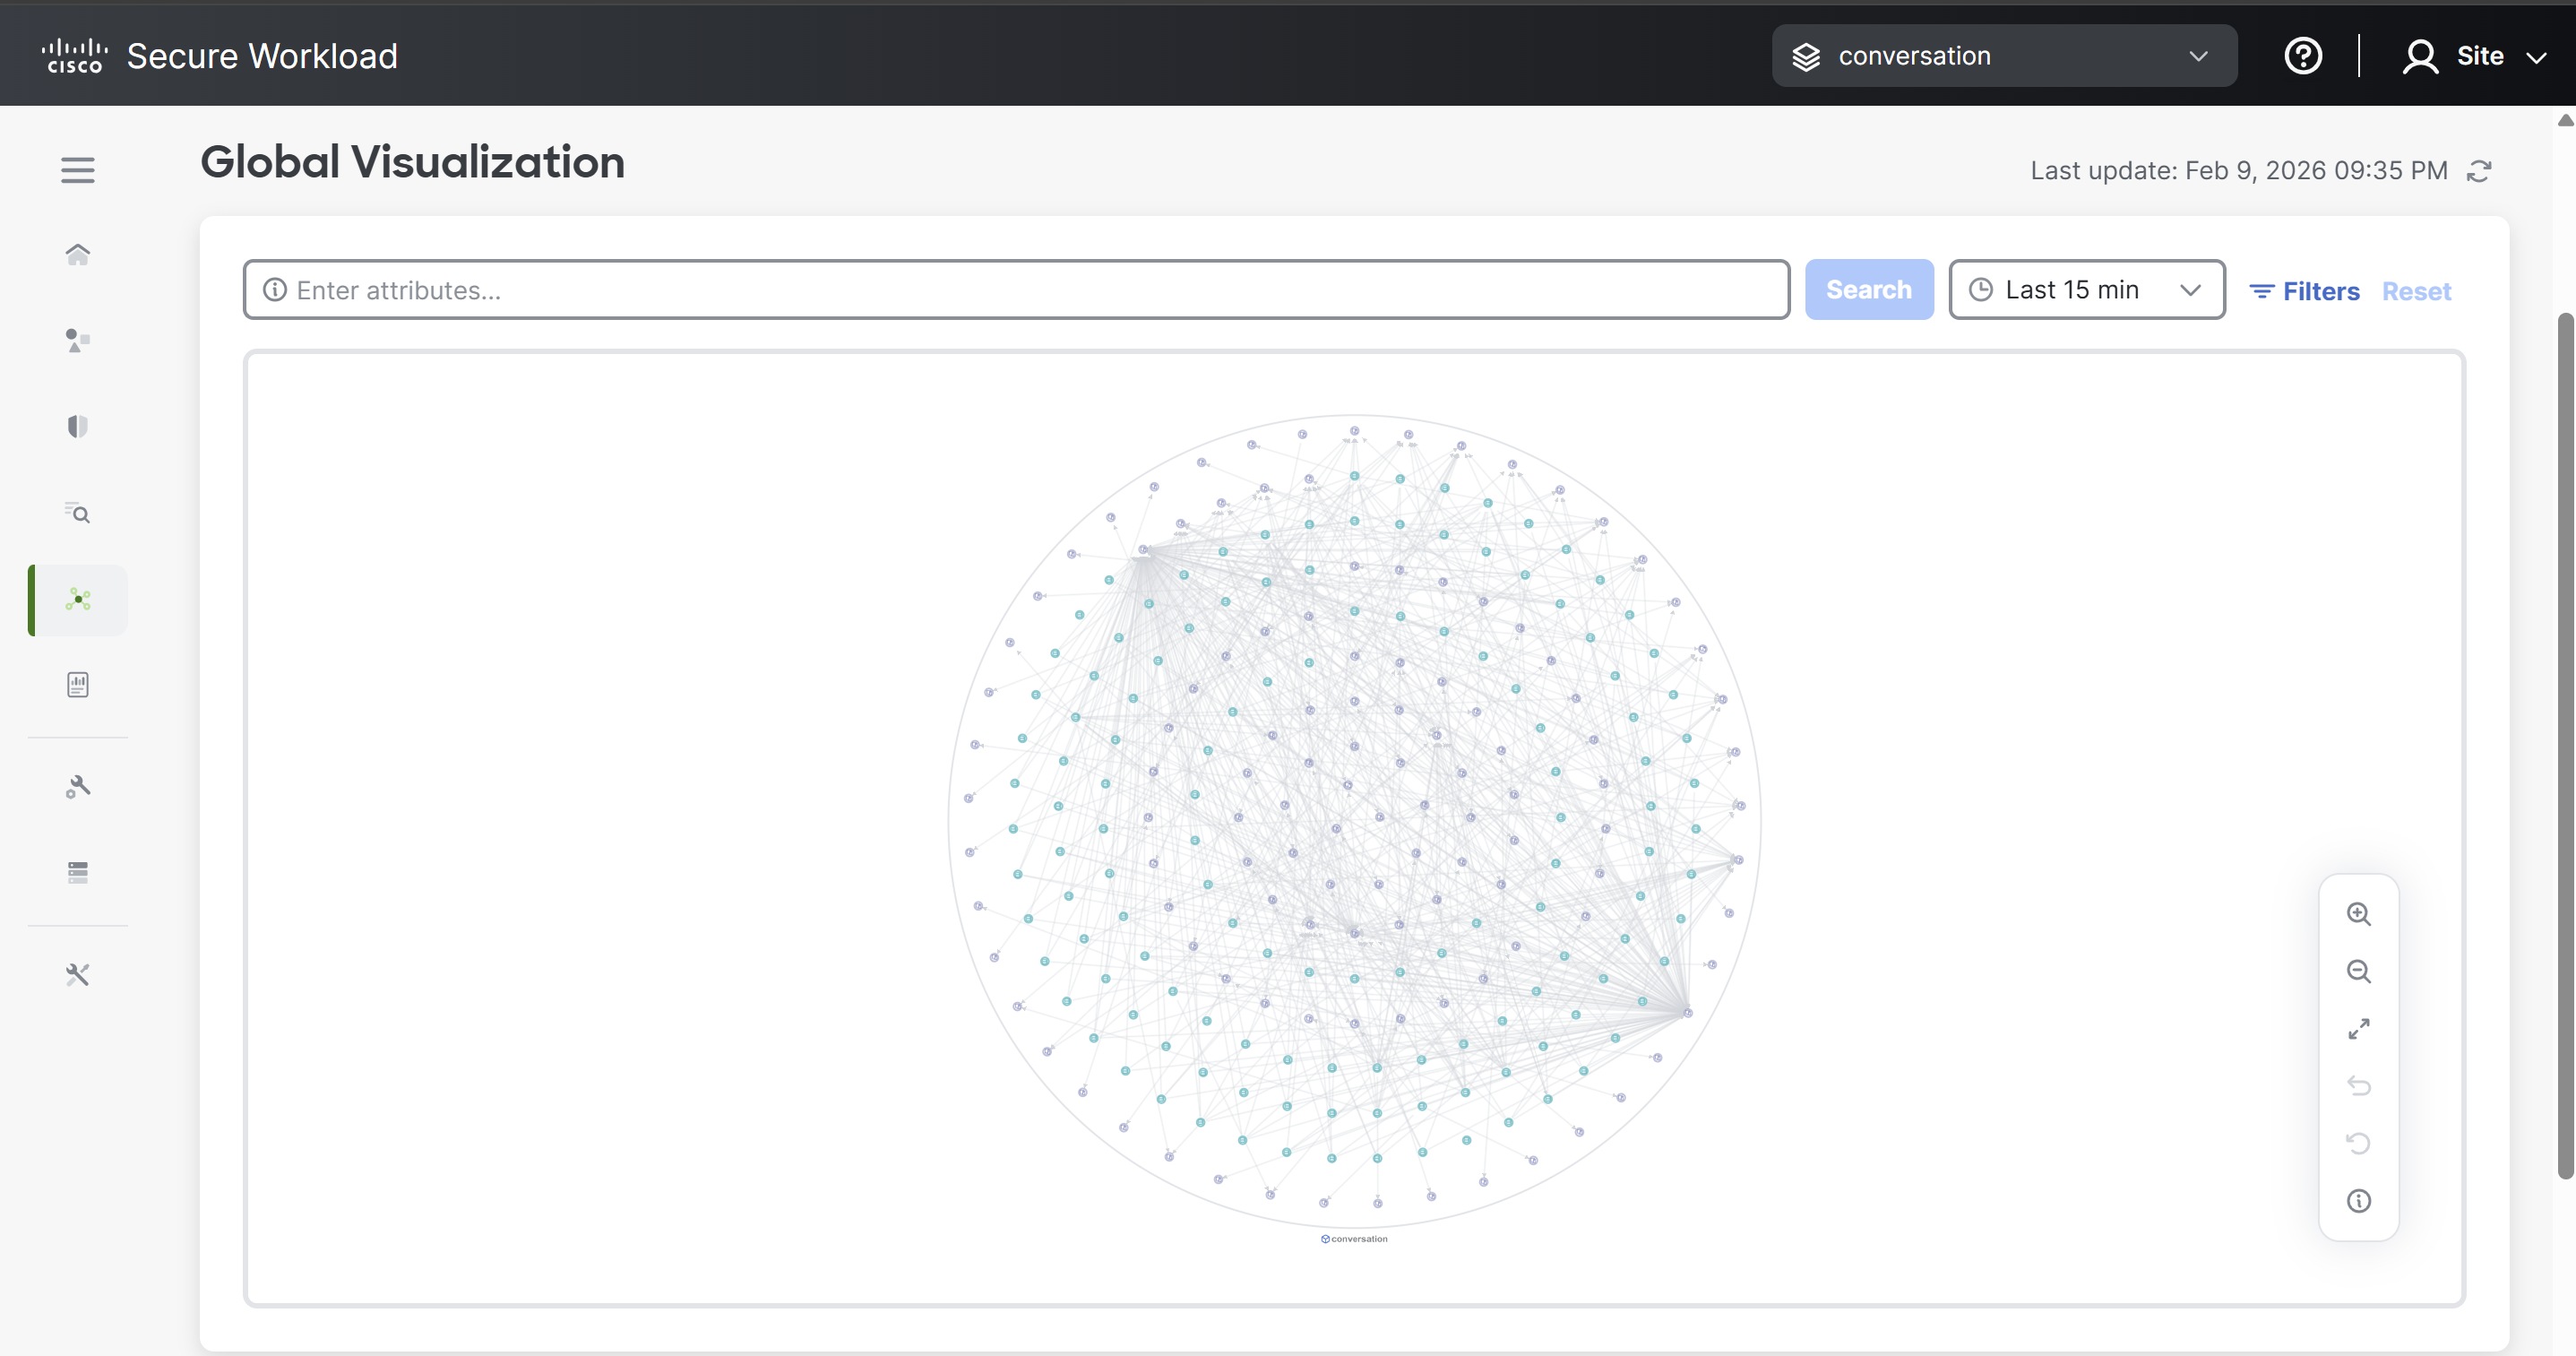
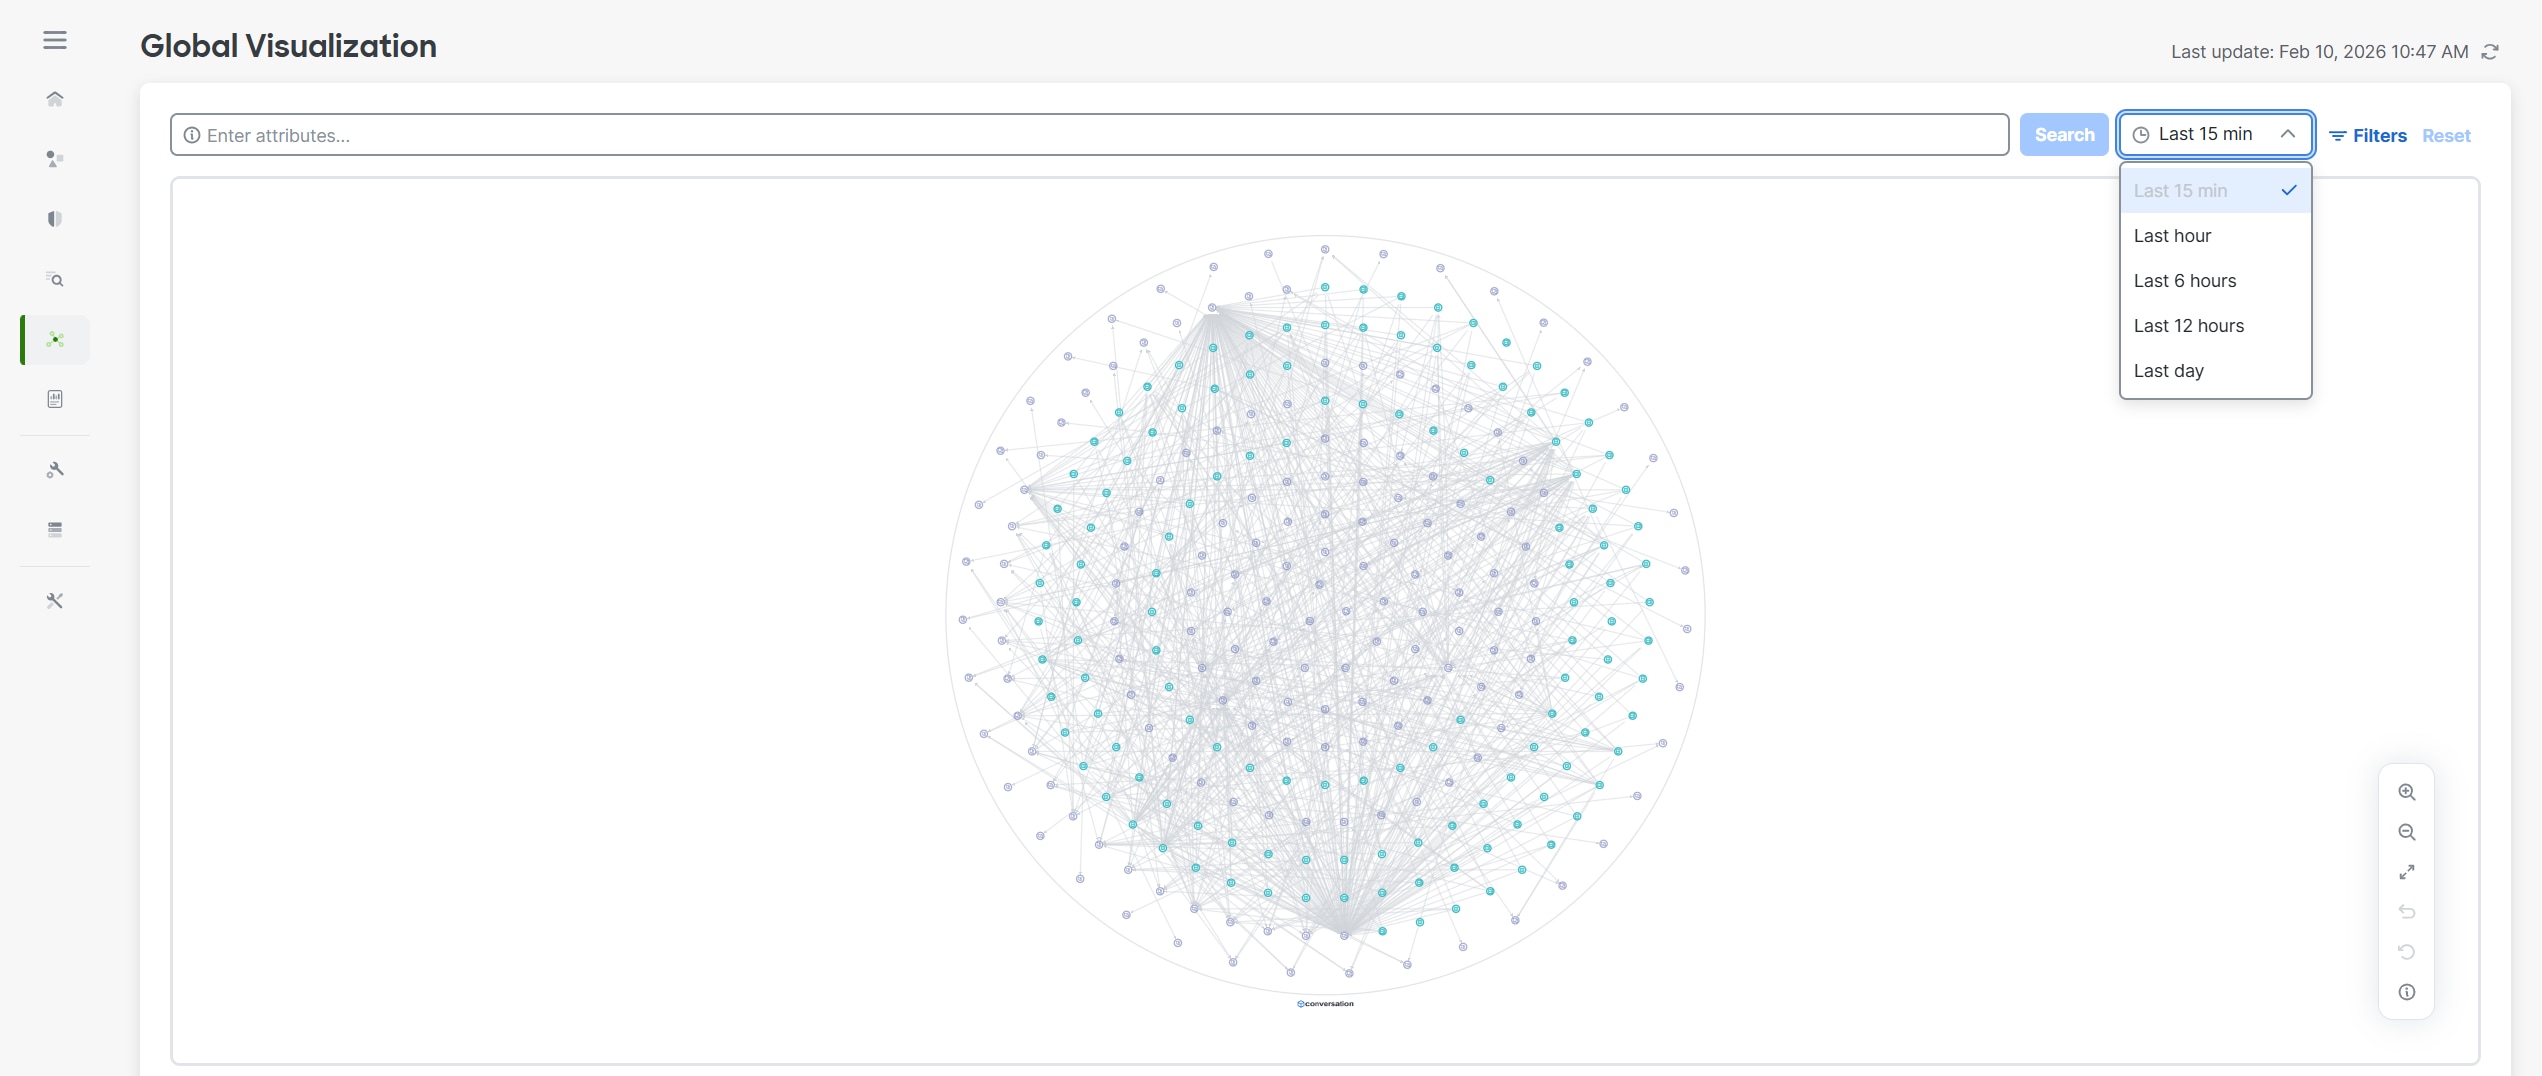
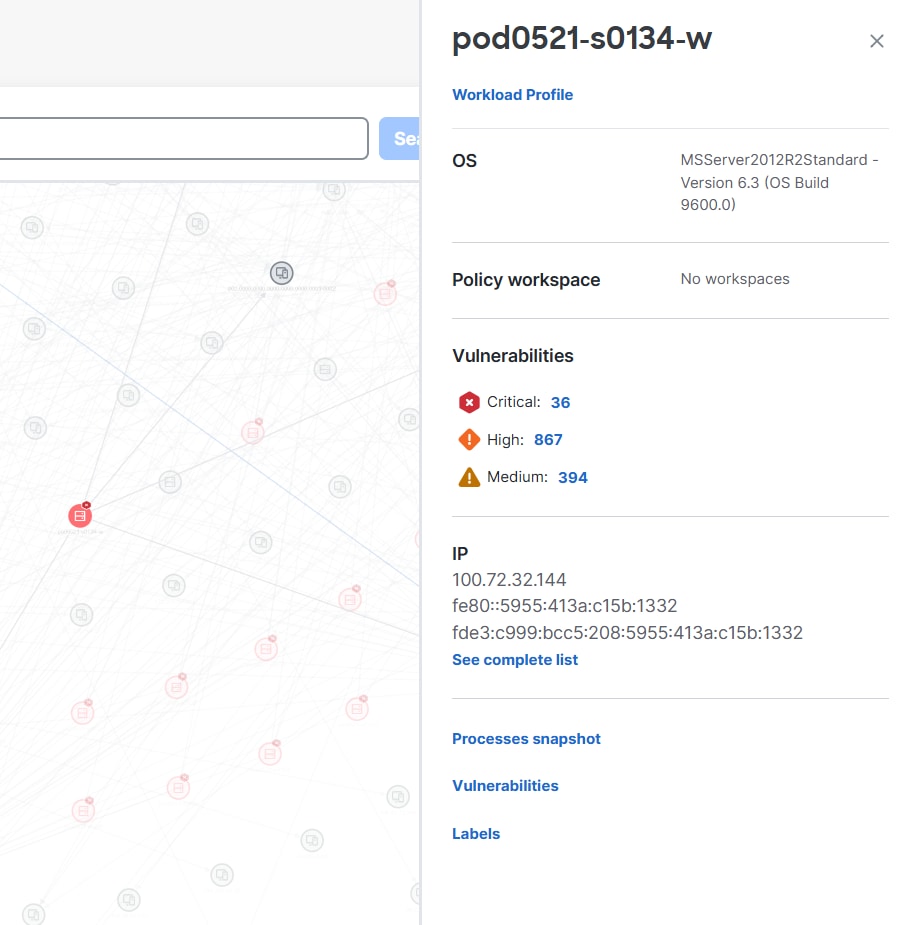
Cisco Secure Workload's microsegmentation solution includes Global Visualization, a tool that helps organisations to gain near real-time network visibility, segmentation of the network, discover vulnerabilities, and improve their security posture.

Key features

  • Represents a vast amount of data in a compact space and avoids node-edge overlap.

  • Node sizes expand or contract for scopes that have more inventory, more concentrated connections, or critical nodes that have large amount of inventory.

  • Highlights traffic flows and makes it simple to identify patterns or anomalies at a glance.

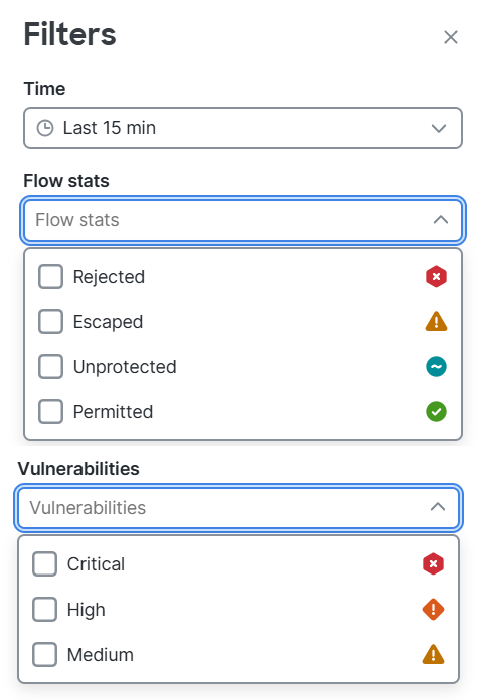
  • Visualization access is now managed through Role-Based Access Control (RBAC), ensuring that users can only view data and dashboards aligned with their assigned roles and permissions.

  • Users with respective access can view the scope tree.

Figure 1. Global visualization

For a visual presentation of real-time network visibility, see this video: Global Visualization for Near Real-time Traffic Flow Analysis

Global Visualization Canvas

The canvas provides built-in controls for time range selection, filtering, and search, along with visual indicators for flow status and vulnerability severity. Users can interact with the canvas to explore workload hierarchies, analyze traffic paths, and identify potential security risks.

To access the canvas, from Secure Workload navigation pane, select Global Visualization.

Search and attributes filter

Use the Enter attributes… field to search and filter by standard attributes (such as Scope, Hostname, Address, Consumer/Provider name) or by custom labels.

Time range selection

Defines the interval for which traffic and flow data are displayed on the Global Visualization Canvas. Changing the time range allows you to analyze communication patterns over different periods, from near real-time activity to longer-term trends.

The following predefined time ranges are available: Last 15 minutes, Last hour, Last 6 hours, Last 12 hours, and Last day. When you select a time range, the canvas automatically refreshes to show only the flows and relationships observed during the specified interval.

Last update timestamp

Monitor the Last update: field in the top right to ensure you are viewing the most recent telemetry data.

Figure 2. Global Visualization Canvas

Filters

The filters panel allows you to refine the data displayed on the Global Visualization canvas by time, flow status, and vulnerabilities. Applying filters helps focus the visualization on relevant traffic and security conditions.

Figure 3. Filters

Time

The time filter defines the time range for which flow data is displayed. Selecting a time range updates the canvas to show only the traffic observed during the chosen interval.

Flow stats

The flow Stats filter allows you to include or exclude traffic flows based on their enforcement status. This helps isolate specific types of network behavior and policy outcomes.

  • Rejected: Displays flows that were blocked by enforcement policies.

  • Escaped: Displays flows that bypassed policy enforcement.

  • Unprotected: Displays implicit allowed flows where no explicit security policies are currently applied to the agent or workload.

  • Permitted: Displays traffic that is explicitly allowed by a defined security policy or a catch-all allow rule.

The flow stats filter follows a defined priority order when multiple flow statuses apply to a workload at the same time. Rejected has the highest priority and is displayed first when a flow is rejected between workloads or scopes. If rejected is not selected, the canvas displays escaped flows; if escaped is also not selected, it displays unprotected flows. This ordering ensures that the most critical flow status is highlighted first.

Vulnerabilities

The vulnerabilities filter allows you to narrow the visualization to workloads with identified security vulnerabilities based on severity.

  • Critical: Displays workloads with critical-severity vulnerabilities that require immediate attention.

  • High: Displays workloads with high-severity vulnerabilities that pose significant risk.

  • Medium: Displays workloads with medium-severity vulnerabilities that should be reviewed and addressed as part of regular security maintenance.

The vulnerabilities filter follows a priority order when multiple severities apply to a workload. Critical has the highest priority, followed by high and medium, ensuring the most severe vulnerabilities are shown first.

When you apply the critical filter, the canvas highlights workloads that have critical vulnerabilities. Selecting one of these workloads opens the workload profile panel with detailed information. In the vulnerabilities section of the panel, the total number of vulnerabilities is displayed by severity (Critical, High, and Medium). These values indicate the current vulnerability count associated with the selected workload.

Clicking any vulnerability count redirects you to the vulnerabilities dashboard, where you can review detailed vulnerability information, including affected packages, CVE details, and remediation insights for that workload.

Figure 4. Vulnerabilities

Toolbar Options

From the Global Visualization canvas, click the Legend option located at the bottom-right corner of the canvas. The legend provides a reference for canvas structure, node types, flow status indicators, vulnerability indicators, and supported interactions.

You can use the toolbar options to perform actions such as:

Figure 5. Toolbar options
  • Enlarging or reducing the canvas

  • Adjusting the canvas position on the page

  • Refreshing flow data

  • Use the Back button to return to the previous view

  • Use the Default view button to restore the canvas to its original state. Flows automatically refresh every 15 minutes when there is no activity on the canvas.

Figure 6. Toolbar options

Interactions

You can interact within the Global Visualization canvas using the following actions:

  • Click on a node or flow to show or hide details.

  • Double-click a node to expand and view child elements.

  • Click and drag to reposition nodes on the canvas.

  • Use mouse gestures to zoom in and out.

Structure

The structure section explains how nodes and traffic flows are visually represented on the canvas.

  • Scope: Represents a logical grouping of inventory organized in a hierarchical structure. Scopes categorize workloads and other inventory to simplify traffic visualization and analysis.

  • Scope name: Displays the name of the scope as defined in Secure Workload.

  • Node name: Displays the name of the selected node, such as a workload or scope.

  • Traffic flow: Represents the direction of communication between nodes. Arrows indicate the direction of traffic flow between scopes, workloads, or other inventory.

  • Flow count: Indicates the total number of observed flows between nodes for the selected time range. For detailed flow information, you can navigate to the Flow Page.

Node types

Nodes represent physical or virtual entities within a cluster where services and workloads are distributed. Below are the node types are displayed on the Global Visualization canvas:

  • Scope: A logical container used to organize inventory hierarchically. Scopes display inflow and outflow traffic to and from workloads and other inventory within the selected time range. Each scope displays aggregated flow information, including top provider protocols, ports, and flow counts. In the canvas click on a scope to view the details.

    Each scope will also have Policy workspace. Here you can add policies for the workload.

    Figure 7. Scope view
  • Workload: Represents a physical or virtual server with an installed Secure Workload agent. Traffic flows within the inventory where workloads provide detailed visibility, including hostname, labels, vulnerability counts, running processes, and vulnerable packages.

    Figure 8. Workload view
  • Cloud Workload: Represents workloads discovered through cloud integrations. These workloads may be agentless and provide visibility based on cloud metadata and observed traffic.

  • Pod: Represents a Kubernetes pod running within a cluster. Pods display traffic flows and relationships with other workloads, services, and scopes.

  • Service: Represents a Kubernetes service that exposes workloads or pods and participates in traffic flows within the cluster.

  • IPs: Represents individual IP addresses involved in traffic flows. IP nodes help identify communication endpoints when workloads or services are not directly identifiable.

  • Internet: Represents external traffic endpoints outside the Secure Workload–managed environment.

  • Uncategorized: Represents inventory that belongs to a scope but is not a direct child of that scope. These nodes help identify assets that are associated with a scope but not fully classified.

For information about Flow Status and Vulnerabilities, see Global Visualization Filters.