Manage Policy Lifecycle in Secure Workload

The purpose of segmentation and microsegmentation policies is to allow only the traffic your organization needs to conduct business, and block all other traffic. The goal is to reduce your network's attack surface without disrupting business operations.


Attention


Due to recent GUI updates, some of the images or screenshots used in the user guide may not fully reflect the current design of the product. We recommend using this guide in conjunction with the latest version of the software for the most accurate visual reference.


Table 1. Feature History

Feature Name

Release

Feature Description

Where to Find

Policy Discovery Flow Filters

3.10

ADM supports inclusion filters

Policy Discovery Flow Filters

Segmentation policy basics

Secure Workload segmentation policies manage traffic based on various attributes like source, destination, port, protocol, and other platform-specific attributes.

You can manually create some policies. Secure Workload's automatic policy discovery feature can generate other policies based on existing network traffic.

You can review, refine, and analyze your policies. Enforce them when you are confident they permit only the traffic for your organization.


Important


Microsegmentation creates a firewall around each workload.

For traffic to pass between each consumer-provider pair, both must have a policy that allows the traffic.


Note


The terms firewall rule, edge, and cluster edge are sometimes used to mean "policy."


Use workspaces to manage policies

A workspace is a digital environment that

  • enables policy management for specific scopes,

  • provides an isolated environment for experimentation that does not affect other workspaces,

  • facilitates multi-user access and collaboration.

Controlling User Access to Workspaces

Workspaces are intended to be shared among team members.

To manage access, assign user roles relative to the scope of the workspace. For more information, refer to the Roles section.

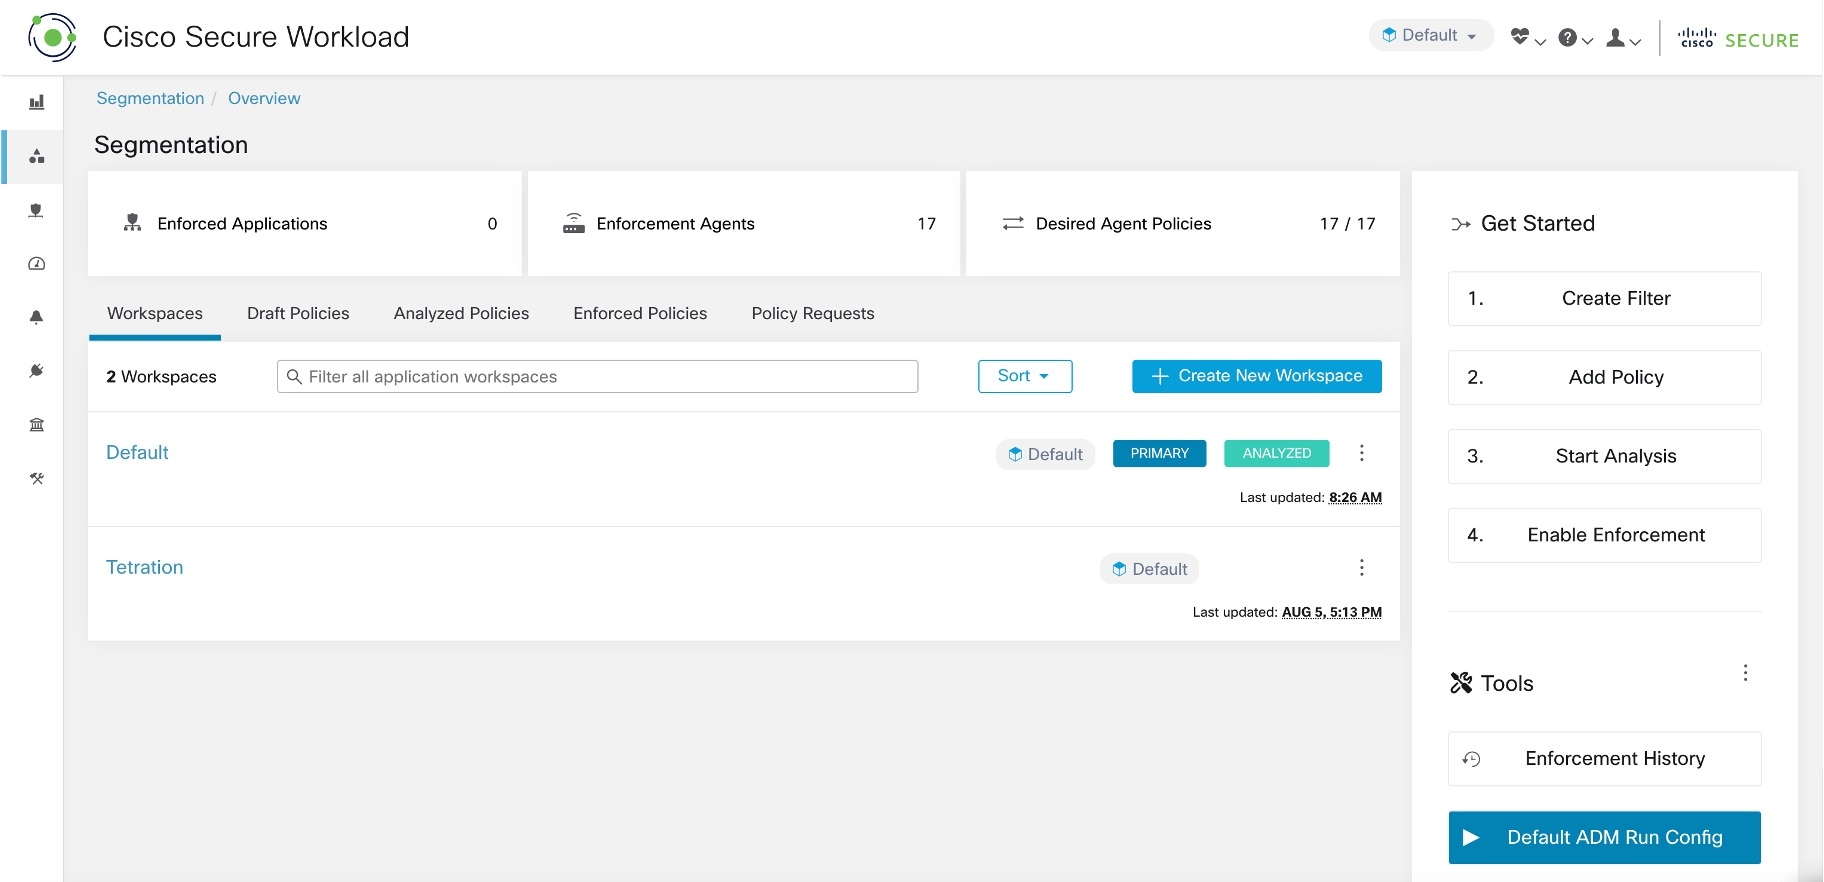
Working with policies: Navigating to the workspaces page

  • To work with policies, view existing application workspaces, and create new ones:

    Choose Defend > Segmentation from the navigation bar located on the left side of the window.

  • To view a particular workspace:

    Navigate to the associated scope in the list of scopes on the left side of the Workspaces page, and click the workspace. The currently active workspace will be highlighted.

  • To return to the list of workspaces:

    Click the Workspaces link near the left side of the page you are looking at.

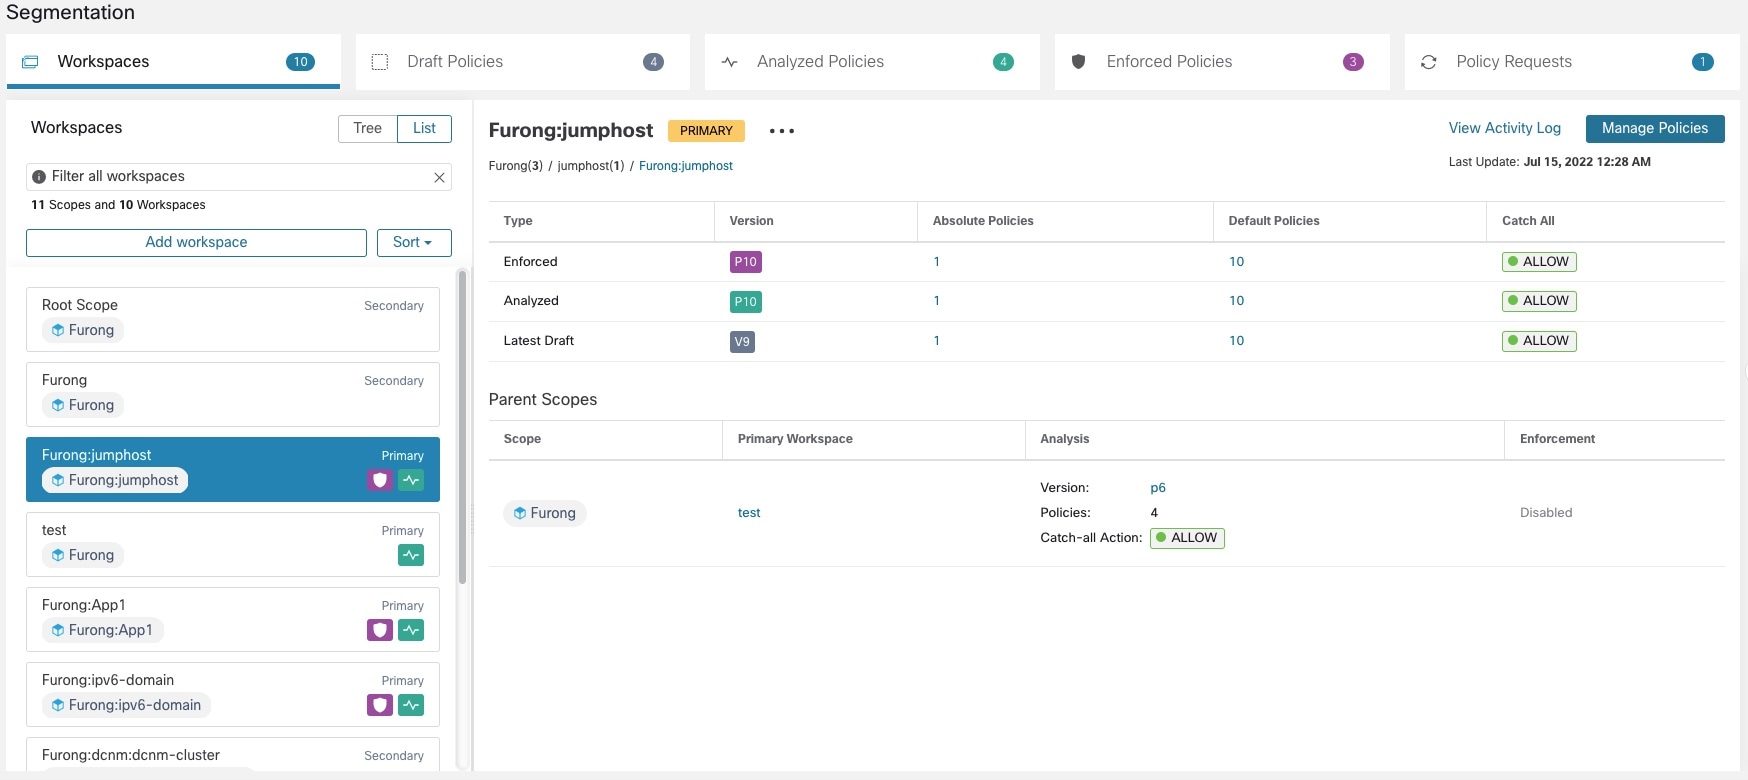
Figure 1. Workspace Management Page
Workspace management page

Create a workspace

To create policies for a scope, first create a workspace for that scope.

  1. From the navigation menu, choose Defend > Segmentation.

  2. From the list of scopes, search for or scroll to the scope for which you want to create policies.

  3. Hover over the scope. Click the blue plus sign.

  4. Complete the form and click Create.

Once a workspace exists for the scope, additional workspaces are created as secondary workspaces.

Primary and secondary workspaces

In each scope, create one Primary workspace and multiple secondary workspaces.

You can enforcce only a primary workspace. Primary workspaces allow you to manage policies in different scopes.

Use primary workspaces for managing policies across different scopes and performing live policy analysis.

Use secondary workspaces to experiment with policies while preserving existing setups in the primary workspace.

To change a workspace to primary or secondary:

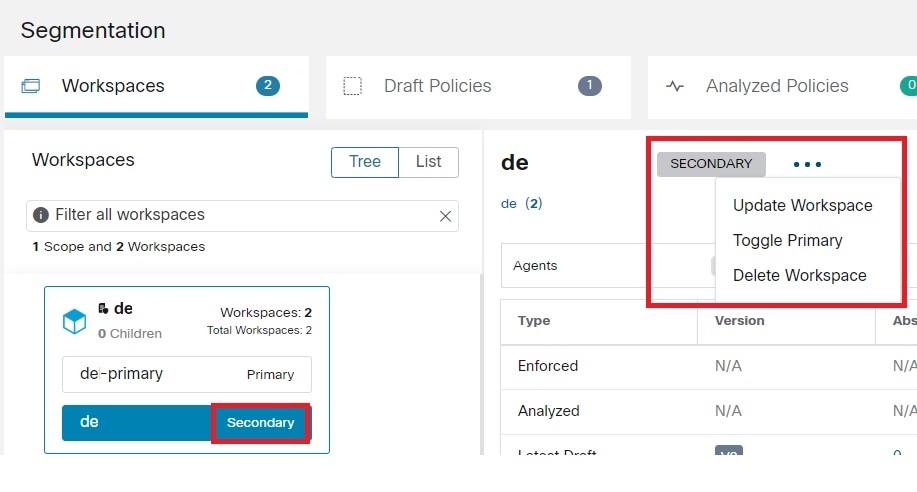
You can switch a workspace between primary to secondary at any time. Click the menu icon next to the workspace name at the top of the page, then select Toggle Primary.

Figure 2. Switching a Workspace Between Primary and Secondary
Switching a workspace between Primary and Secondary

Rename a workspace

To rename a workspace:

Click More button beside the workspace type (Primary or Secondary) near the top of the page and choose Update Workspace.

View workloads in a scope

Deleting workspaces

You can only delete secondary (nonprimary) workspaces. To switch a workspace to secondary, see Primary and secondary workspaces.

To delete a workspace:

  1. Choose Defend > Segmentation.

  2. Navigate to the scope containing the workspace to delete and click it.

  3. Click the workspace to delete.

  4. Click More button beside Secondary and choose Delete Workspace.

    Delete Workspace

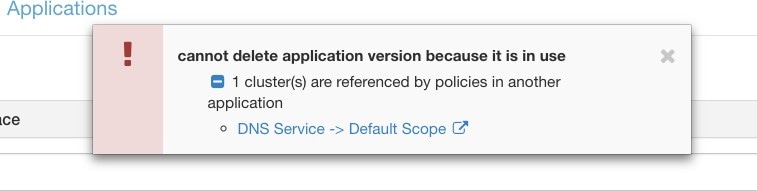
You cannot delete the dependent workspace if a workload or cluster in a workspace is referenced by a policy in another workspace due to Provided Service. A list of the dependencies will be returned, and this information can be used to resolve the dependency.

Figure 3. List of Items Preventing the Deletion of the Workspace
List of items preventing the deletion of the workspace

In rare cases, Workspace A may depend on a cluster in Workspace B and vice versa. In this case, individual policies or published policy versions (p*) must be deleted. The "delete restrictions" error provides links to all the policies so this can be accomplished.

To delete p* versions, refer to View, compare, and manage analyzed policy versions or View, compare, and manage enforced policy versions.

About Policies

Policy Attributes

Table 2. Policy Properties

Security Policy Property

Description

Scope for which the policy is defined

A policy affects only workloads that are members of the scope associated with the workspace in which the policy is defined.

(However, see also the topics under Address policy complexities.)

For more information, see Policy example.

Consumer

The client of a service or the initiator of a connection.

Any scope, cluster, or inventory filter can be used as the consumer in a policy.

For important information, refer to About consumer and provider in policies.

Provider

The server or the recipient of a connection.

Any scope, cluster, or inventory filter can be used as the provider in a policy.

For important information, refer to About consumer and provider in policies.

Protocols and Ports

The server (listening) port and IP protocol of the service made available by the provider that should be permitted or blocked.

Action

ALLOW or DENY: Whether to allow or block traffic from consumer to provider on the given service port/protocol.

Rank and Priority

For more information about the rank and priority of policies in a workspace, refer to Policy ranks: Absolute, Default, and Catch-All.

Policy ranks: Absolute, Default, and Catch-All

Policy rank determines whether a more specific policy lower in the priority list or scope tree can override a policy. In every scope, the catch-all rule is the policy with the lowest priority.

Policy Rank

Description

Absolute

Absolute policies override application-specific policies lower in the policy list or in scopes lower in the scope tree. Use Absolute policies to enforce best practices, protect different zones, or quarantine specific workloads. For example, use absolute policies to control traffic to DNS or NTP servers to meet regulatory requirements.

These are listed above the default policies in the policy priority list.

Default

Default policies can be overridden by policies lower in the policy list or in scopes lower in the scope tree. Generally, fine-grained policies are Default policies.

These are listed below the absolute policies in the policy priority list.

Catch-All

Each workspace has a catch-all policy managing traffic that does not match specified policies. The catch-all action may be Allow or Deny.

In general, configure the Catch-All policy with these guidelines:

  • Allow traffic in scopes higher in the scope tree, so that policies in scopes lower in the tree can evaluate the traffic.

  • Deny traffic at the most specific leaf at the bottom of the scope tree.

This gives policies in all scopes in the tree the opportunity to match the traffic, while blocking unmatched traffic.

This rule applies to all interfaces on each workload in the workspace.

Policy inheritance and the scope tree

You can create general policies at or near the top of the tree because workloads are organized in a hierarchical scope tree. These policies can apply to all workloads in all scopes further down the tree.

You can specify if you want more specific policies lower in the tree to override general policies.

For more information, refer to Policy ranks: Absolute, Default, and Catch-All.

About consumer and provider in policies

A consumer or provider within a policy is defined as an entity that:

  • Specifies the workloads or Secure Workload agents that receive policy or firewall rules,

  • Specifies the IP addresses to which these firewall rules apply,

  • Applies rules to all interfaces on a host with multiple IP addresses.


Important


You must separate the purposes of consumers and providers if firewall rule IP addresses differ from the workload IP addresses. For more information, refer to Effective consumer or provider.


Policy example

This example policy shows the importance of the scope where a policy is defined, how policy inheritance impacts it, and how inventory filters create precise policies or policies that apply to workloads in multiple scopes.

Consider an example involving three scopes:

  • Apps

    and its child scopes

    • Apps:HR and

    • Apps:Commerce

The inventory filters PRODUCTION and NON-PRODUCTION specify production and non-production hosts.

Assume that a policy is defined in the Apps scope:

DENY PRODUCTION -> NON-PRODUCTION on TCP port 8000 (Absolute)

This policy is defined as an absolute policy in the primary workspace under the Apps scope, impacting all PRODUCTION/NONPRODUCTION hosts that are members of the Apps scope, as well as hosts in its descendant scopes like Apps:HR and Apps:Commerce.

Now consider the case where the exact same policy is defined under the workspace that is associated with the Apps:HR scope. In this scenario, the policy can only affect PRODUCTION/NONPRODUCTION hosts that are members of the Apps:HR scope. More precisely, this policy results in inbound rules on NONPRODUCTION HR hosts (if any) which deny connections on TCP port 8000 from any PRODUCTION host, and outbound rules on PRODUCTION HR hosts (if any) which drop connection requests to any NONPRODUCTION host.

Create and discover policies

Best practices for creating policies

  • For an overview of the segmentation process, see Get started with segmentation and microsegmentation and subtopics.

  • Manual policy creation:

    Manually create policies and enforce them across the network. For example, quarantine vulnerable hosts or block unwanted traffic to your workloads from outside your network.

    • Create policies for scopes in your scope tree. For example, to block all traffic from outside your network to every host in your network, put the policy into the scope at the top of the tree.

    • To override the general policy for some workloads, create high-level default policies and apply specific policies to these workloads.

    • Use templates to speed policy creation.

    • Refer to Manually create policies, Policies for Specific Purposes, and Policy templates.

  • Automated policy discovery

    You can optionally discover policies automatically near the top of your scope tree or across all scopes in a branch. This creates broad policies that allow existing traffic while restricting future unwanted traffic. You can then develop more specific policies to protect your network from unnecessary or undesired traffic.

    For more information, see Discover policies for one scope or for a branch of the scope tree and Discover policies automatically for information.

  • To create more detailed policies, automatically discover policies for scopes at or near the bottom of your scope tree, focusing on individual application scopes.

    See Discover policies for one scope or for a branch of the scope tree and Discover policies automatically for information.

  • Specific scenarios:

    Ensure to include policies that cover rare or infrequent scenarios such as failover, backup restoration, and annual activities.

  • Traffic management and monitoring:

    After allowing necessary application traffic, identify and block unauthorized traffic:

    • Prioritize traffic to sensitive applications and investigate suspicious patterns.

    • Collaborate with team members to ensure correct policy application to workloads.

  • Initially, when you enforce policies, set the catch-all to Allow during the monitoring phase, then switch to Deny when no necessary traffic is obstructed.


Note


Frequently observed and time-sensitive traffic rules should be prioritized at the top of the firewall rules table by adjusting the policy priorities.


Manually create policies

Policies are typically created to broadly apply across a network. For example, you can manually create policies to:

  • Allow access from all internal workloads to your NTP, DNS, Active Directory, or vulnerability scanning servers.

  • Deny access from all hosts outside your organization to hosts inside your network unless explicitly permitted.

  • Quarantine vulnerable workloads.

You can create absolute policies that cannot be overridden by more granularly applied policies. Set default policies that can be overridden by more specific ones.

You can create manual policies for scopes nearer the top of your tree.

Before you begin

  • (Optional) Consider using one of the templates available from Defend > Policy Templates.

  • (Optional) If you have a set of workloads with shared policies, use an inventory filter to group them so you can easily apply policies to the set. The inventory filter can apply to only one scope or to workloads across multiple scopes. For more information, see Create an inventory filter.

  • Ensure that the workloads in this scope are as expected. For more information, see View workloads in a scope.

Procedure


Step 1

Choose Defend > Segmentation.

Step 2

Search for or navigate to the scope in which you want to create the policy.

Step 3

Select the scope and workspace in which you want to create the policy.

If the workspace is not created, refer to Create a workspace.

Step 4

Click Manage Policies.

Step 5

Click the Policies tab if it is not already selected.

Step 6

Click Add Policy.

If unavailable, refer to Add policy button is not available (concept).

Step 7

Enter necessary policy information:

  • For information about the Absolute checkbox, refer to Policy ranks: Absolute, Default, and Catch-All. Generally, if you are creating policies that you do not expect exceptions for, enable this checkbox.

  • Priority sets the order of the policy in the list. For more information about setting policy order, refer to Policy priorities and subtopics.

  • You can configure consumer and provider to be the entire scope or choose among workload groups using inventory filters, or less optimally, clusters in the same workspace.


What to do next

Ensure the Catch-all action is appropriate for the workspace. For more information, see Policy ranks: Absolute, Default, and Catch-All.

Add policy button is not available (concept)

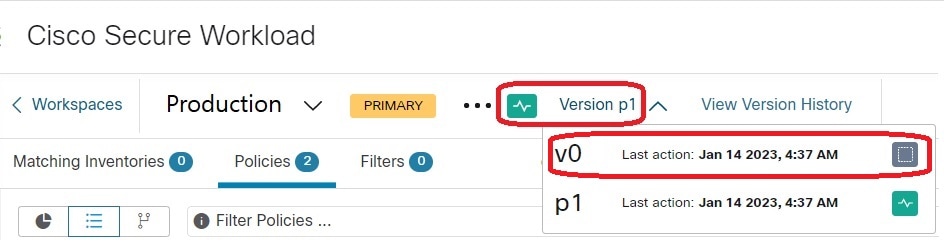
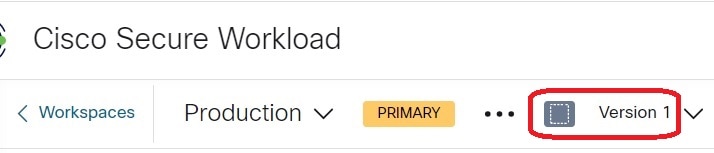
If you are trying to create a policy and the Add Policy button is not available, click the version displayed at the top of the page, then select the latest "v" version. This version is indicated with a gray square:

Select version to display

Policies for Specific Purposes

Create InfoSec policies to block traffic from outside your network

Create policies to allow traffic through common ports and protocols and block other types of traffic. You can modify the default policy set to meet your needs.

Before you begin

Use this procedure if these criteria are met:

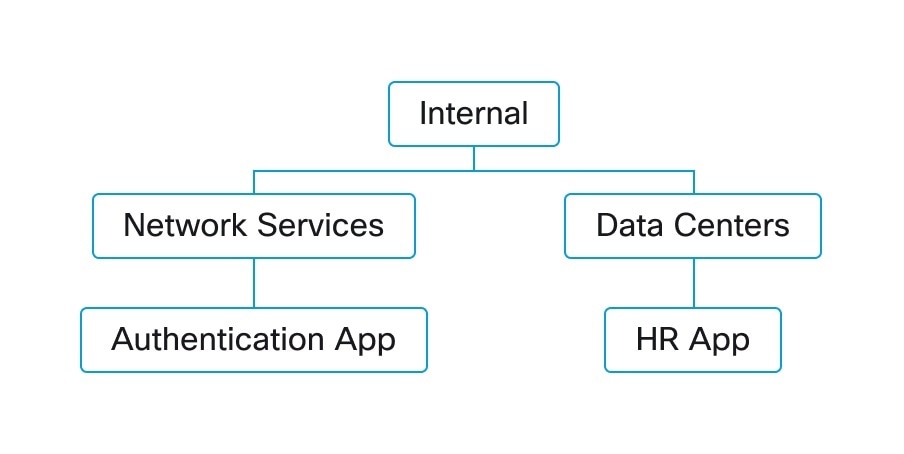
  • Your scope tree should have a scope named Internal directly under the root, and it should include subnets encompassing all your internal network workloads.

  • The Internal scope should not contain any policies defined in it.


Note


Alternatively, to accomplish this, use the InfoSec template from Defend > Policy Templates with a few additional steps.


Procedure

Step 1

Choose Defend > Segmentation,

Step 2

Click the Internal scope and click the primary workspace.

If the Primary workspace does not exist, click the + button to create it.

Step 3

Click Manage Policies.

Step 4

Click Add InfoSec Policies.

Step 5

Verify that the list has the desired protocols and ports, then delete or modify policies as desired.

Step 6

Click Create.


What to do next
Add additional policies to your Internal scope to allow certain external traffic. Ensure these policies are sequenced appropriately in the list.

Create policies to address immediate threats

To manage immediate threats, manually add an Absolute policy to a scope at or near the top of your scope tree, and enforce the primary workspace for that scope.

Remove the policy and reinforce the workspace after you remediate the threat.

Create a Policy to Quarantine Vulnerable Workloads

You can:

  • Create policies in advance, to automatically quarantine workloads with specific known vulnerabilities or a vulnerability severity threshold you specify.

  • Create policies, to immediately quarantine workloads with detected known vulnerabilities that you deem sufficiently problematic.

This topic outlines the process for doing either.

Before you begin

Refer to the View Vulnerability Dashboard to see what policies are required.

Procedure

Step 1

Create an inventory filter that defines the vulnerabilities or the vulnerability severity threshold that you want to quarantine:

  1. From the navigation bar at the left of the window, choose Organize > Inventory Filters.

  2. Click Create Inventory Filter

  3. Click the (i) button beside Query and enter CVE to see the relevant filter options.

  4. Enter filter criteria that determine which workloads you wish to quarantine.

  5. Be sure Restrict query to ownership scope is NOT selected.

Step 2

Create a policy to quarantine affected workloads:

For general instructions, see Manually create policies.

Recommendations:

  • Create the policy in your Internal or other scope near the top of your scope tree.

  • The policy should be an Absolute policy unless you want to allow exceptions. Be sure to create policies to address any exceptions.

  • Create separate policies for consumer and provider.

  • Set the priority of each policy to a low number so it will be hit before other policies in the list.

  • Set the action to Deny.

Step 3

Review, analyze, and enforce the policy or policies.


What to do next

Create an alert so you are notified when traffic hits this policy so you can remediate the problem and restore traffic to the vulnerable workload. See Configure Alerts.

Policy templates

Policy Templates are used to apply similar sets of policies to multiple workspaces.

You can create your own templates in addition to the predefined templates provided by Secure Workload.

You must have the scope owner capability on the root scope to use policy templates.

System-defined policy templates

To view available policy templates, choose Defend > Policy Templates.

For information on how to use a policy template, refer to Applying a template.

To modify a system-defined policy template, download the JSON file, edit it, and then upload it.

Create Custom Policy Templates

JSON schema for policy templates (concept)

The JSON schema for policy template mimics the schema of exported application workspace versions. You can create a set of policies in a workspace, export it as JSON, modify the JSON, then import as a policy template.

Attribute

Type

Description

name

string

(optional) Used as the name of the template during import.

description

string

(optional) Template description that is displayed during the apply process.

parameters

parameters object

Template parameters, see below.

absolute_policies

array of policy objects

(optional) Array of absolute policies.

default_policies

array of policy objects

(required) Array of default policies, can be empty.

Parameters Object

The parameters object is optional but can be used to dynamically define filters as parameters to the template. The parameters are referenced using the consumer_filter_ref or provider_filter_ref policy attributes.

The keys of the parameters object are the reference names. The values are an object with a required "type": "Filter" and an optional description. An example of the Parameters object is shown below:


  {
    "parameters": {
      "HTTP Consumer": {
        "type": "Filter",
        "description": "Consumer of the HTTP and HTTPS service"
      },
      "HTTP Provider": {
        "type": "Filter",
        "description": "Provider of the HTTP and HTTPS service"
      }
    }
  }

The parameters can be referenced in the policy objects, for example: "consumer_filter_ref": "HTTP Consumer" or "provider_filter_ref": "HTTP Provider".

Special Parameter References

A few special references automatically map to a filter and do not need to be defined as parameters.

Ref

Description

_workspaceScope

Resolves to the scope of the workspace to which the template is being applied.

_rootScope

Resolves to the root/top level scope.

Policy Object

For compatibility with workspace export JSON, the policy object contains multiple keys for consumers and providers. They are resolved as follows:


  if *_filter_ref is defined
    use the filter resolved by that parameter
  else if *_filter_id is defined
    use the filter referenced by that id
  else if *_filter_name is defined
    use the filter that has that name
  else
    use the workspace scope.

If a filter cannot be resolved, an error occurs during both at the time of application and at the time of upload.

Attribute

Type

Description

action

string

(optional) Action of the policy, ALLOW, or DENY (default ALLOW).

priority

integer

(optional) The priority of the policy (default 100).

consumer_filter_ref

string

Reference to a parameter.

consumer_filter_name

string

Reference to a filter by name.

consumer_filter_id

string

ID of a defined Scope or Inventory Filter.

provider_filter_ref

string

Reference to a parameter.

provider_filter_name

string

Reference to a filter by name.

provider_filter_id

string

ID of a defined Scope or Inventory Filter.

l4_params

array of l4params

List of allowed ports and protocols.

Attribute

Type

Description

proto

integer

Protocol integer value (NULL means all protocols).

port

integer

Inclusive range of ports, for example, [80, 80] or [5000, 6000] (NULL means all ports).

L4param object

Attribute

Type

Description

proto

integer

Protocol integer value (NULL means all protocols).

port

integer

Inclusive range of ports, for example, [80, 80] or [5000, 6000] (NULL means all ports).

Template sample

  {
    "name": "Allow HTTP/HTTPS and SSH",
    "parameters": {
      "HTTP Consumer": {
        "type": "Filter",
        "description": "Consumer of the HTTP and HTTPS service"
      },
      "HTTP Provider": {
        "type": "Filter",
        "description": "Provider of the HTTP and HTTPS service"
      }
    },
    "default_policies": [
      {
        "action": "ALLOW",
        "priority": 100,
        "consumer_filter_ref": "__rootScope",
        "provider_filter_ref": "__workspaceScope",
        "l4_params": [
          { "proto": 6, "port": [22, 22] },
        ]
      },
      {
        "action": "ALLOW",
        "priority": 100,
        "consumer_filter_ref": "HTTP Consumer",
        "provider_filter_ref": "HTTP Provider",
        "l4_params": [
          { "proto": 6, "port": [80, 80] },
          { "proto": 6, "port": [443, 443] }
        ]
      }
    ]
  }
Template import

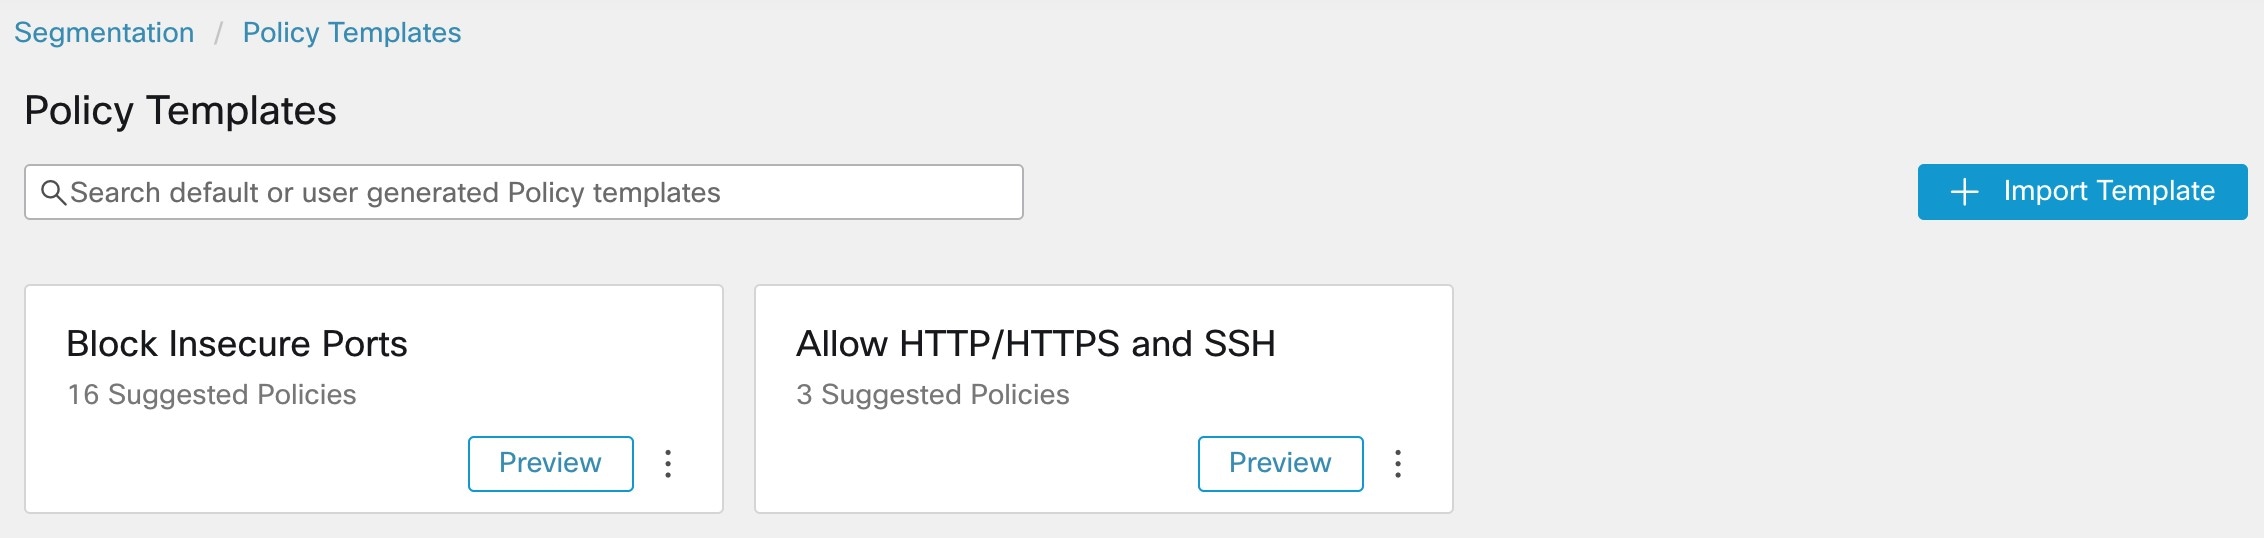
Policy Templates are shown on the Policy Templates page, accessible from the main Segmentation page. The templates can be imported or uploaded using the "Import Template" button.

Upload the templates for the system to validate. The system provides a list of errors to assist in debugging any issues.

After uploading a template, apply it, download it. You can also update its name and description.

Figure 4. Display of Available Templates
Display of available templates

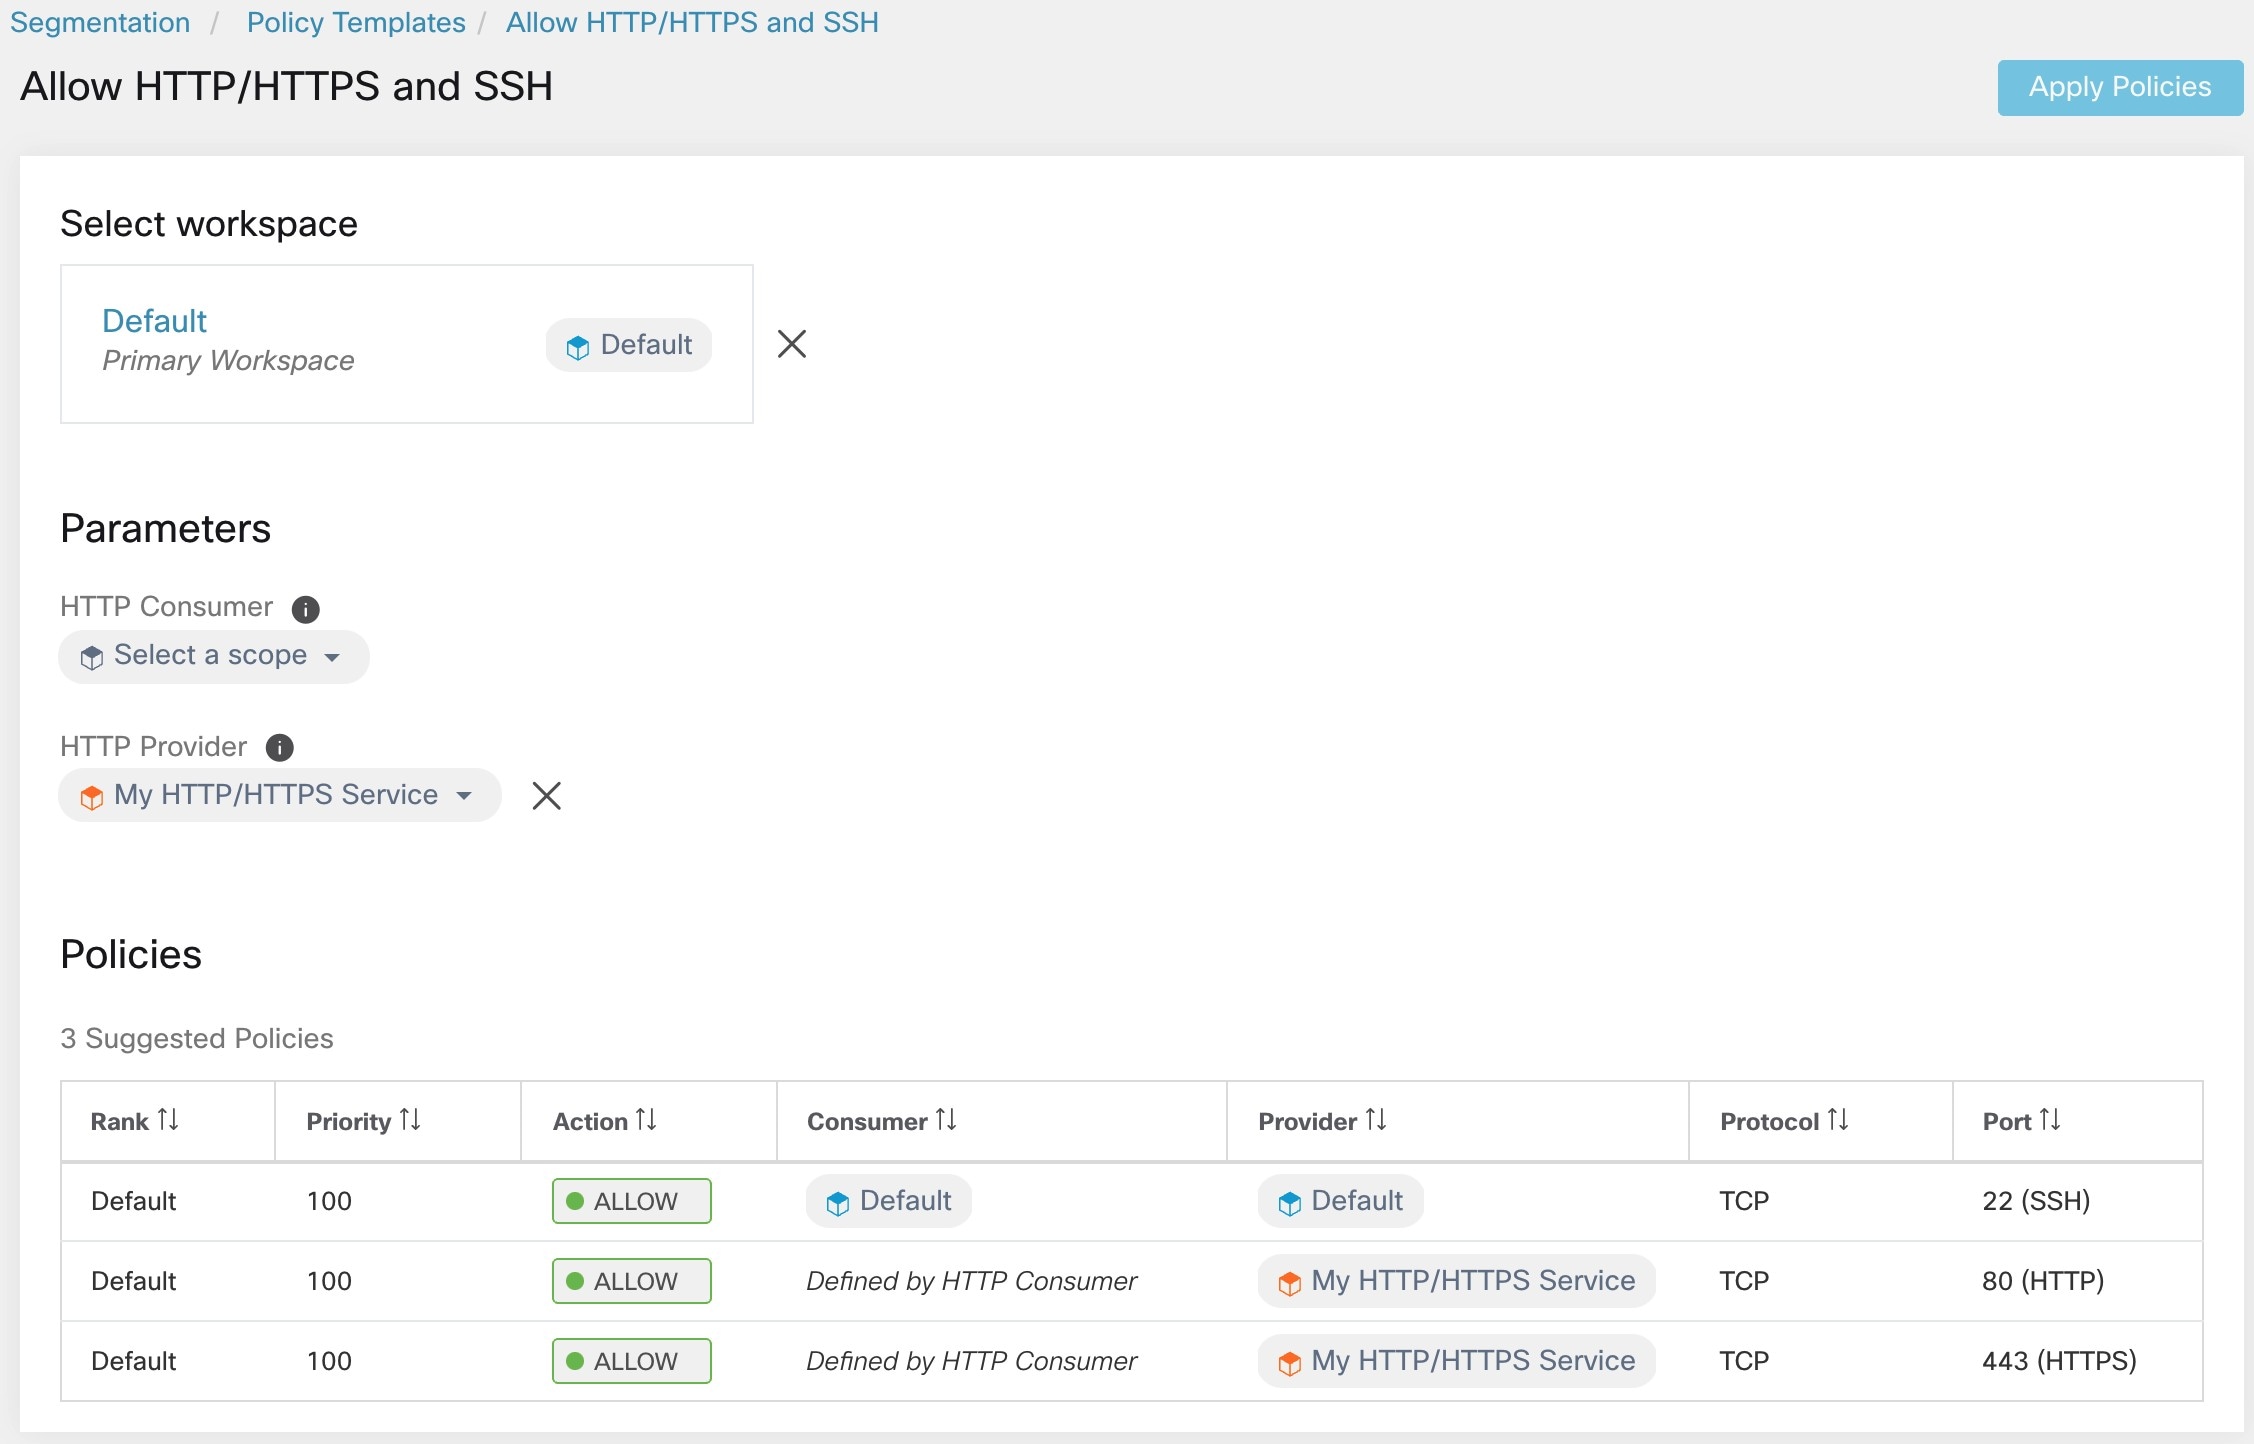
Applying a template

To apply a template to a workspace, perform these steps:

  1. Select a template to preview.

  2. Select a workspace to apply the template to.

  3. Fill in parameters if necessary.

  4. Review the policies.

  5. Apply the policies.

The policies will be added to the latest version of the selected workspace. Policies created via a template can be filtered using the From Template? = true filter.

Figure 5. Applying a Policy Template
Applying a policy template

Discover policies automatically

Automatic policy discovery, sometimes referred to as policy discovery, and formerly known as Application Dependency Mapping (ADM), uses existing traffic flows and other data to do the following:

  • Suggest a set of “allow” policies based on existing successful network activity.

    Identify the traffic that your organization needs, and block all other traffic.

  • Group workloads into clusters based on similarity of their computing behavior

    For example, if an application includes multiple web servers, they might be clustered together.

    For more information, see Clusters.

You can discover policies for each scope. Typically, you discover policies for scopes at or near the bottom of your scope tree, for example at the application level. However, for initial deployment, you might want to discover policies at a higher-level scope, so you have general, temporary policies in place while you create more refined policies.

You can discover policies as often as desired, to refine the suggested policies based on additional information.

You can manually modify the suggested policies and clusters, or approve them, ensuring they are retained and not modified by subsequent discovery runs.

You can include both manually created policies and discovered policies in a workspace.

After discovering policies, review and analyze them before enforcing them.

To get started discovering policies, see How to automatically discover policies.

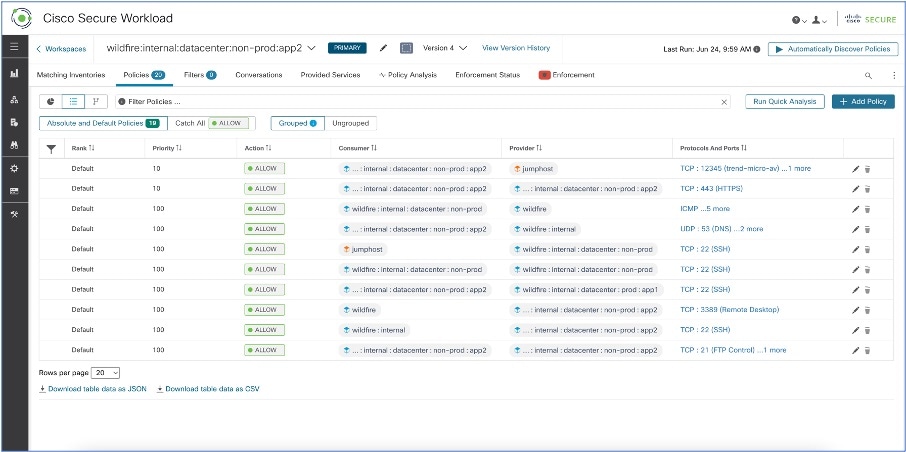
For more information, see Policy discovery details.

Figure 6. Example: Automatically Discovered Policies
Example: Automatically discovered policies

Policy discovery details

Additional information about automatic policy discovery:

  • Automatic policy discovery considers conversations in which at least one end is a member workload of the scope within the time range selected. Only current scope membership is considered.

  • By default, policy discovery produces policies and clusters by analyzing communication flows, such as conversations. It may also consider additional information, such as processes running on workloads or load balancer configurations.

  • You can discover policies in any workspace within the scope. Discovery results are independent across workspaces within the scope.

  • A cluster can run a maximum of 5 automatic policy discovery jobs at a time. Additional jobs are queued for later execution.

  • For detailed discussions bout complex concepts relating to automatic policy discovery, see Advanced features of automatic policy discovery and Address policy complexities.

How to automatically discover policies

This reference provides guidelines for automatically discovering policies within a networked environment and managing policy analysis, workflow management, and specific considerations during policy lifecycle.

Step

Do This

More Information

1

Upload and label your workload inventory and gather flow data essential for policy discovery.

See Get started with segmentation and microsegmentation and subtopics.

2

Choose whether you discover policies for:

  • Workloads in a single scope

  • Workloads in all of the scopes in a branch of the scope tree

See Discover policies for one scope or for a branch of the scope tree.

(You can always discover policies again at any time.)

3

Choose the scope in which you discover policies.

This depends in part on whether you discover policies for a single scope or for a branch of the scope tree.

4

Choose the workspace in which you discover policies.

Generally, discover policies in the scope's primary workspace because you can only analyze policies in a primary workspace. (However, you can always change a workspace to primary later.)

If your chosen scope does not yet have a workspace, see Create a workspace.

5

Confirm the inventory that you expect to include in policy discovery.

Verify the workloads to which policy discovery applies

6

(Optional) Create inventory filters to group workloads that you want to treat as a group.

See Create an inventory filter.

7

Set the Catch-all action for the workspace.

See Policy ranks: Absolute, Default, and Catch-All

8

Discover Policies

Discover policies automatically

Be sure to complete the prerequisites in the "Before You Begin" section.

9

View and manage the clusters (groups of workloads) that policy discovery creates.

(This step applies for a single scope; clusters are not generated for a branch of the tree.)

See Clusters and subtopics.

Evaluate the suggested clusters, optionally edit cluster membership as needed. Approve or convert any clusters to inventory filters to make them permanent.

10

Consider complexities such as policy inheritance and cross-scope policies.

See Address policy complexities.

11

Review generated policies.

See Review automatically discovered policies and subtopics

12

Approve policies that you want to keep.

Approve policies

13

Discover policies again as desired, to reflect additional flow data, changes in scope membership, or other changes.

Important: Before you re-run automatic policy discovery

Rerun policy discovery at any time.

Review and approve policies and clusters each time you discover policies.

14

Run live analysis to see how your policies affect your actual traffic.

When you believe that your policies do what you expect them to do, start Live policy analysis.

If you change policies or rediscover policies, restart policy analysis (to analyze the current policies).

15

If you re-discover policies or make other changes, restart live analysis.

See After changing policies, analyze latest policies.

16

Ensure policies do not block essential traffic, then enforce the workspace.

See Enforce Policies and subtopics.

17

Verify that enforcement is working as expected.

See Verify enforcement works as expected

18

(Optional) Configure default policy discovery settings that optionally apply when discovering policies in any workspace.

See Default policy discovery config and linked topics.

Because these are advanced settings, change them only if you have a specific need to change them. You can change them at any time during your process as you realize a need.

Discover policies for one scope or for a branch of the scope tree

If discovering policies for a particular scopen is not possible with either option, the system selects for you without providing multiple options.

Table 3. Discovering Policies For

A Branch of the Scope Tree

A Single Scope

Use this method as a starting point, when you begin using Secure Workload to quickly generate a temporary set of coarse policies that allow existing traffic and protect your network from future threats.

Use this method to fine-tune segmentation policies. It ensures all allowed flows are expected. Fewer policies makes it easier to identify existing anomalies requiring investigation.

Typically, you use this method for scopes nearer the top of your scope tree.

The top of the branch can be any scope in the tree.

Typically, you use this method for scopes at or near the bottom of your scope tree, for example for scopes dedicated to a single application.

Discover policies only in one scope – the scope at the top of the branch that you choose.

Discover policies for each scope in the branch as needed.

All workloads in the chosen scope and all child and descendant scopes are included in discovery.

Workloads that are also members of any child scope are not included in discovery for this scope.

Policies are generated only for workloads that appear in the Uncategorized Inventory tab for that scope, on the Organize > Scopes and Inventory page.

You can discover policies for workloads in child and descendant scopes separately.

All policies for workloads in all scopes in the branch reside in the scope at the top of the branch.

Assuming you also create policies for workloads in child and descendant scopes, policies reside in multiple scopes.

This method typically generates a large number of policies.

This method generates fewer policies in any individual scope.

Discovered policies apply to entire scopes; this option cannot create policies specific to subsets of workloads within scopes.

This option can generate policies that apply to subsets of workloads within either the consumer or provider scope or both. (Workloads can be grouped by generated clusters and/or by configured inventory filters, and policies applied just to these subsets.)

All policies are created in a single scope at the top of the branch, so extra steps are not required when a policy's consumer and provider are in different scopes.

Allowing traffic between consumers and providers in different scopes requires extra steps.

See When consumer and provider are in different scopes: policy options.

Discovery can run even if a scope does not have any member workloads with installed agents, as long as descendant scopes have agents or external orchestrators or connectors that gather flow data.

The scope must have member workloads with installed agents or external orchestrators or connectors that gather flow data.

This option is available to root scope owners and site admins only.

You must have privileges to create policies for this scope.

The maximum number of agents and conversations is different for each option. See Limits Related to Policies.

This option was formerly the Deep Policy Generation advanced configuration option for automatic policy discovery. The behavior has not changed.

This was formerly the default behavior for automatic policy discovery.

For additional details, see Discovering policies for a branch of the scope tree: additional information.

--

Discovering policies for a branch of the scope tree: additional information
  • All workloads that are conversation endpoints, whether or not they are members of the scope in which policy discovery is run, are assigned the highest matching scope label according to the top-down order given in the external dependencies list.

  • For advanced configuration options when generating policies for a branch of the scope tree, see:

  • The count of workloads shown for automatic policy discovery includes only those that are not members of a subscope.

Verify the workloads to which policy discovery applies

Before automatically discovering policies, verify that the set of workloads used fconor policy discovery matches your expectations. Discovered policies will be generated from flow data captured by agents on these workloads.

Before you begin

Decide which of the options in Discover policies for one scope or for a branch of the scope tree you will apply.

Procedure

Step 1

Choose Defend > Segmentation.

Step 2

Select the desired scope for policy discovery.

Step 3

Choose the relevant workspace.

Step 4

Click Manage Policies.

Step 5

Click Matching Inventories.

Step 6

If you discover policies for a single scope:

  1. Click Uncategorized Inventory.

    This page shows workloads that are not members of child scopes. (In standard automatic policy discovery, policies and clusters are generated in this scope only for workloads that are not members of child scopes.)

  2. Click IP addresses.

    IP addresses on this page do not have Secure Workload agents installed.

    Therefore, these IP addresses are not considered during automatic policy discovery for this scope unless:

    • The policy is managed via a cloud connector.

    • The IP addresses are container-based inventory, in which case individual workloads appear on the Pods tab, or

    • The workloads happen to communicate with a workload in this scope that is considered during policy discovery.

    Before discovering policies, install necessary agents on workloads that need them and allocate time for flow data to accumulate.

  3. Click Workloads.

    Policies and clusters are generated only for workloads on this page and for IP addresses on the IP addresses tab that meet the criteria specified above for consideration.

  4. If you have Kubernetes or OpenShift inventory, you will see a Services tab and a Pods tab.

    Ensure you check the inventory on Kubernetes/OpenShift workloads tabs if agents are installed.

  5. If you have load-balancer inventory, that inventory appears on the Services tab.

Step 7

If you discover policies for a branch of the tree:

  1. Click All Inventory

    This process generates policies (but not clusters) for all workloads in this scope, whether they are also members of child scopes.

  2. Click IP addresses.

    IP addresses on this page do not have Secure Workload agents installed.

    Therefore, these IP addresses will not be considered during automatic policy discovery for this scope unless:

    • Policy is managed via a cloud connector

    • The IP addresses are container-based inventory, in which case individual workloads appear on the Pods tab, or

    • The workloads communicate with a workload in this scope that is considered during policy discovery.

    Before discovering policies, consider installing agents on these workloads and allowing some time to pass for flow data to accumulate.

  3. Click Workloads.

    Policies are generated only for workloads on this page and for IP addresses on the IP addresses tab that meet the criteria specified above for consideration.

  4. If you have Kubernetes or OpenShift inventory, you will see a Services tab and a Pods tab.

    If you have installed agents on your Kubernetes/OpenShift workloads, check the inventory on those tabs as well.

  5. If you have load-balancer inventory, that inventory appears on the Services tab.

Step 8

Verify that the workloads are the set you expect.


Automatically discover policies

Use this procedure to generate suggested Allow policies based on existing traffic on your network.

You can rediscover policies at any time.

Before you begin
  • Gather flow data to effectively discover policies automatically.

    Typically, this means you have installed agents on the workloads in the scope, or have configured and gathered data using a cloud connector or external orchestrator.

    Automatic policy discovery uses flow summary data that is computed every 6 hours. Thus, upon initial deployment of Secure Workload, automatic policy discovery is not possible until such data is available.

    More flow data generally produces more accurate results.

    Before enforcing a policy, gather enough data to include traffic that occurs only periodically (monthly, quarterly, annually, and so on.). For example, if an application generates a quarterly report that gathers information from sources that the application does not access at other times, ensure that the flow data includes at least one instance of that report-generation process.

  • Complete preliminary steps from How to automatically discover policies.

  • Ensure policy discovery limits are met. If necessary, break larger scopes into smaller child scopes. For more information, refer to Limits Related to Policies.

  • Commit scope changes before discovering policies. For more information, refer to Commit changes (concept).


Important


If you choose to rerun policy discovery, refer to the important considerations first: Important: Before you re-run automatic policy discovery.


Procedure

Step 1

Choose Defend > Segmentation.

Step 2

Locate the scope for which you want to generate policies.

Step 3

Select a workspace (primary or secondary) in the scope.

Step 4

Click Manage Policies.

Step 5

Click Automatically Discover Policies.

Step 6

Choose an option to discover policies for a branch or an entire scope.

If you do not see an option, only one option is possible for the scope for which you are discovering policies.

For more information, see Discover policies for one scope or for a branch of the scope tree.

Step 7

Select the time range for the flow data that you want to include.

Experiment to find the right time range; you can generate policies as often as needed to get optimal results.

A shorter time range generates faster results, and may generate fewer results.

A longer time range produces more accurate policies. However, if the scope definition has changed, do not include dates before the change is made.

Your time range should include traffic that occurs only periodically (monthly, quarterly, annually, and so on.) if applicable. For example, if an application generates a quarterly report that gathers information from sources that it does not access at other times, be sure that the time range includes at least one instance of that report-generation process.

Select the custom range to configure a time range beyond the last 30 days. Fill the required start and end times under the drop-down time selection widget.

Step 8

Optionally, configure advanced settings.

Generally, we suggest not changing advanced settings for initial discovery runs and making changes only as needed to address specific issues.

For details, see Advanced configurations for automatic policy discovery.

Step 9

Click Discover Policies. Generated policies will appear on this page.


What to do next

Stop automatic policy discovery in progress

To stop the automatic policy discovery, perform these steps:

  1. Observe the automatic policy discovery progress, displayed in the header of the main screen.

  2. Click abort to manually stop the policy discovery process.

    After the discovery process is complete, a confirmation message appears.

  3. Click the Click to see results link to review the partial results of discovered policies.

Figure 7. Automatic Policy Discovery Progress
Automatic Policy Discovery Progress

Advanced features of automatic policy discovery

Specify a time range for the discovery process. Configure advanced options for each workspace, set defaults for all workspaces (the entire root scope), and modify the settings for individual workspaces as needed.

Table 4. Configure Advanced Options for Automatic Policy Discovery

For a Workspace

For All Workspaces

Option descriptions for individual workspaces (in column 1) also apply to all workspaces (in column 2)

External dependencies

Default policy discovery config

Advanced configurations for automatic policy discovery

Default policy discovery config

Policy discovery flow filters

Default exclusion filters

External dependencies

External dependencies are relevant only when using the process outlined in (Advanced) Create cross-scope policies.

External Dependencies settings apply to policies that are automatically discovered when communicating with workloads that are members of a scope other than the scope where policies are discovered.

An external workload refers to a workload that is not a member of the scope in which the policy exists. These workloads are the other end of a conversation with a target workload (which is a member of the scope in which the policy exists.

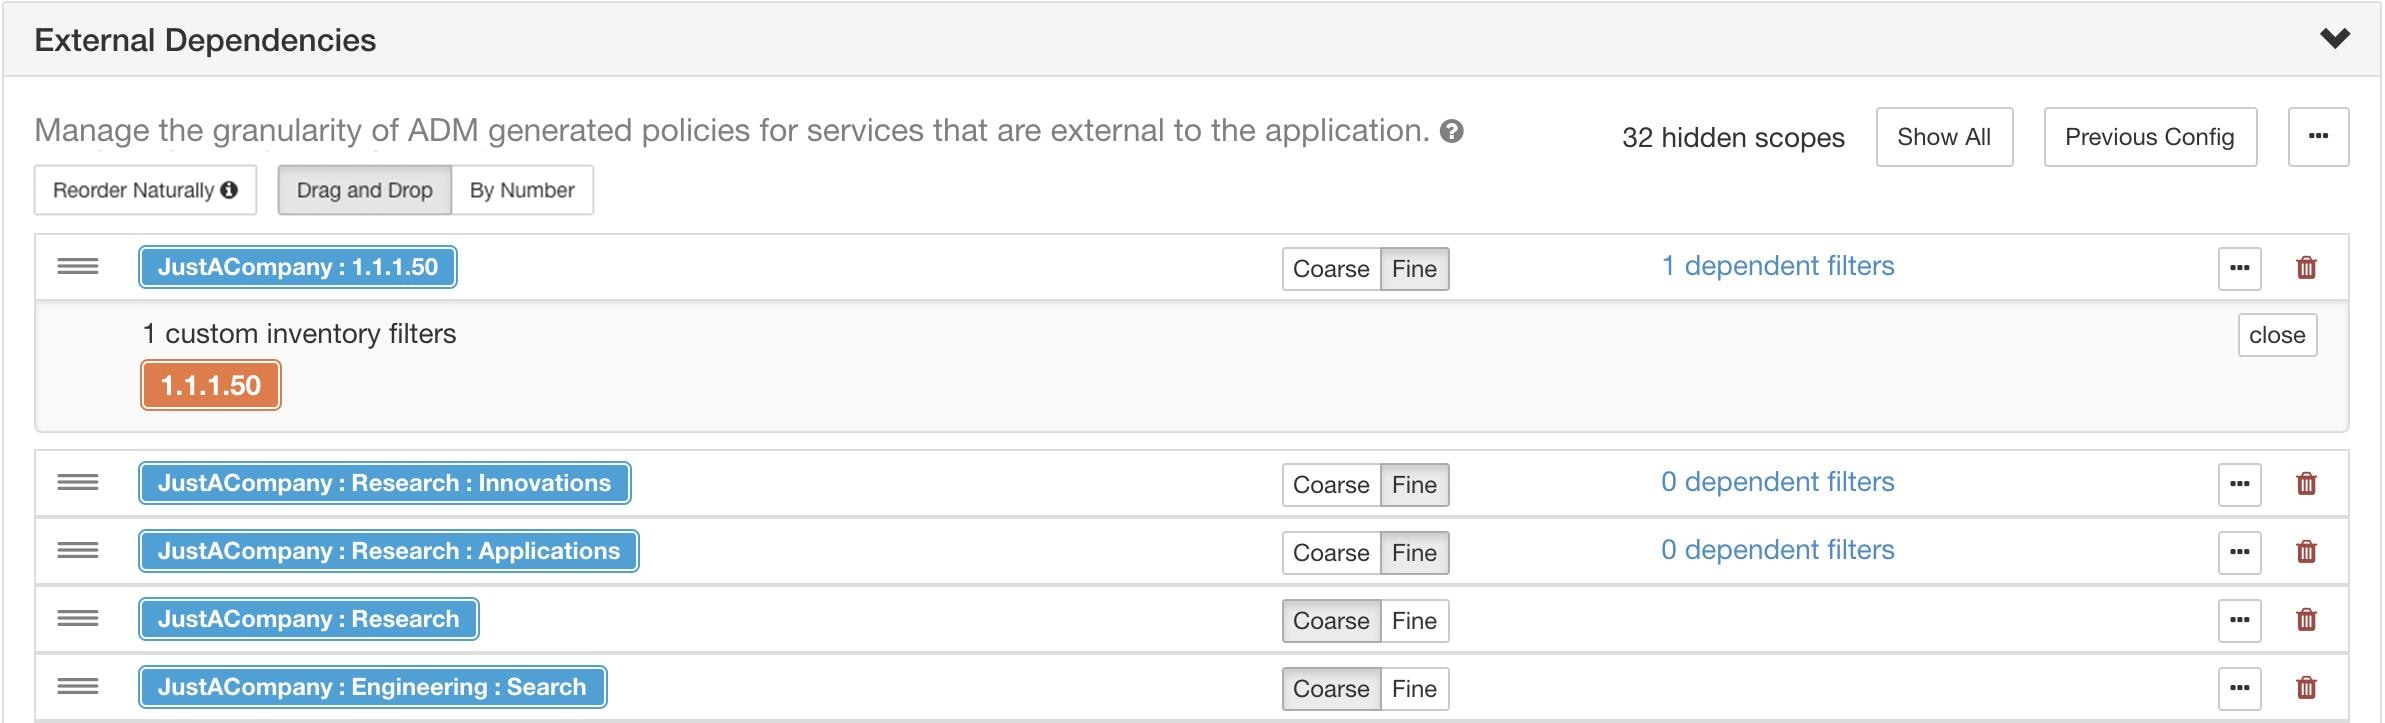
The External Dependencies list consists of all scopes in your hierarchy. Each scope is configured as one of these options:

  • Generate specific or refined policies to enhance security,

  • Generate coarse policies in higher scopes.

During policy discovery, the first scope or cluster, or inventory filter that matches the workload is used to generate the “allow” policy. The matching order and granularity level is determined by the top-down ranking that is displayed in the External Dependencies section.

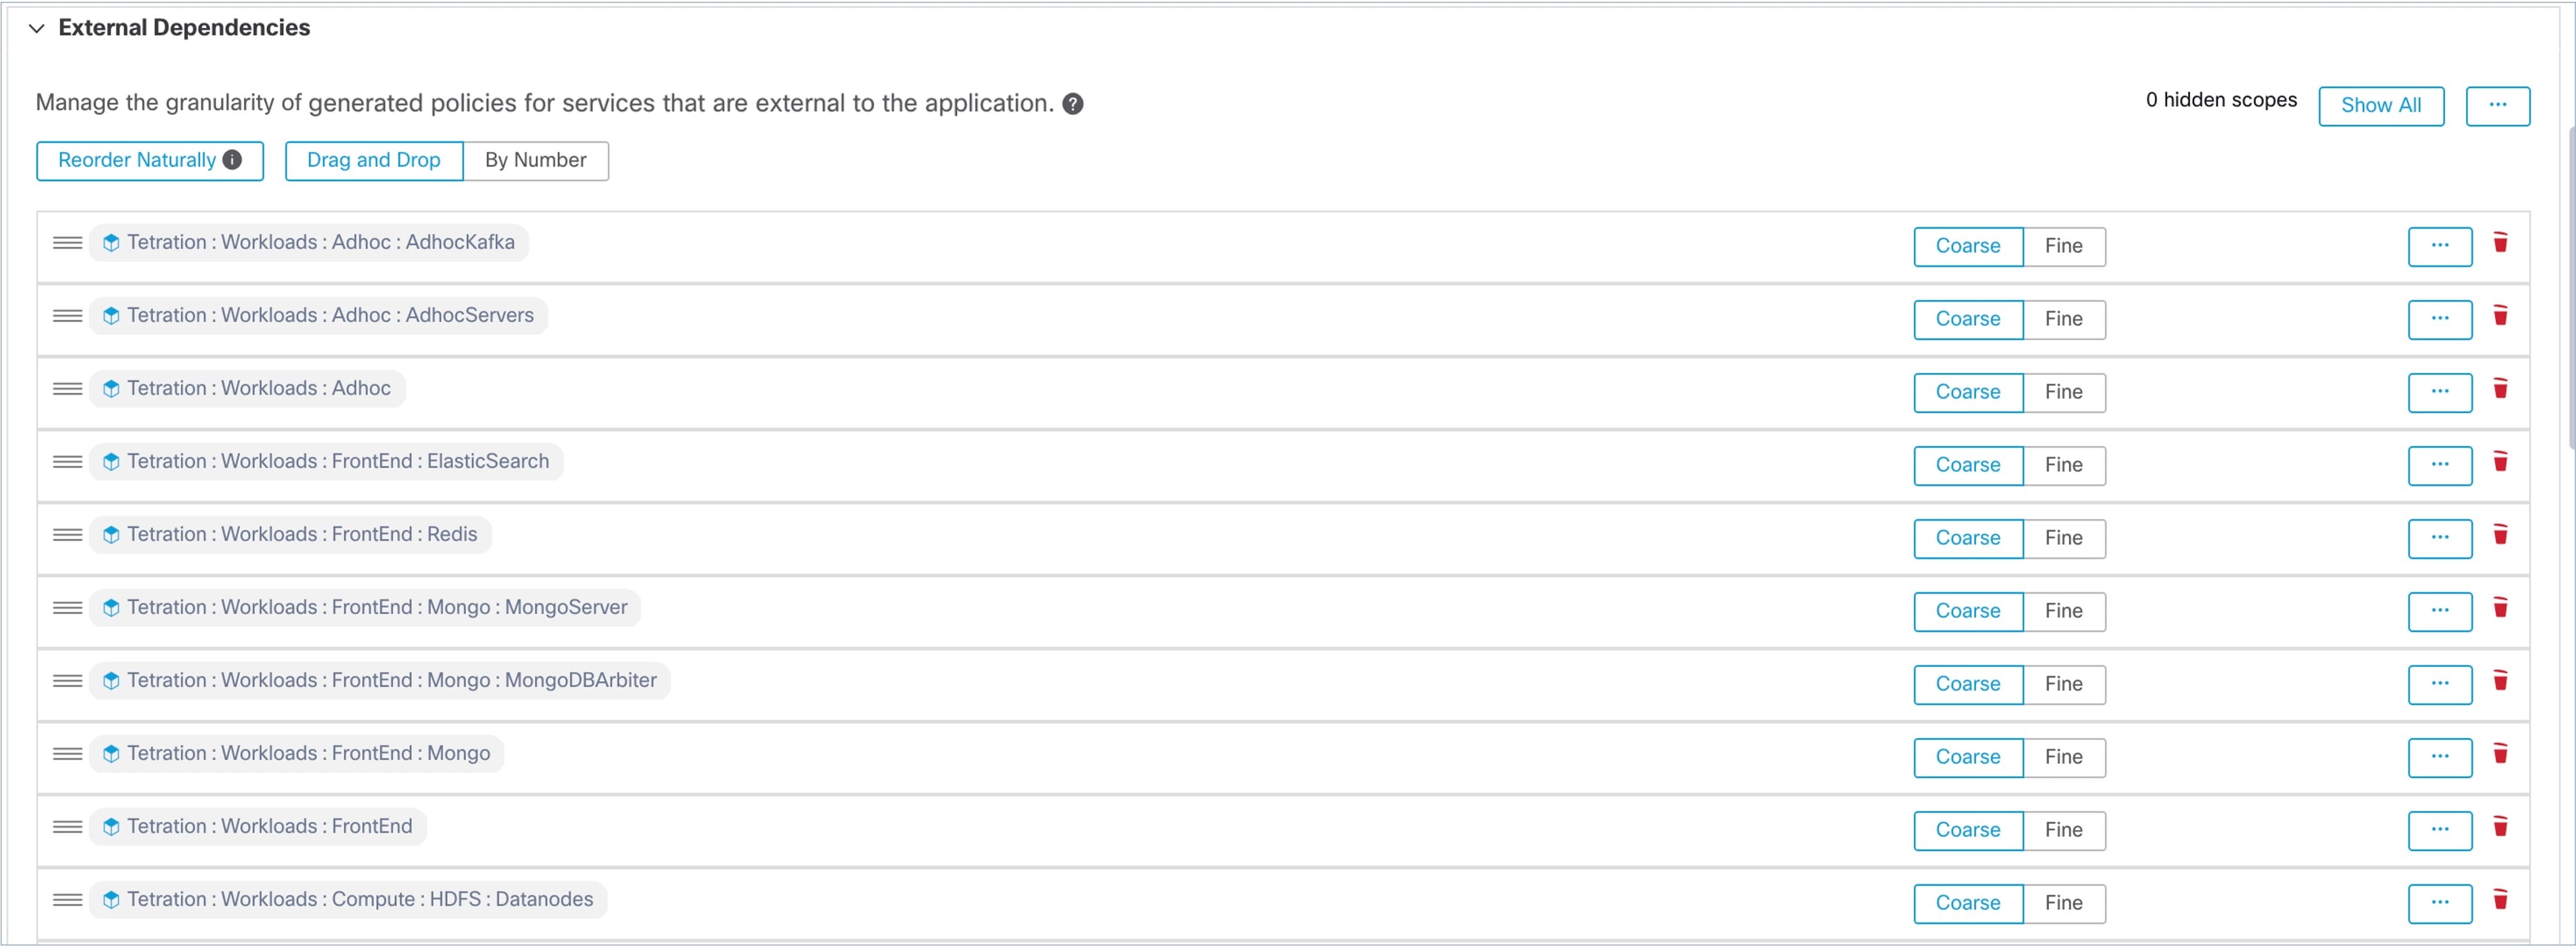
The default scope order, configured for all users, sets all scopes to "Coarse".

Figure 8. Default External Dependencies
Default External Dependencies

To

Do This

View or fine-tune external dependencies for a workspace:

Navigate to the workspace and click Automatically Discover Policies, then click External Dependencies.

To reorder the scopes and select granular options, refer to Fine-tune external dependencies for a workspace.

Configure default external dependencies for an entire root scope:

See Default policy discovery config.

External Dependencies: Granular Policies Involving Subsets of Scopes

You can optionally discover policies at a more granular level than scope-to-scope, to control traffic to a specified subset of the workloads in a scope.

For example, you may want to create policies specific to a certain type of host within an application, such as API servers; you can group those workloads into a subset within the application scope.

To generate policies specific to a subset of workloads within a scope, refer to Fine-tune external dependencies for a workspace.

Tips for exploring external dependencies

Use these tips to explore the behavior of automatic policy discovery for policies involving workspaces that are not members of the scope that is associated with the workspace in which the policies reside.


Tip


  • You can remove and rearrange the list to generate policies at a desired granularity. For example, removing all Company: RTP subscopes will help generate wide policies to the whole Company:RTP scope, but not its individual components, while maintaining the higher granularity for Company: SJC scope. Click Fine next to any scope to check if there are finer grain candidates defined under that scope.

  • By default, the root scope is configured as the lowest entry in the External Dependencies list, so that automatic policy discovery always generates policies to more specific scopes whenever possible. Initially, to view relatively few coarse-grained policies, you can temporarily place the root scope on the top of the external dependencies. This way, after automatic policy discovery, you will see all external policies of the workspace connecting to a single scope, the root scope (as every external workload maps to the root scope). The generated policies are fewer and easier to examine and comprehend.

  • Temporarily cluster all workloads that are members of the scope associated with the workspace ("internal workloads") into one cluster, approve the cluster, and then discover policies. Again, this results in a reduced set of policies, as no clustering (subpartitioning of the workspace/scope) takes place, so you can view policies that are either internal (connect to internal workloads), or external (connect an internal to an external workload). Subsequently, you can explore increasingly refined policies by unbundling internal workloads and/or placing one or a few external scopes of interest above the root.

  • Examine policies involving the root scope carefully. These policies allow all traffic to and from the entire network. This is especially important when the root scope is placed low in the External Dependencies list and it is not your intention to generate coarse policies. Such policies might not have arisen due to network-wide traffic inside or outside workspace scope. Rather they can be triggered by a few external endpoints which failed to receive finer scopes or inventory filter assignments beyond simply the root scope.

    While auditing these policies, you should examine the associated conversations (See Conversations) to identify these endpoints and subsequently categorize them into finer scopes or inventory filters, to avoid less-secure policies at the root-scope level.


Fine-tune external dependencies for a workspace

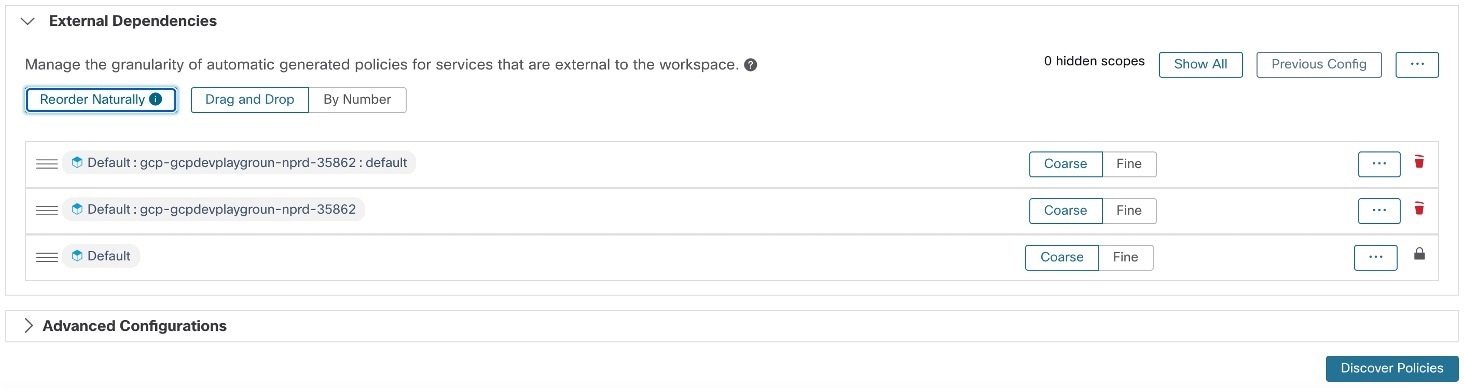
Use this procedure to create policies between specified subsets of workloads within scopes (rather than between entire scopes) during automatic policy discovery, when the provider of a policy belongs to a different scope than the scope in which policies are being discovered.

Figure 9. Fine-tuning External Dependencies
Fine-tuning External Dependencies
Before you begin
Procedure

Step 1

Navigate to the workspace in which you will discover policies.

Step 2

Click Automatically Discover Policies.

Step 3

Click External Dependencies.

Step 4

Click Show All scopes, if necessary.

Step 5

Optionally, use the previous configurations:

  • Click Previous Config to reuse the changes you made to the list the last time you discovered policies.

  • Set up external dependencies using the global “Default Policy Discovery Config”. Click Default Config to use the global list. Or, after obtaining the default list, modify it as needed for that workspace, and then click Previous Config to apply the customized version on subsequent runs.

Step 6

Reorder scopes and inventory filters, if applicable, as needed.

Apply the policy based on the first scope or inventory filter in the list (starting from the top) that matches the traffic. For this purpose, you generally want to apply the most specific policy that matches traffic, so you want child scopes (more specific) above their parents (less specific).

  • After creating new child scopes, which are added to the bottom of the list by default, reorder the entire list to place child scopes above their parents:

    (Recommended) Click Reorder Naturally.

    Figure 10. Reorder naturally
    Reorder naturally
  • (If you have a specific reason) To reorder the list manually:

    • Click Drag and Drop.

    • Click By Number:

      External dependencies will be assigned priority values in multiples of 10. Modify these values to change the order.

      Once numbers are modified, click View to update the order of the list and reassign multiples of 10 to each of the priorities.

Step 7

Specify granularity for each row:

  • Click Fine for each row to generate policies specific to configured inventory filters or clusters.

    Click Coarse to generate policies that apply to the entire scope.

  • To apply granularity to all subscopes of a scope: Click Button with three dots at the end of the scope's row.


Policy discovery flow filters

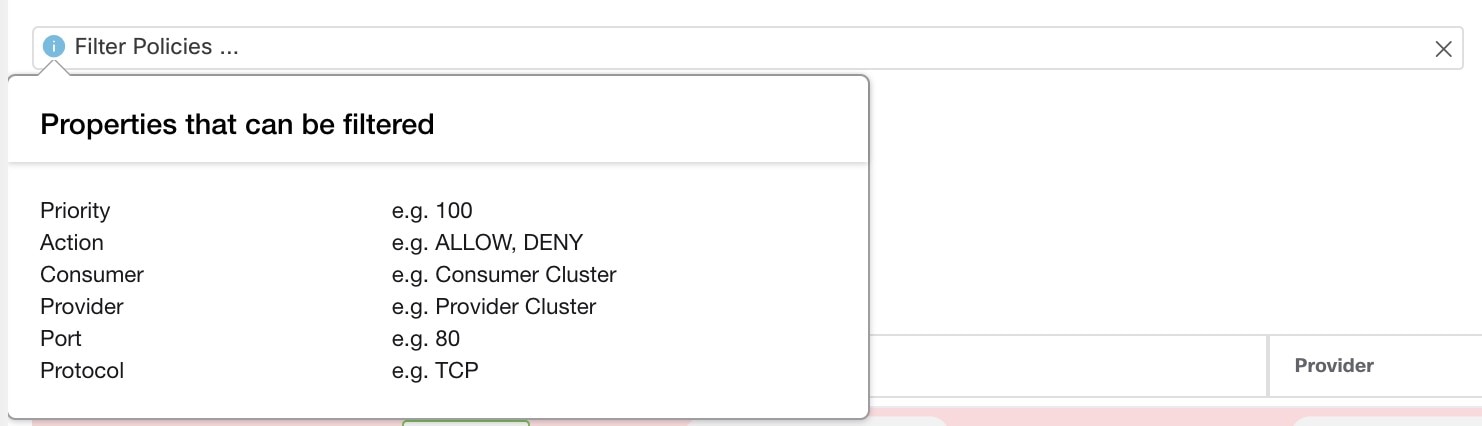
If certain flows are generating unwanted policies, you can exclude those flows from automatic policy discovery using exclusion filters. For example, in the final allow list model, you can create an exclusion filter with a protocol field set to ICMP for certain protocols like ICMP.


Note


  • Conversations matching exclusion filters are excluded from policy generation and clustering, yet remain visible in the Conversations View, marked with a red ‘excluded’ icon (see the Table View in Conversations). Also, workloads of the workspace incident on such conversations remain viewable as well.

  • An exclusion filter that uses a cluster or a filter definition from a workspace is effective only in primary workspaces. Otherwise, its cluster definitions are not visible to the label system, and any matching conversations are not excluded.

  • Exclusion filters are versioned and to track modifications, refer to Activity Logs and Version History.

  • For information about limits on the number of exclusion filters, refer to Limits Related to Policies.


Create one or both of the exclusion filters and then enable them when discovering policies:

  • A list of exclusion filters for each workspace.

  • A list of default exclusion filters available to all workspaces in your tenant.

You can enable or disable either or both lists for the Default Policy Discovery Config.

Configure, edit, or delete inclusion flow filters

Use this procedure to create a list of inclusion filters for a single workspace, or a list of default inclusion filters that are available for all workspaces.

Procedure

Step 1

Do one of the following:

To

Do This

Configure inclusion filters for a specific workspace

From the navigation pane, choose Defend > Segmentation, choose the workspace and click Manage Policies.

  • Click on the workspace for which you need to create the inclusion filter, expand the More drop-down list below AI Policy Discovery. From the drop-down list, choose PolicyDiscovery Flow Filters.

  • From the PolicyDiscovery Flow Filters page, click Create Flow Filter.

  • To create an inclusion filter, click the Inclusion tab and enter the details in the Create Flow Filter window.

Configure default inclusion filters that are available in any workspace

  • From the navigation pane, choose Defend > Segmentation,

  • Click the caret to expand the Tools menu and choose AI Policy Policy Discovery Configuration.

  • Scroll to the bottom of the page.

  • Click Default Flow Inclusion Filters.

Step 2

Specify the parameters for the flows to include from consideration during policy discovery:

You do not need to enter values for all the fields. Any empty field is treated as a wildcard for matching flows.

Any conversation that matches all the fields of any inclusion filter is ignored for the policy creation and clustering.

Option

Description

Consumer

Matches conversations where the consumer address is a member of the selected scope, inventory filter, or (for workspace-specific exclusion filters only, cluster). You can specify any arbitrary address space by creating a new custom filter.

Provider

Matches conversations where the provider address is a member of the selected scope, inventory filter, or (for workspace-specific exclusion filters only, cluster). You can specify any arbitrary address space by creating a new custom filter.

Protocol

Matches conversations with specified protocol.

Port

Matches conversations with provider (server) port matching the specified port, or port range. Enter port ranges using a dash separator, for example, “100-200”

Step 3

To edit or delete an inclusion filter, click either Edit or Delete.

Step 4

If you are configuring default inclusion filters:

When the configured filters are ready to use, return to the Default Policy Discovery Configuration page, and click Save to make the changes available to individual workspaces.


What to do next

Important


Before discovering policies, ensure that:

  • Inclusion filters are enabled by default in all workspaces.

  • Both types of inclusion filters are enabled in the Default Policy Discovery Configuration.


For more information, see Enable or disable inclusion flow filters.

Commit any scope changes, or the filters may not match (and therefore include) the expected flows. For more information, refer to Commit changes (concept).

Enable or disable inclusion flow filters

You can create policy discovery flow filters in each workspace or set default filters for all workspaces.

Both types of policy discovery flow filters are enabled by default. To enable or disable policy discovery filters for a single workspace:

  • From the navigation pane, choose Defend > Segmentation and enable policy discovery flow filters or default policy discovery flow filters for this workspace.

  • Click the caret to expand the Tools menu and choose AI Policy Policy Discovery Configuration.

  • Click Default Flow Inclusion Filters at the bottom of the page.

Configure, edit, or delete exclusion filters

Create exclusion filters for a single workspace or create default exclusion filters available to all workspaces.

Procedure

Step 1

Do one of the following:

To

Do This

Configure exclusion filters for a specific workspace

Navigate to the workspace. Then do one of these actions:

  • Click Manage Policies, then click More button near the top right of the page and select Exclusion Filters.

  • From the automatic policy discovery configuration page, click the Exclusion filters link in the Advanced Configurations section.

  • Delete a discovered policy; you will see an option to create an exclusion filter.

Configure default exclusion filters that are available to any workspace

  1. Choose Defend > Segmentation,

  2. Click the caret to expand the Tools menu, then choose Default Policy Discovery Config.

  3. Scroll to the bottom of the page.

  4. Click Default Exclusion Filters.

Step 2

To create an exclusion filter, click Add Exclusion Filter.

Step 3

Specify parameters for the flows to exclude from consideration during policy discovery:

Do not enter values for all fields. Empty fields are treated as wildcards for matching flows. Conversations matching all fields of any exclusion filter are ignored for policy creation and clustering.

Option

Description

Consumer

Matches conversations where the consumer address is a member of the selected scope, inventory filter, or (for workspace-specific exclusion filters only, cluster). You can specify any arbitrary address space by creating a new custom filter.

Provider

Matches conversations where the provider address is a member of the selected scope, inventory filter, or (for workspace-specific exclusion filters only, cluster). You can specify any arbitrary address space by creating a new custom filter.

Protocol

Matches conversations with specified protocol.

Port

Matches conversations with provider (server) port matching the specified port, or port range. Enter port ranges using a dash separator, for example, "100–200".

Step 4

To edit or delete an exclusion filter, hover over the applicable row to see the Edit and Delete.

Step 5

If you are configuring default exclusion filters:

When the configured filters are ready to use, return to the Default Policy Discovery Config page, and click Save to make the changes available to individual workspaces.


What to do next

Important


Exclusion filters are enabled by default in the workspace in which they are configured.

Default exclusion filters are enabled in all workspaces.

Both types of exclusion filters are enabled by default in the Default Policy Discovery Config.


Before discovering policies:

  • Enable or disable exclusion filters and default exclusion filters in each workspace and on the Default Policy Discovery Config page

    For detailed instructions, refer to Enable or disable exclusion filters.

  • Commit any scope changes, or the filters may not match (and therefore exclude) the expected flows. For more information, refer to Commit changes (concept).

Enable or disable exclusion filters

You can create exclusion filters in each workspace or create a set of default exclusion filters that you can apply to all workspaces.

By default, both types of exclusion filters are enabled, allowing you to update settings as necessary.

  • To enable or disable exclusion filters for a single workspace.

    In the workspace, click Manage Policies, then click Automatically Discover Policies, then click Advanced Configurations.

  • To enable or disable exclusion filters in the Default Policy Discovery Config.

    Choose Defend > Segmentation, then click the caret at the right side of the page to expand the Tools menu. Then choose Default Policy Discovery Config. Scroll to or click Advanced Configurations.

Advanced configurations for automatic policy discovery

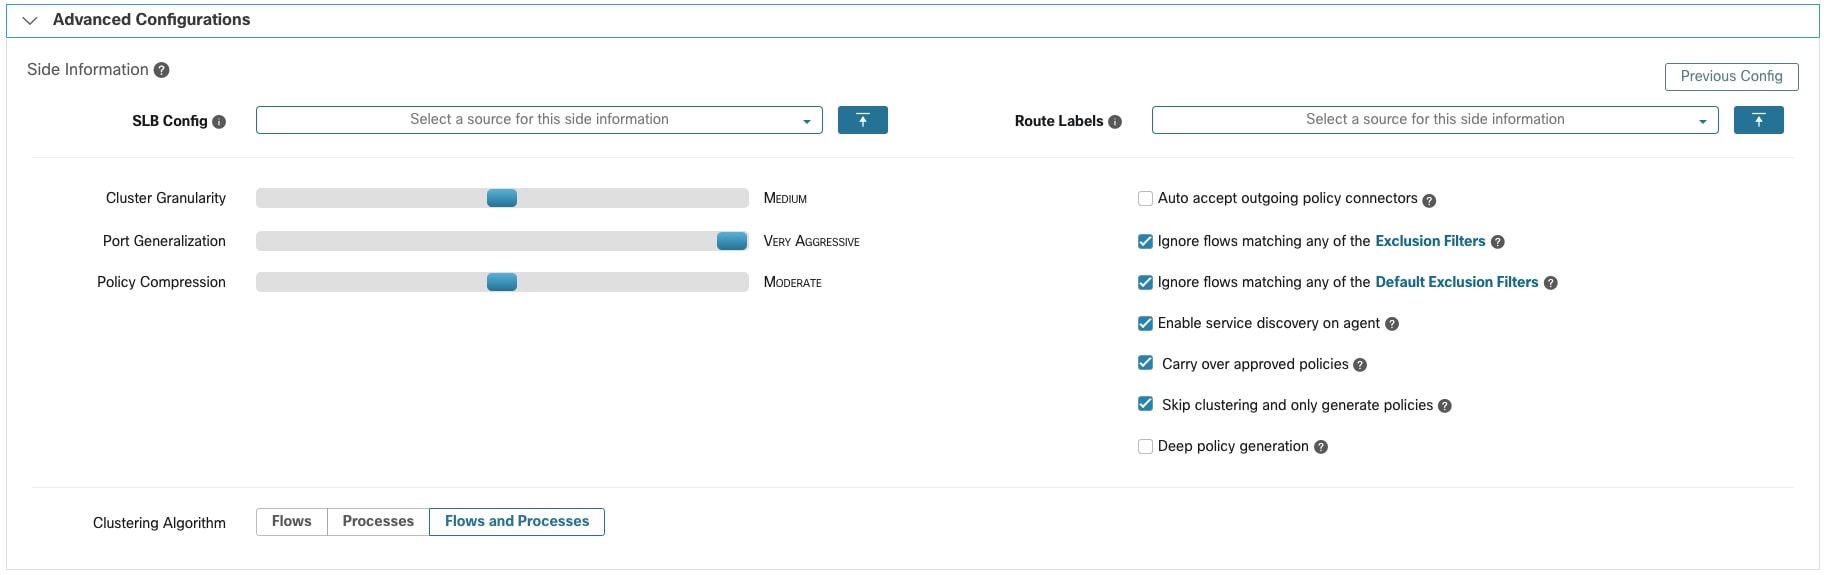
Use advanced settings to include additional information when discovering policies or to adapt to a particular environment.

  • To access these settings for a specific workspace, click Automatically Discover Policies in the applicable workspace.

  • To change the defaults for all workspaces, refer to Default policy discovery config.

Figure 11. Advanced Automatic Policy Discovery Configurations
Advanced Automatic Policy Discovery Configurations
Cluster granularity

Clustering Granularity allows you to control the size of clusters generated by automatic policy discovery.

  • Fine—Generates more clusters, but they are smaller in size.

  • Coarse—Generates fewer clusters, but they are larger in size.


Note


You may not observe a significant change in the results because the algorithms consider use various signals. For example, if there is a high confidence in the generated clusters, changing this control will cause little change.


Port generalization

The Port Generalization option in Advanced Configurations for automatic policy discovery controls the level of statistical significance required when performing port generalization, in other words, replacing numerous ports being used as server ports on a single workload, with a port interval.

This configuration can affect accuracy, number, and compactness of policies, and the time required to generate them.

To disable port generalization, move the slider, although note that when you disable it, rendering may slow down due to high port usage.

When the slider moves to the right for more aggressive generalization, less evidence is required to create port-intervals, and the criteria for replacing original policies (involving single ports) with port intervals is relaxed.

Background

In some scenarios, applications like Hadoop may use a wide range of changing many server ports, for example, between 32000 and 61000. Automatic policy discovery attempts to identify such behaviors for each workload, generalizing ports into intervals like 32000 to 61000 so that it generates fewer policies. This generalization ensures robust future policies and faster rendering times when merged effectively.

You can control the degree of port generalization including disabling it.

Policy compression

When policy compression is enabled, if policies in multiple clusters in the workspace are similar, then one or more policies applicable to the entire parent scope can replace those policies. For example, if all clusters in the workspace provide the same port for the same consumer, then one policy in the parent scope replaces all cluster-specific policies. This change significantly reduces the number of policies significantly, minimizes clutter, and may allow legitimate future flows that would have been dropped (accurate generalization).

More aggressive compression settings lead to lower thresholds for policy frequency. This enables the replacement of cluster-specific policies with a single policy applicable to the entire parent.

When generating policies for a branch of the scope tree:

Use this knob to alter the level of compression in Hierarchical policy compression.


Note


The Automatic policy discovery conversations page does not display conversations leading to a compressed policy, so you may need to disable compression or use flow search to view these conversations.


Hierarchical policy compression

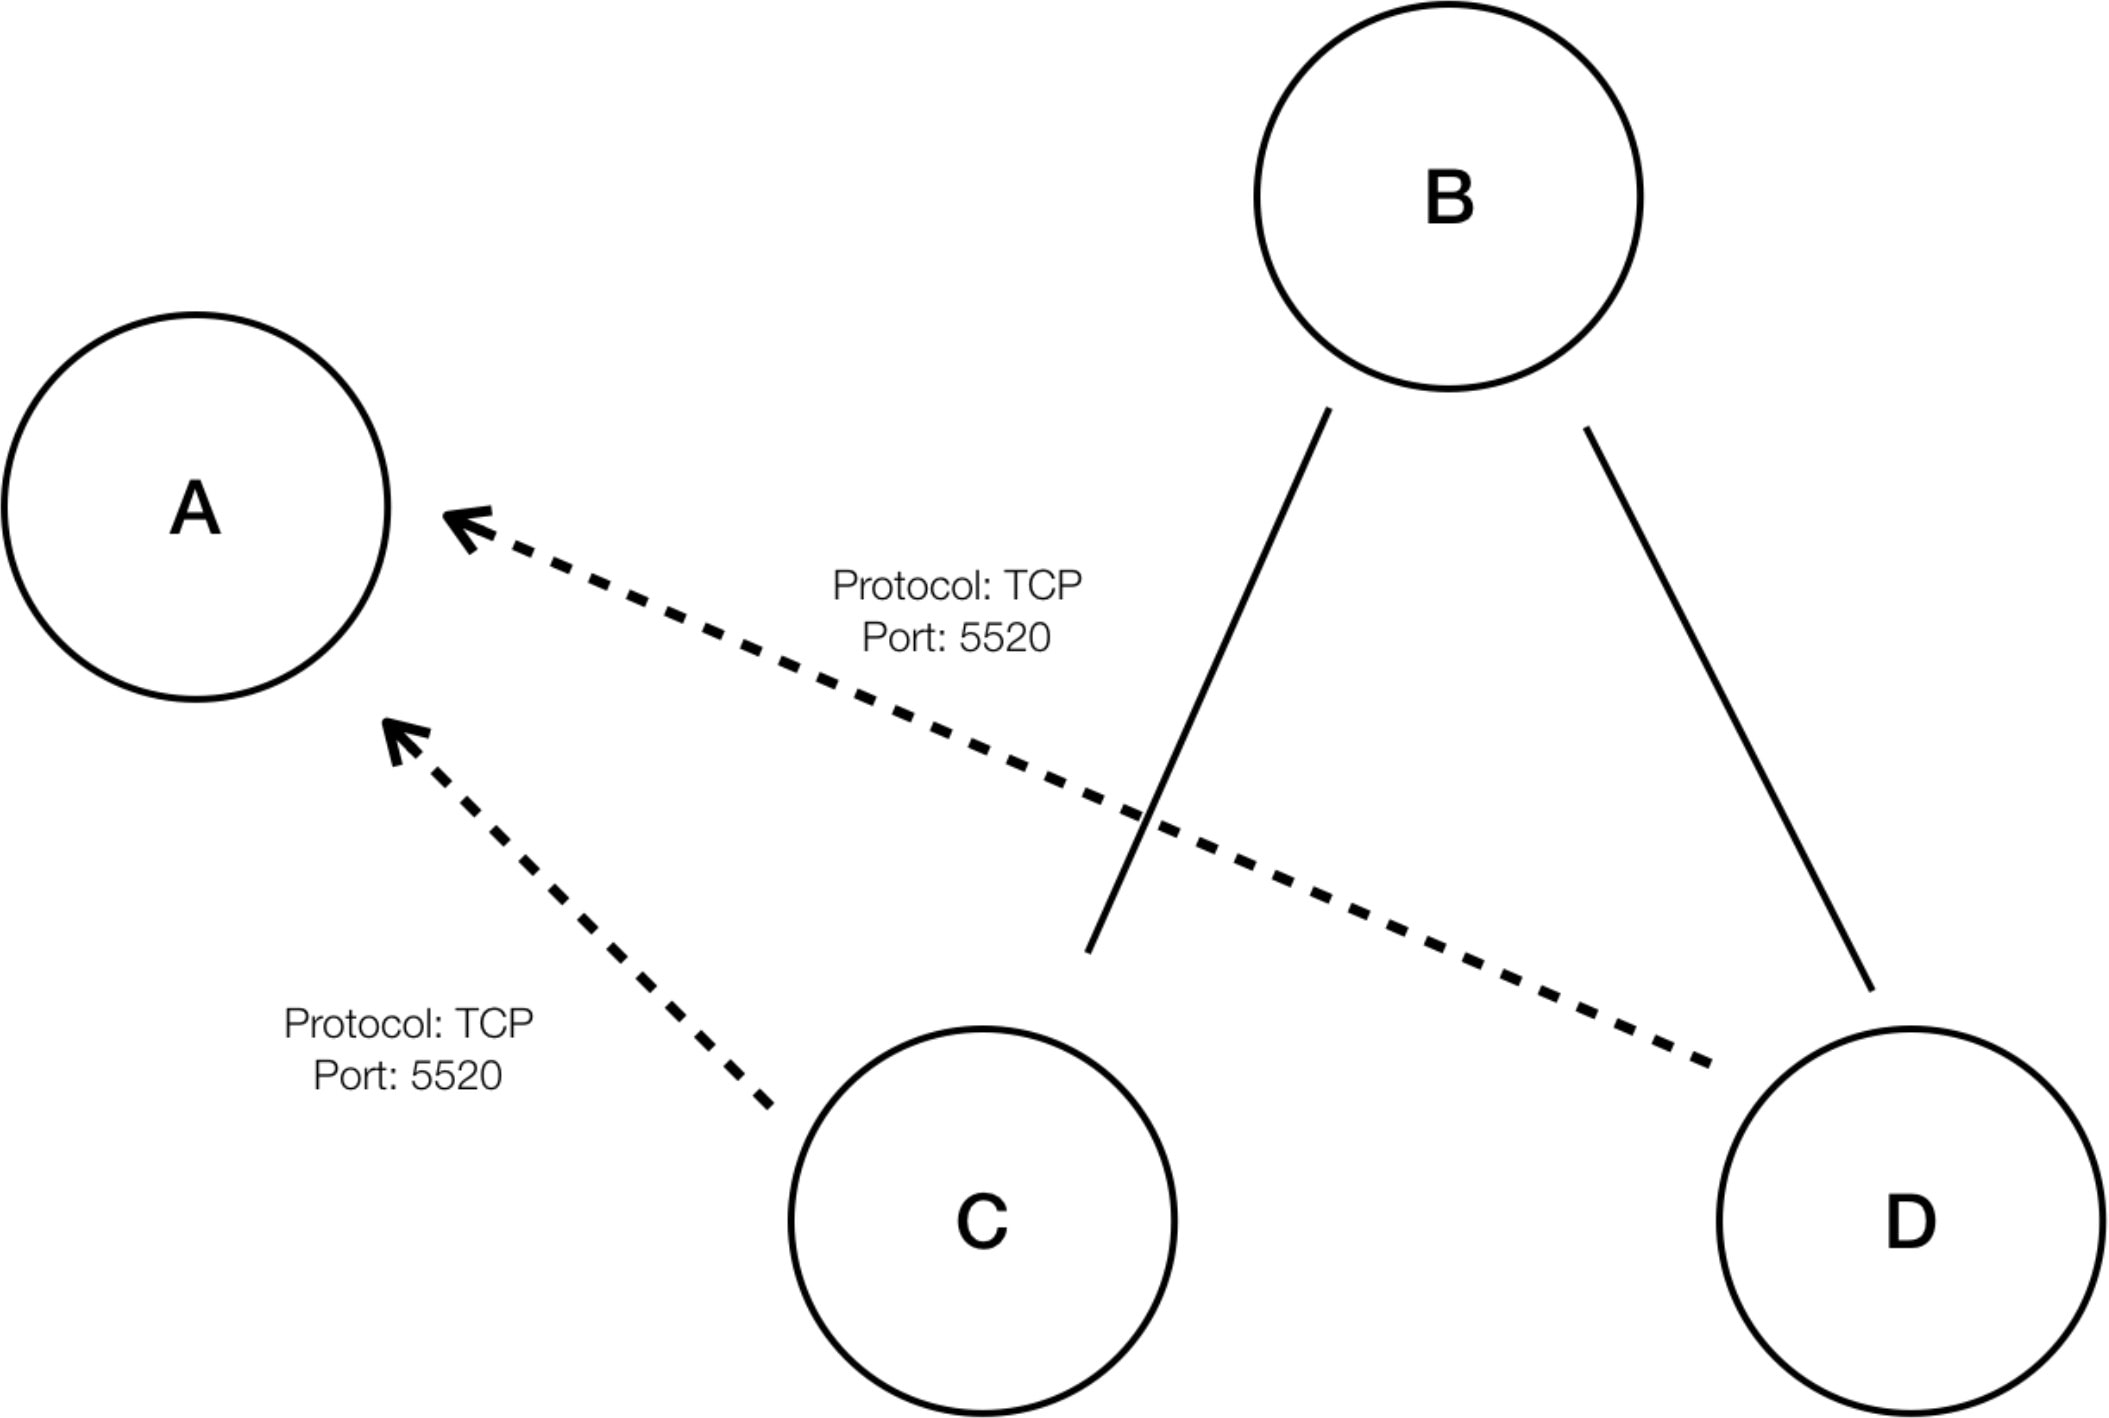
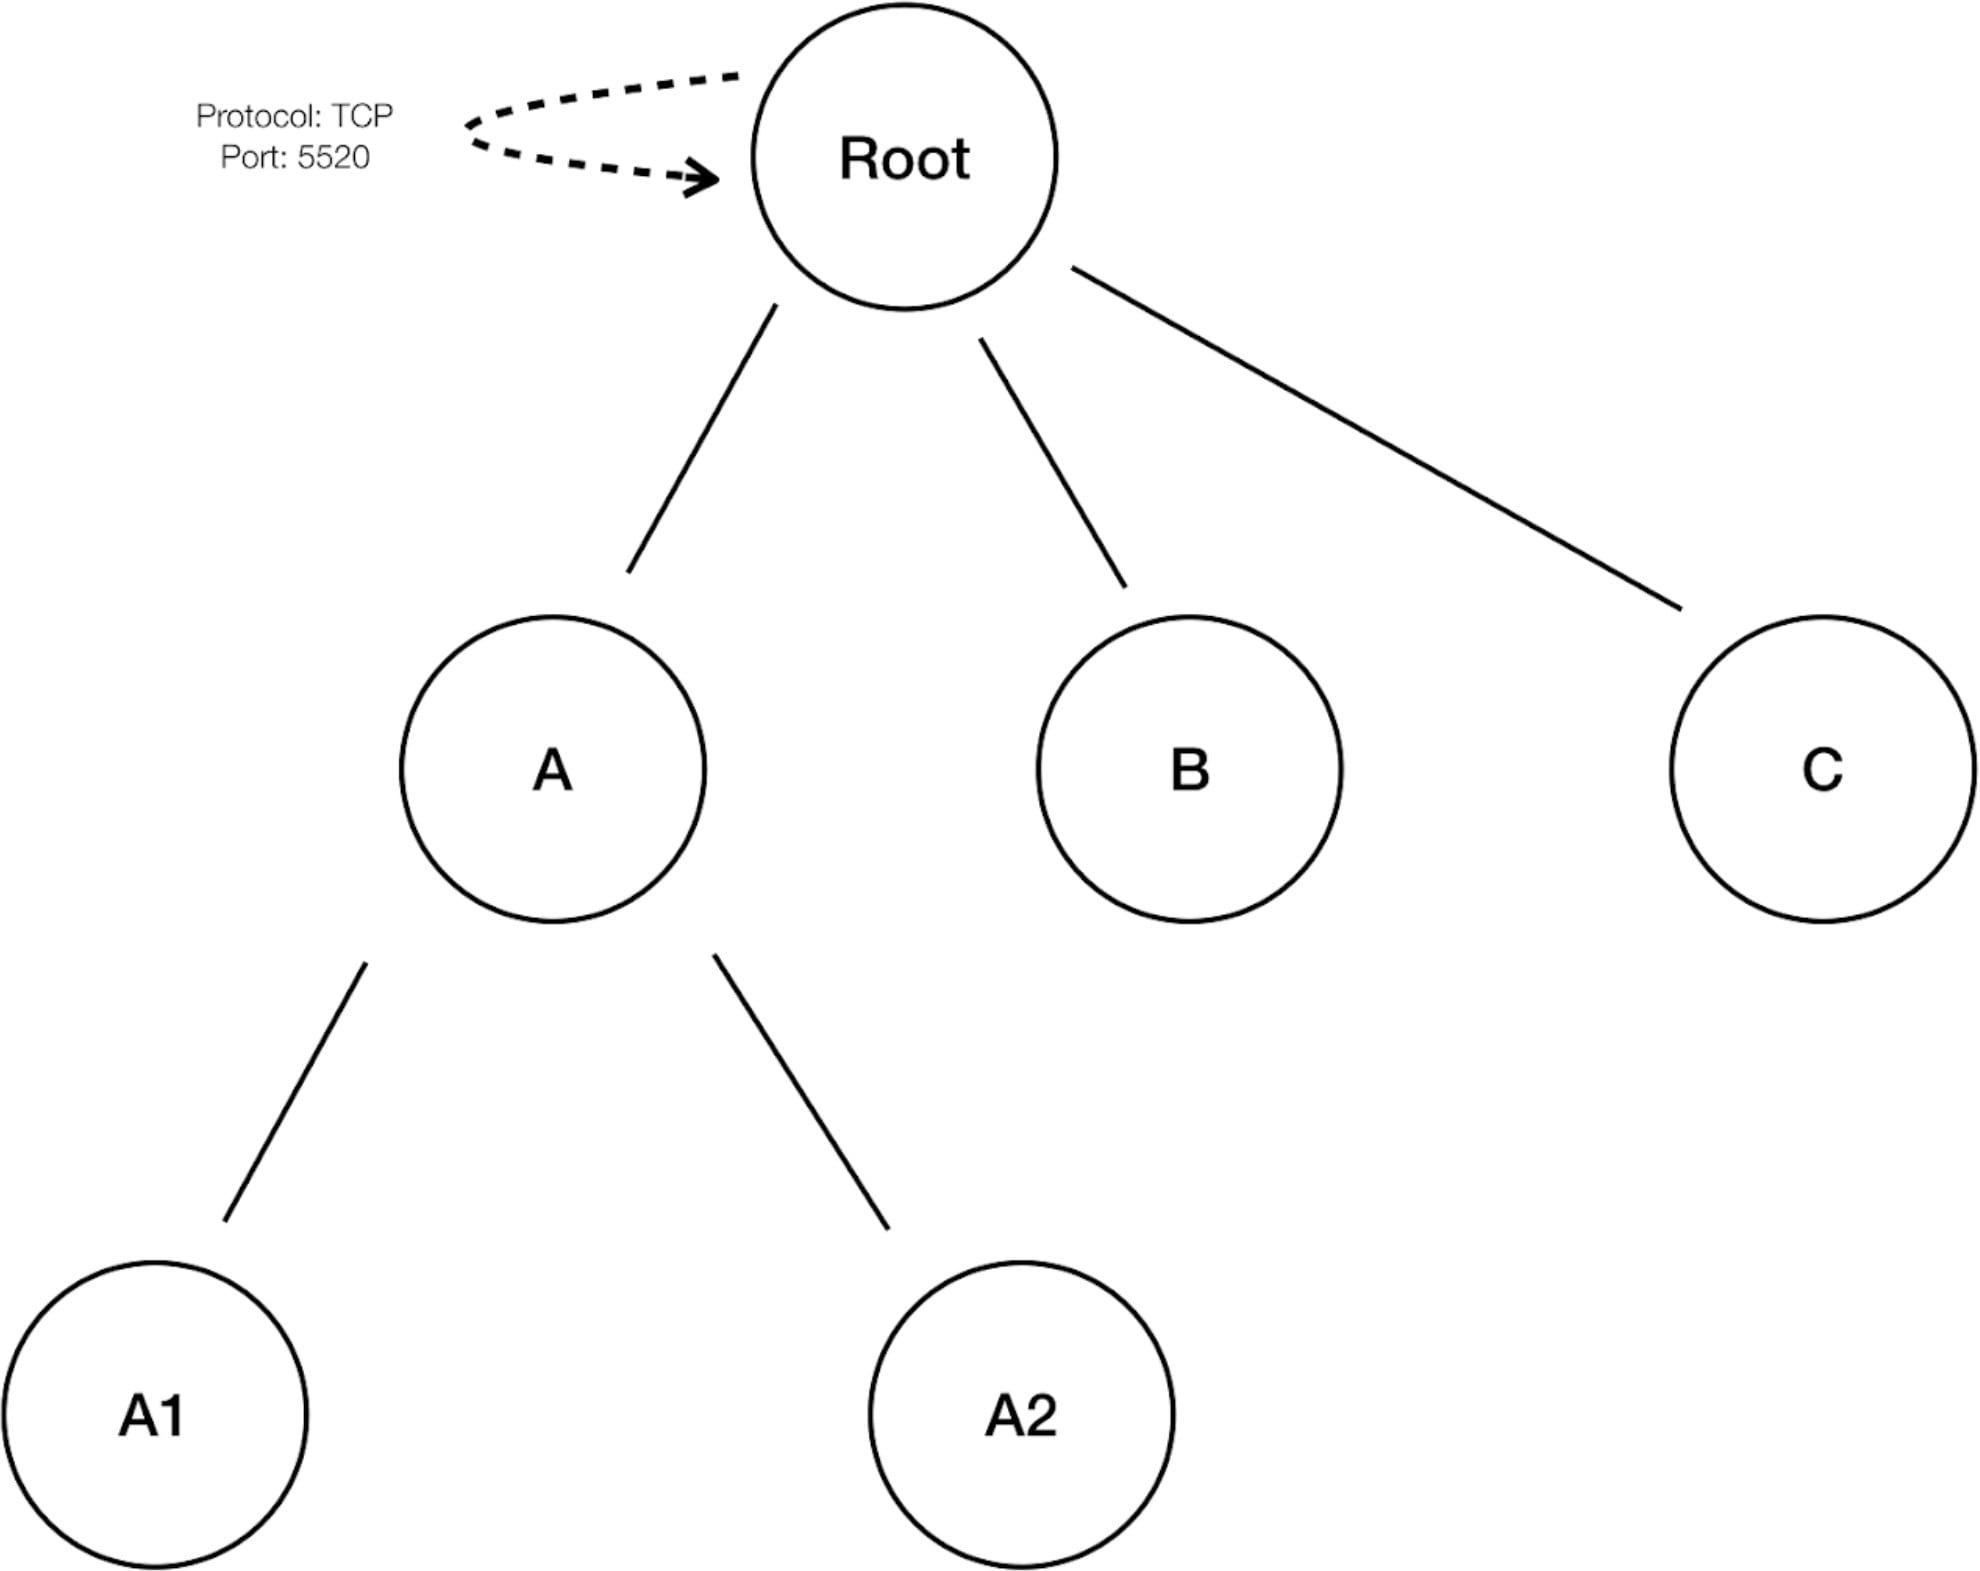
Policy compression occurs when generating policies for a branch of the scope tree. The policy compression knob can be used to alter the level of aggressiveness in hierarchical policy compression. An example of hierarchical policy compression is illustrated.

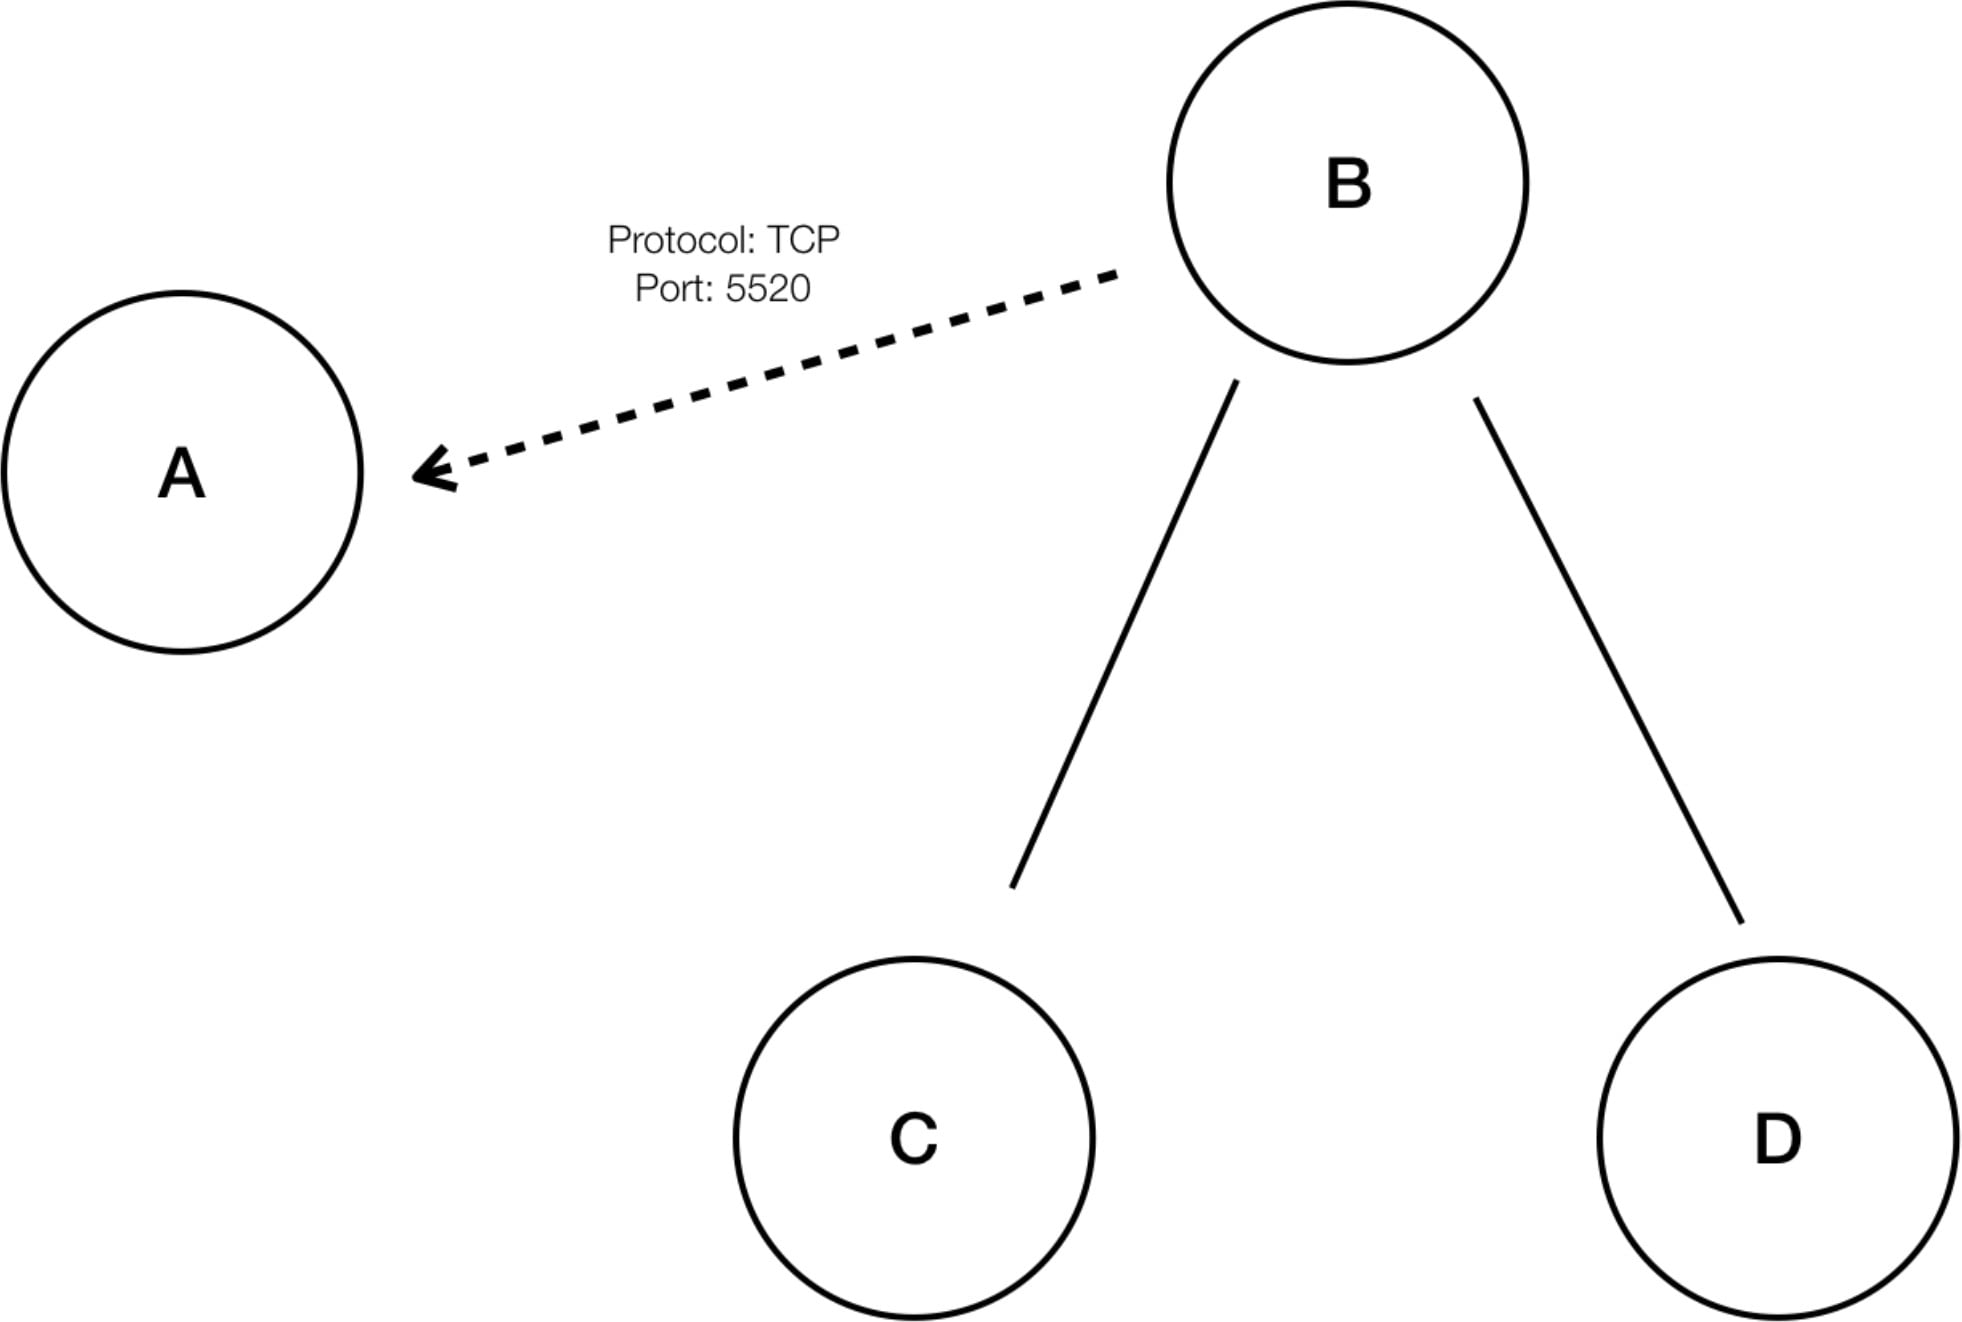
  • Let A, B, C and D be scopes in a scope tree, where “C” and “D” are the child scopes of “B”. Let “C” “A” be a TCP “ALLOW” policy on port 5520 and “D” “A” be TCP “ALLOW” policy on port 5520.

Figure 12. Before hierarchical policy compression
  • If a sufficiently large group child scopes involves in policies sharing the same port, protocol and destination or source, hierarchical policy compression replaces these policies with a generalized policy connecting the parent scope to the common source or destination. In the above mentioned case “C” and “D” are child scopes of “B” and the policies “C” “A” and “D” “A” share the same destination, port and protocol. Since 100% of child scopes of “B” contain the similar policy the policy will be promoted to be “B” “A”, resulting in the following. Furthermore, hierarchical compression can be repeated so a generalized policy can go all the way to the root of the subtree (branch of the scope tree) .

Figure 13. After hierarchical policy compression
After hierarchical policy compression
  • The policy compression knob allows you to tune the compression aggressiveness by changing the minimum required proportion of the policy-sharing child scopes (usually measured as the fraction of total number of child scopes) to trigger the compression. When disabled, each policy is generated between highest priority scopes based on the External Dependencies list. Subsequently, if you choose to impose the naturally ordered External Dependencies list, the policies generated will be the most granular policies among scopes.

Clustering Algorithm (Input to Clustering)

Advanced users can choose the main source of data for clustering algorithms, that is, live network flows, or running processes, or both.

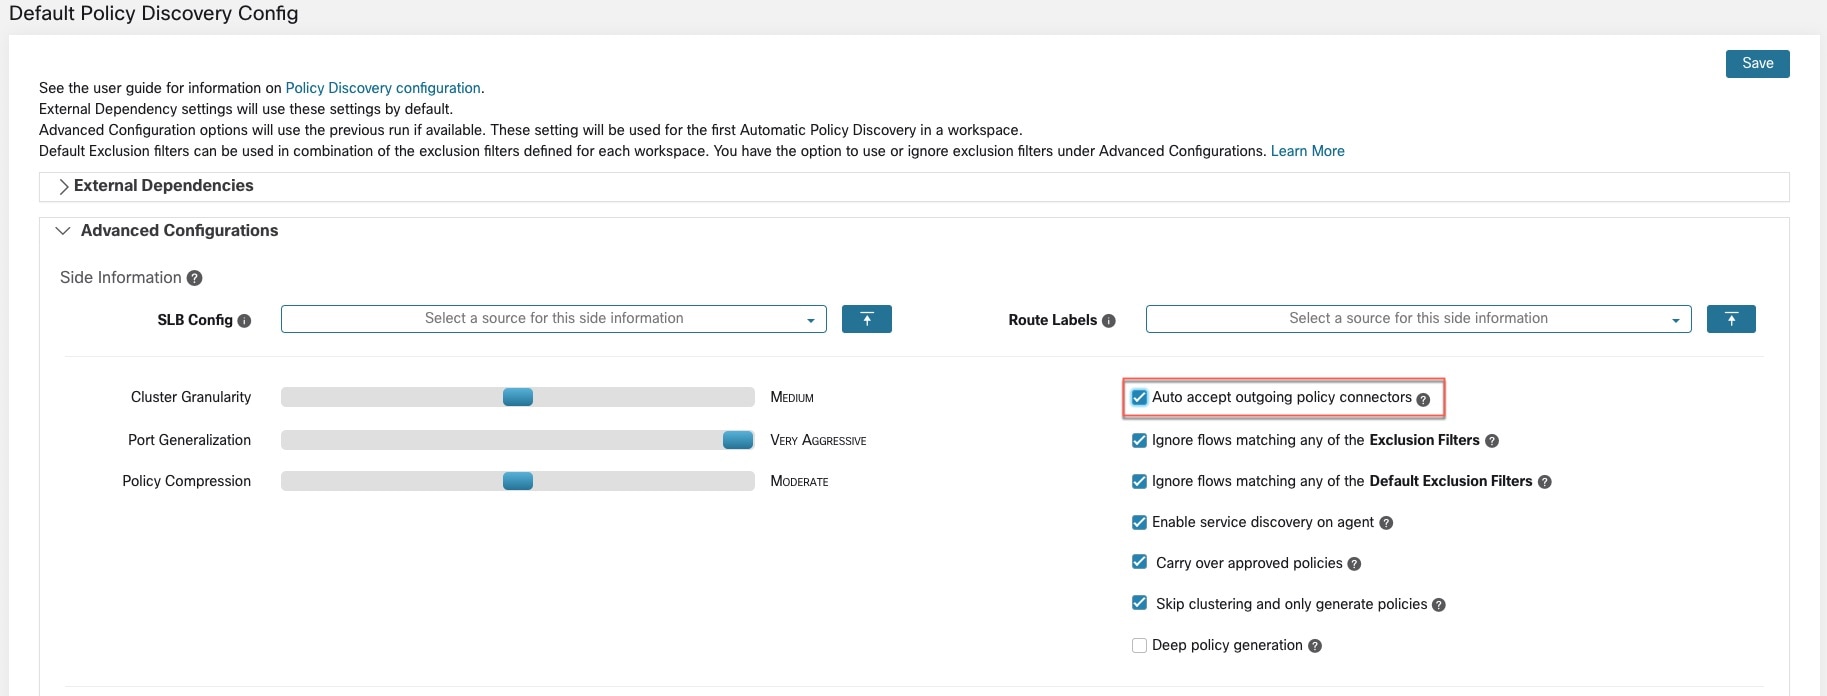
Auto accept outgoing policy connectors

An outgoing policy connector is a network component within policy systems designed to

  • automatically accepts policy requests during the policy discovery,

  • helps create cross-scope policy,

  • is available only for specific user roles, such as root scope owners and site admins.


Note


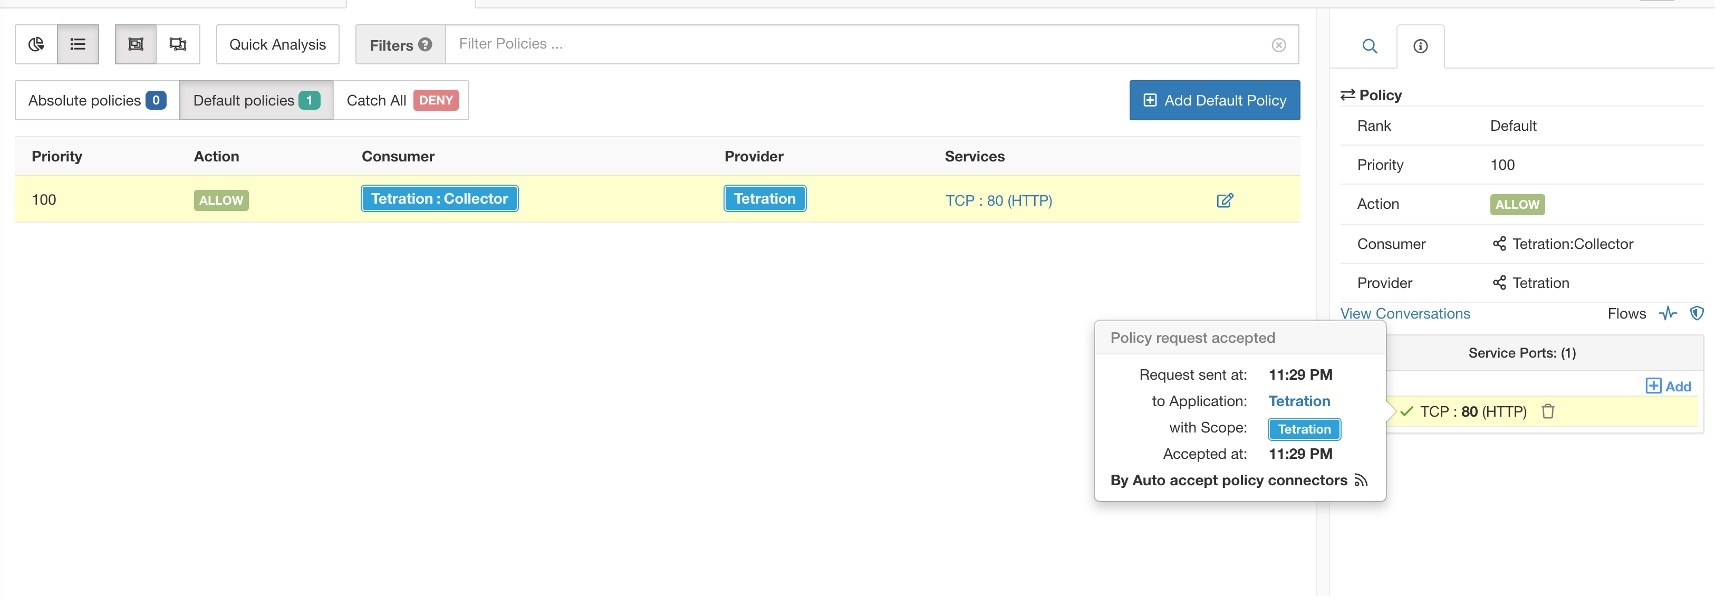
This option is applicable only when you use automatic policy discovery to create cross-scope policies as described in (Advanced) Create cross-scope policies. Any outgoing policy requests are automatically accepted when they are created during automatic policy discovery. This feature is only available for root scope owners and site admins.


For more detailed information, refer to Auto accept policy connectors and policy requests.

Auto approve generated policies

The auto-approve policy option is a configuration setting that:

  • allows policies generated by policy discovery to be automatically approved,

  • requires manual intervention for subsequent changes, and

  • is available exclusively to root scope owners and site administrators.

This option is applicable if you want to approve all policies generated by policy discovery.


Note


Choose this option to modify or undo changes manually.


For more information, refer to Auto accept policy connectors and policy requests.

Enable service discovery on agent

In certain applications, you might have a large range of designated ports, but actual traffic my only use a subset of those ports during the policy discovery period. This option allows the entire designated pool of ports for these applications to be included in policies for those applications, rather than just the ports seen in actual traffic.

Enable this option to gather ephemeral port-range information about services present on the agent nodes. This port-range information is used to generate policies.

Example:

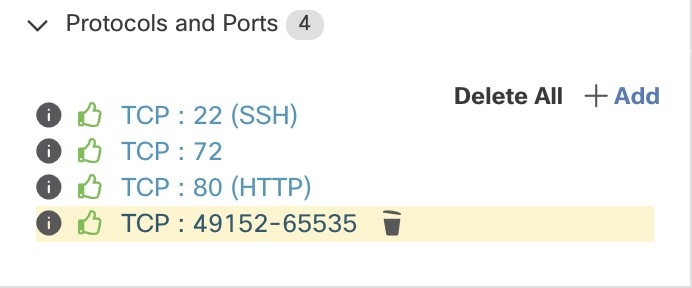
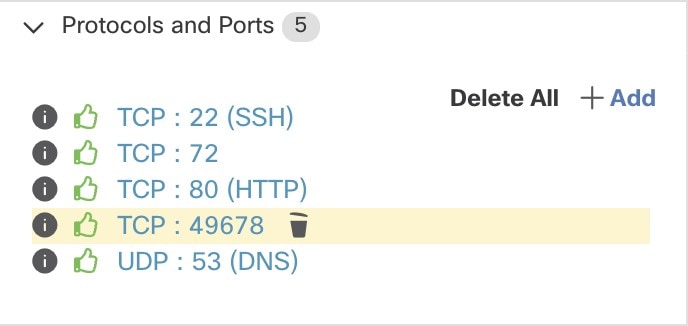
  • Windows Active Directory Domain Server uses default Windows ephemeral port-range 49152 to 65535 to serve requests. When this flag is set, the agent reports this port range, generating relevant policies.

Figure 14. Service discovery enabled on the agent
Service discovery enabled on the agent
Figure 15. Service discovery not enabled on the agent
Service discovery not enabled on the agent
Carry over approved policies

This option is enabled by default.

When this flag is set, all the policies you have marked as approved (including those approved using OpenAPI) will be preserved. This preservation ensures that you do not need to re-define a broad DENY rule that applies regardless of the “allow” policies discovered by automatic policy discovery.

For more information, refer to Approved policies.

Skip clustering and only generate policies

Selecting this option generates policies from existing approved clusters or inventory filters considering the entire scope associated with the workspace as a single cluster. This option can result in significantly fewer (but coarser) policies.

Enable redundant policy removal

This option is only available when generating policies for a branch of the scope tree.

This option allows you to enable or disable the removal of redundant granular policies.

Example:

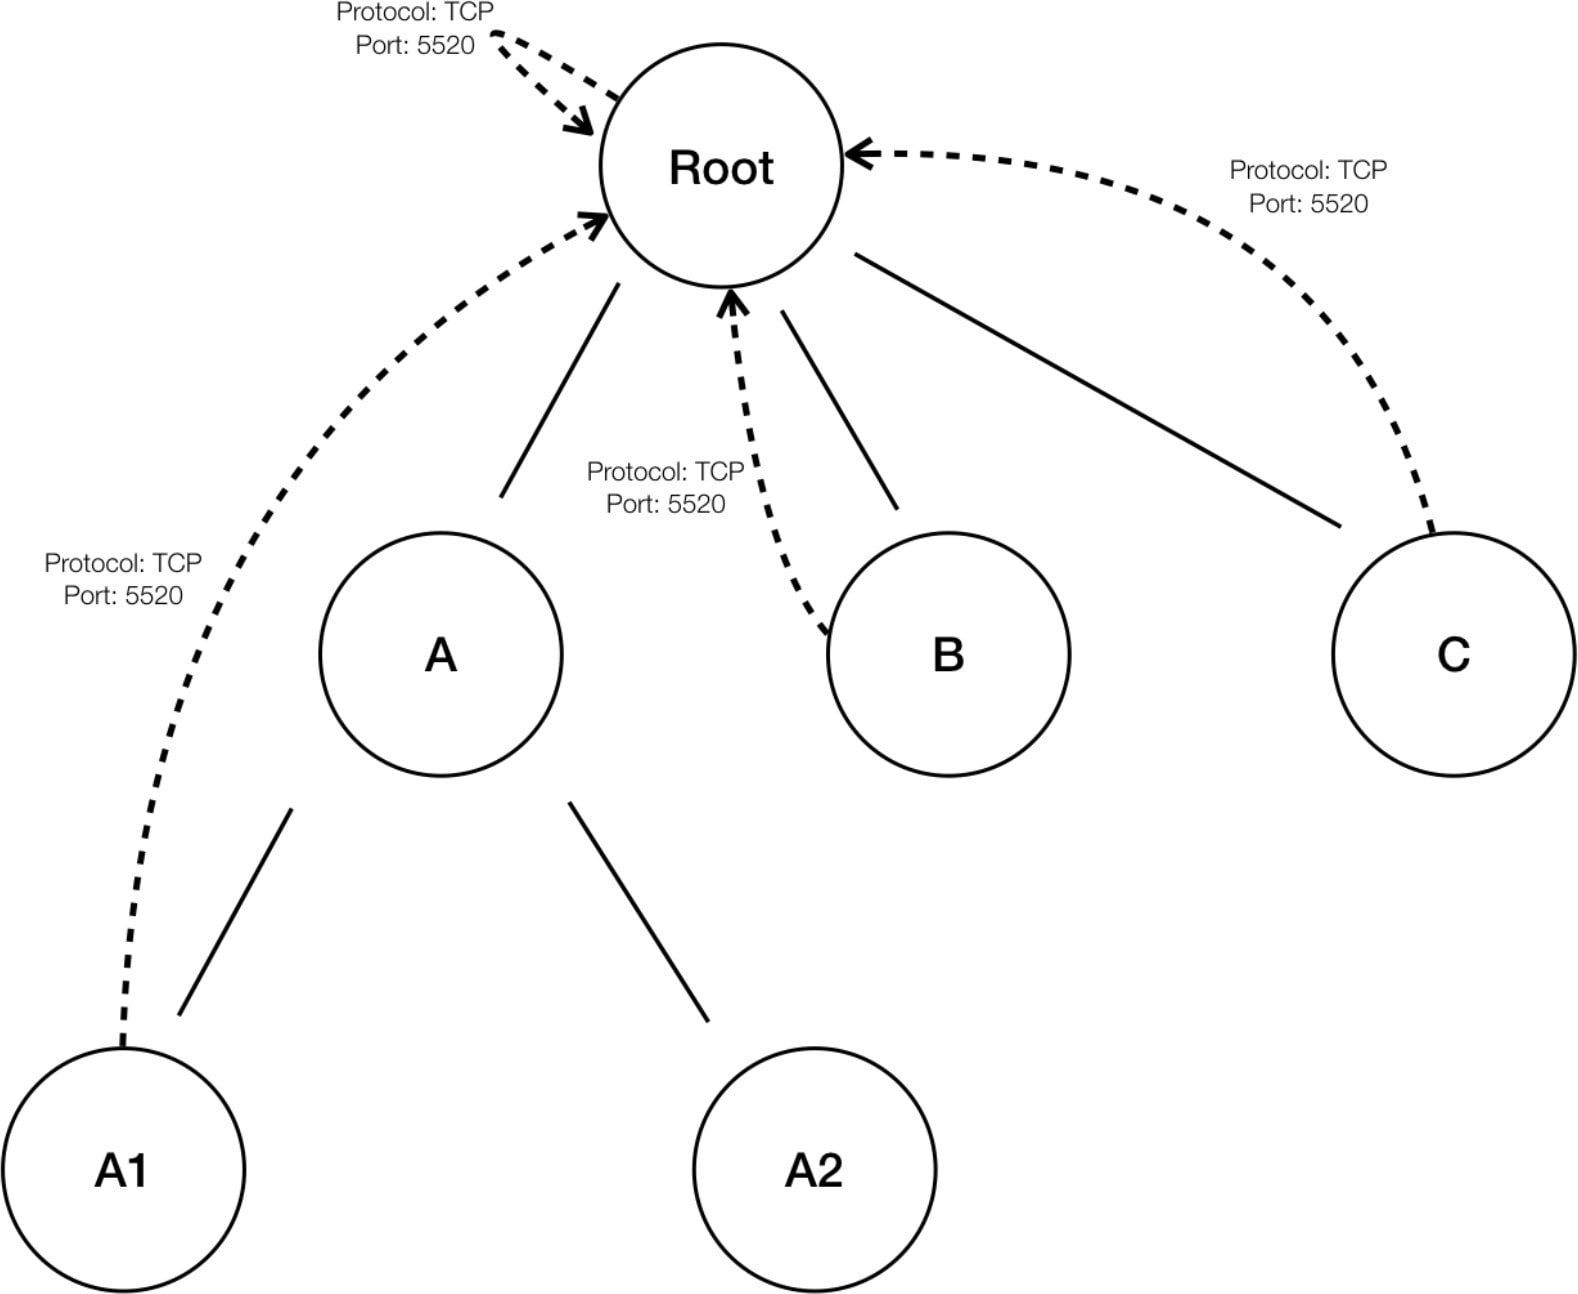
  • Let Root, A, B, C, A1 and A2 be scopes part of a scope tree. Let the following be the policies:

    1. “Root” “Root”

    2. “B” “Root”

    3. “C” “Root”

      4. “A1” “Root”

      Figure 16. Before removal of redundant policies
      Before removal of redundant policies
  • The policies “B” “Root”, “C” “Root” and “A1” “Root” are redundant as the policy “Root” “Root” covers these policies. The remove redundant policies feature will check and remove such policies resulting in only one policy “Root” “Root”.

Figure 17. After removal of redundant policies
After removal of redundant policies

Redundant policy removal helps maintain a succinct set of interpretable policies by minimizing the number of policies required to cover all the workload traffic at the chosen compression level. It is essential to audit policies through policy analysis, especially when endpoints that are not categorized into finer scopes or inventory filters. Such endpoints may trigger the generation of coarser policies involving the root scope. When redundant policy removal is enabled, more granular policies are removed and my not be presented.

To diagnose the source of compressed policies and view finer level policies, turn off policy compression and redundant policy removal. Currently, the automatic policy discovery conversations page may not display conversations resulting in compressed or generalized policy. Turning off compression and redundant policy removal helps in identifying the conversations that generate the policies.


Tip


Since discovering policies for a branch of the scope tree discovers all policies for the scope subtree rooted at the workspace scope. These policies will cover all the legal traffic seen by automatic policy discovery for all the workloads under the subtree. When analyzing these policies using tools such as Policy Analysis. See Policies), you should turn off Policy Analysis in all the associated workspaces with the subscopes. The policies that are residing in the subscope workspaces (usually receive a high priority due to more specific scope definition) will not take priority and interfere with the results. However, exceptions apply when the policies in the subscope workspaces are configured to cover different sets of traffic that usually involve finer inventory filters or clusters specific to the subscopes.


Default policy discovery config

You can configure default automatic policy discovery settings for optional use in any workspace within the entire root scope.

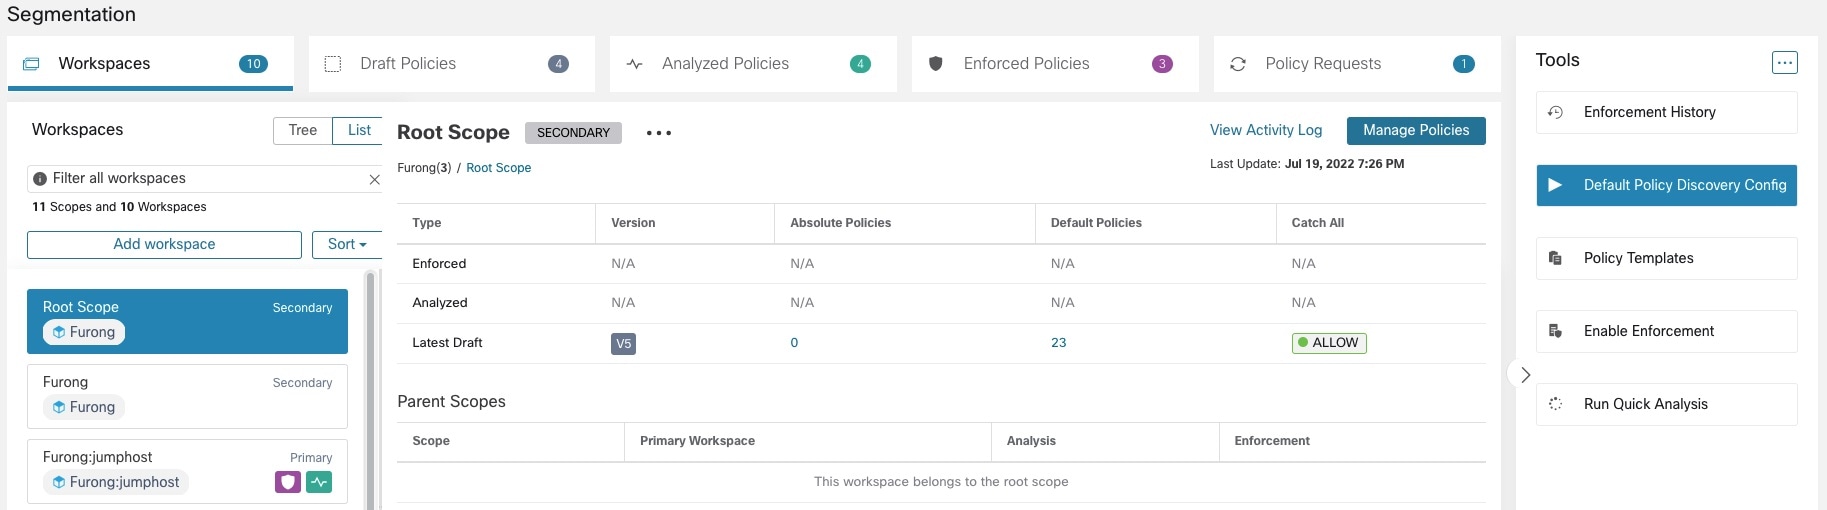
To configure default options for policy discovery, choose Defend > Segmentation, then click the caret to expand the Tools menu. Next, select Default Policy Discovery Config.

Figure 18. Navigating to the Default Policy Discovery Config page
Navigating to the Default Policy Discovery Config page

For information about options available on the Default Policy Discovery Config page, refer to:


Important


When your default configurations are complete and ready to use in individual workspaces, click Save.


Default exclusion filters

Use exclusion filters to fine-tune policies and clusters by specifying traffic flows to exclude from the discovery input.

For details, see the Exclusion Filters section.

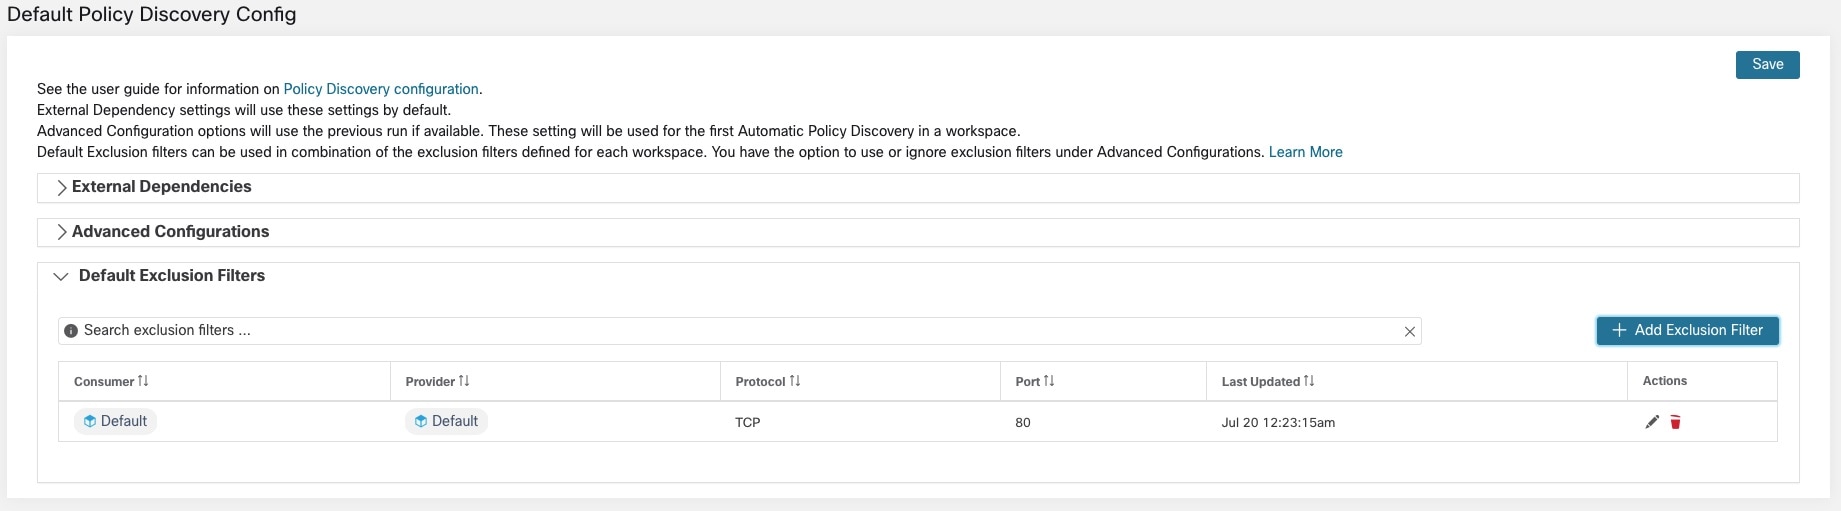
You can create a global Default Exclusion Filters list available to all workspaces in your tenant, and specify for each workspace whether to use this default list when discovering policies.

Figure 19. Default Exclusion Filters
Default Exclusion Filters

For information on configuring Inclusion flow filters, refer to the Configure, Edit or Delete Inclusion Flow Filters section.

Approve policies

As you review policy discovery results, approve the discovered policies you want to retain to ensure they remain unchanged during future discoveries. For more information, refer to Approved policies.

To approve a policy, perform these steps:

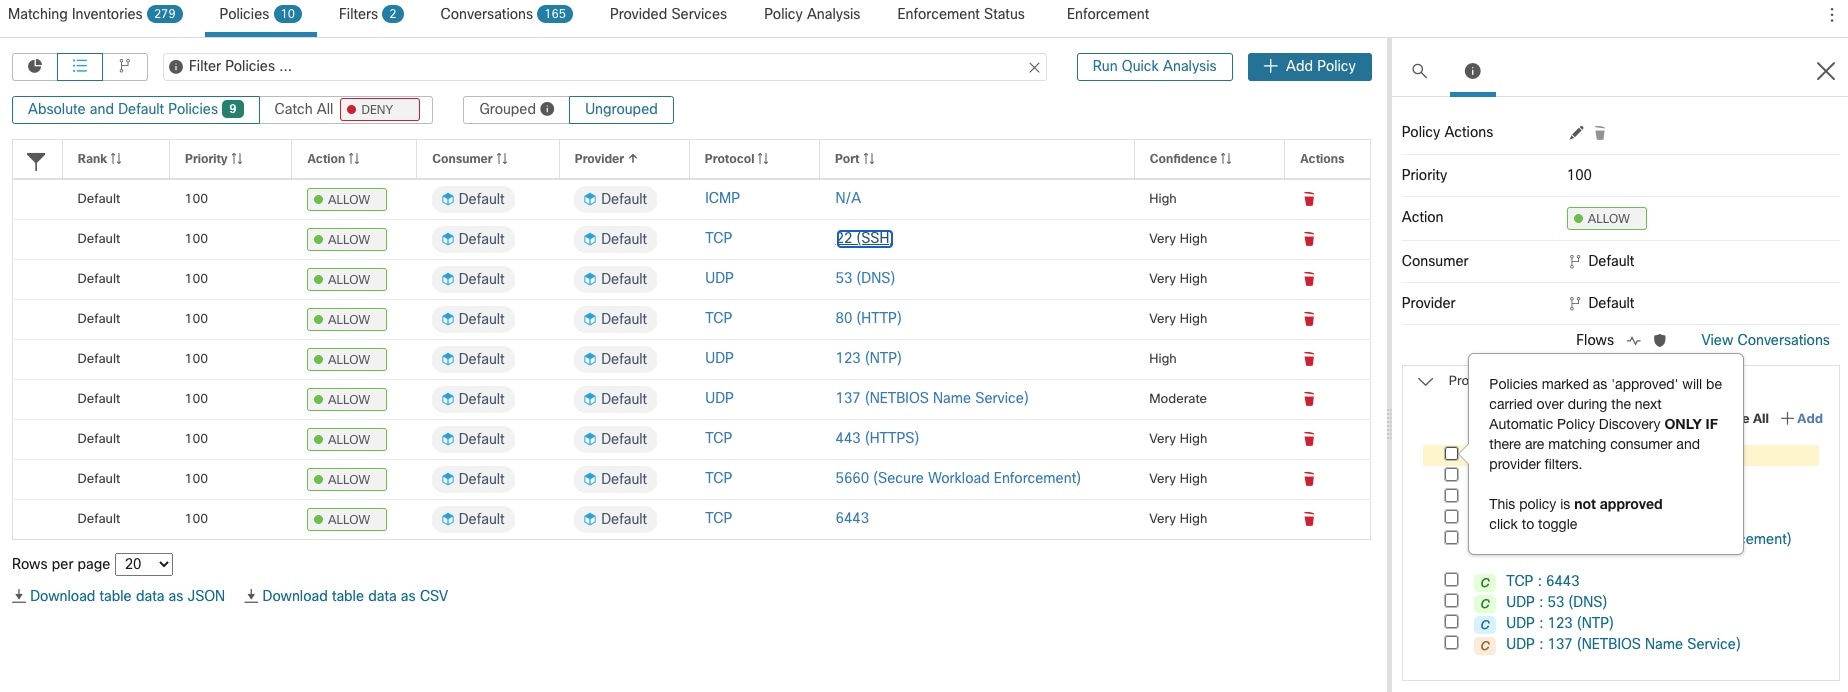
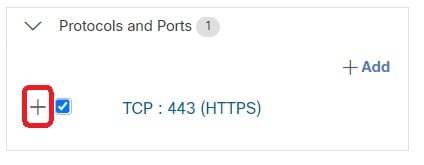
  1. On the Policies page, click the value in the Protocols and Ports column for the policy you want to protect.

  2. In the panel that opens on the right, check the checkbox to the left of each protocol and port for which you want to retain the policy during future policy discovery.

    Figure 20. Approve Policies
    Approved Policies

You can also use this procedure to remove approval from a policy.

Approved policies

In general, approved policies are not changed during automatic policy discovery, and automatic policy discovery does not suggest policies that would duplicate or overlap the effects of approved policies.

The approved policies include:

  • Manually created policies.

  • Discovered policies that are manually approved.

    (Approve a policy when it behaves as intended to protect it from future automatic policy discovery changes. For more information, refer to Approve policies.)

  • Uploaded policies, unless explicitly marked as approved: false.

  • Approved policies that are defined in parent and ancestor scopes (specifically, from the latest versions of their primary workspaces) that apply to workloads in this scope.

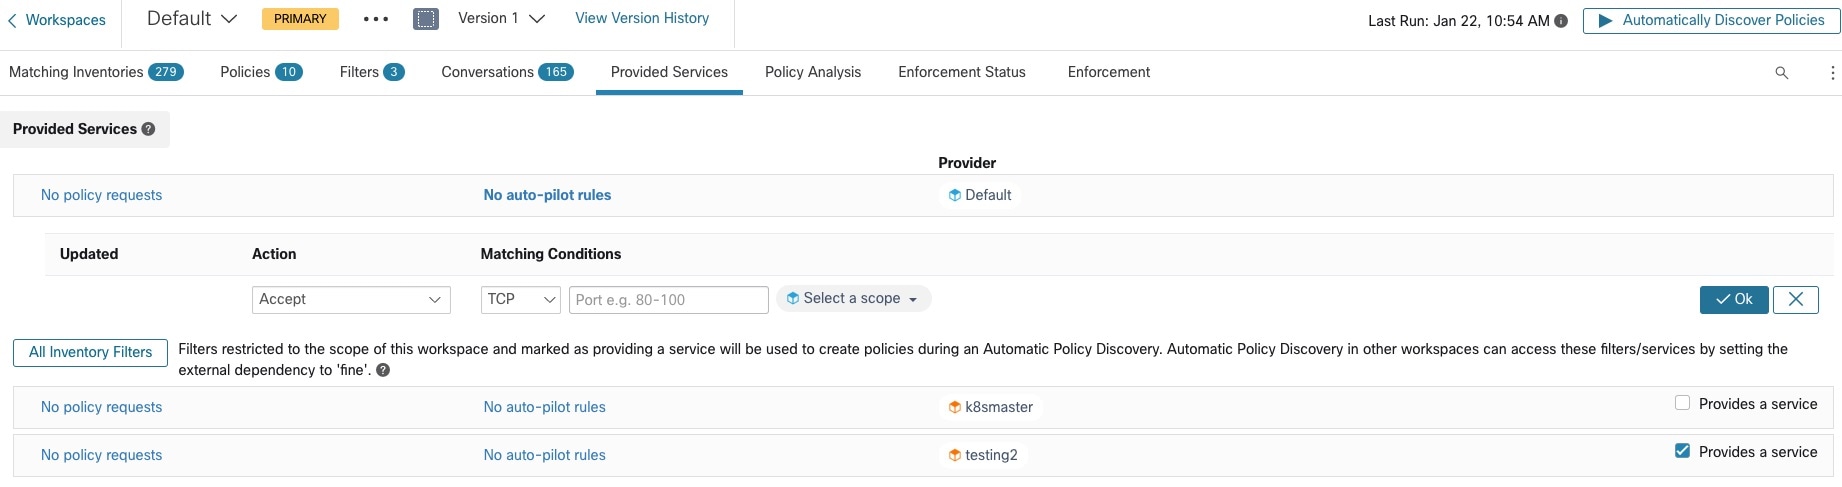
  • Policies created when policy requests from another workspace are accepted, when cross-scope policies are handled using the advanced method that is described in When consumer and provider are in different scopes: policy options. For example, this includes policies that are included from the Provided services tab.

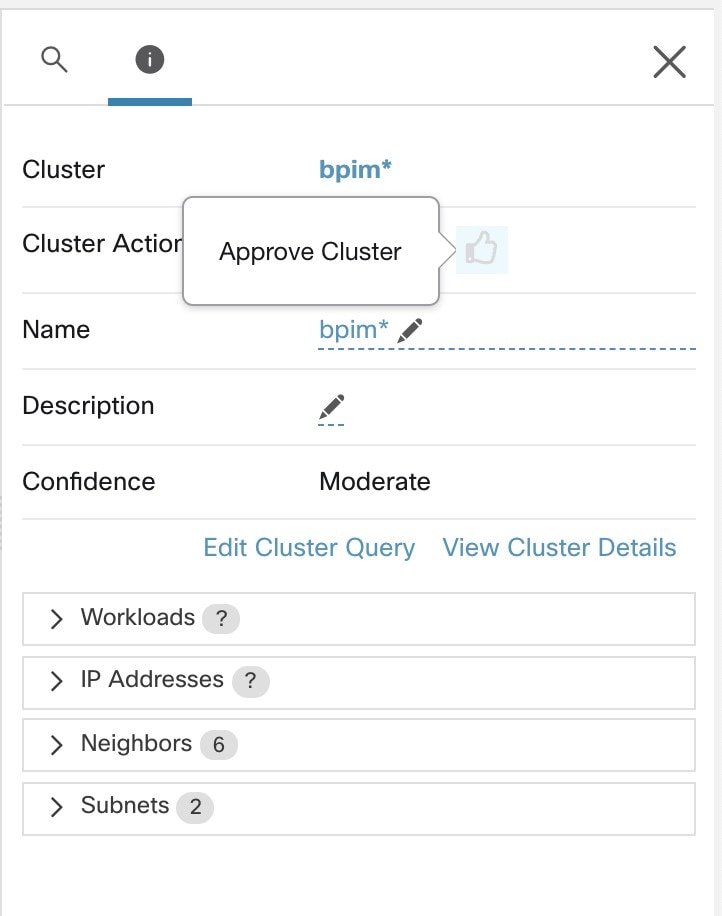
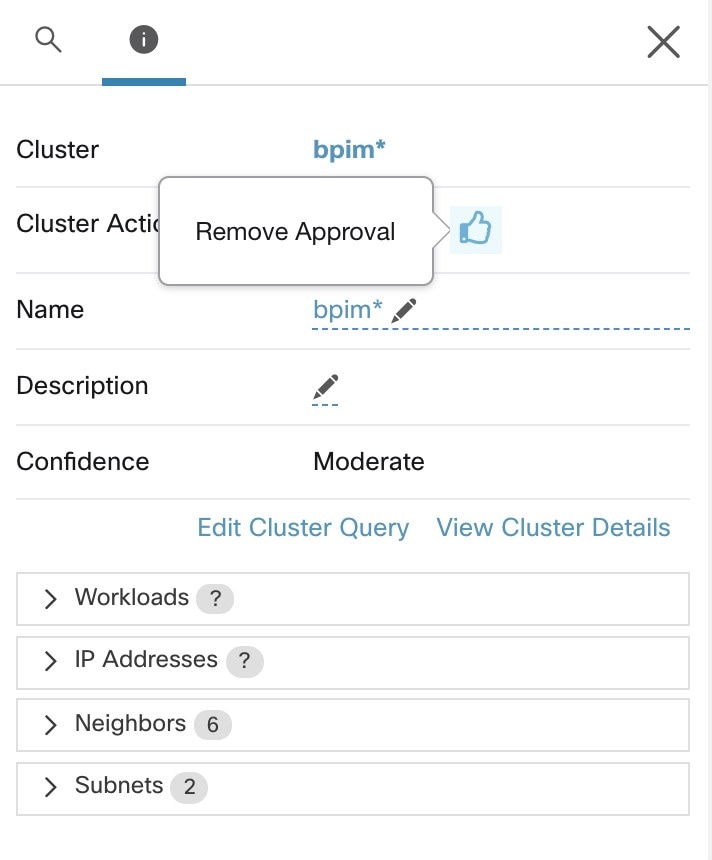
You can see approved policies with a thumbs-up icon next to the protocol type when you click a policy's ports or protocols link and view details in the right panel.

Exceptions to Approved Policy Protections

If both ends of the policy are any of: approved cluster; inventory filter; accepted policy request (for cross-scope policies); or a cluster that does not significantly change membership, the policies will be preserved during future automatic policy discovery.

Approved policies may not be protected during future automatic policy discovery runs if either end of the policy is a cluster that is not approved, and if, upon automatic policy discovery, no newly generated cluster has sufficiently high overlap with such cluster.

To protect a policy that involves an unapproved cluster, you should explicitly approve the clusters at each end of the policy.

Automatic policy discovery has an advanced configuration for that is enabled by default. To prevent protecting approved policies from changes, deselect this option for a workspace or for the global default policy discovery configuration:. For more information, refer to Carry over approved policies.

Troubleshoot approved policies
Approved policies not carried forward

Ensure you select the Carry over approved policies option in either advanced or default configuration settings for automatic policy discovery if approved policies are not carried forward as expected.

Finding conversations that are excluded from policy generation

During automatic policy discovery, any conversations matching existing approved policies are excluded from new policy generation to avoid redundancy. This process differs from the exclusion filters. For more information, refer to Exclusion Filters. Exclusion filters prevent matching conversations from being visible to all parts of automatic policy discovery.

When redundant policies are not generated from these conversations, the conversations are still considered when automatic policy discovery analyzes and generates clusters.

To identify which conversations are excluded from automatic policy discovery by existing approved policies:

In the conversations view (See Conversations), use the excluded flag to filter conversations. In the policy details view, click the ports and protocols link in a policy, and then click the exclusion icon next to the conversation to explore connected approved policies.

Iteratively revise policies

Defining and refining policies is an iterative process. It requires revisions over time for both discovered and manually created policies.

Re-running automatic policy discovery

You should rerun automatic policy discovery mainly to include additional information that was not included in the previous run, or to exclude information that is not helpful. For example, you can do these actions:

  • Install additional agents or configure additional connectors, and allow some flow data to accumulate.

  • Increase the timespan used for discovery to include more data.

  • Approve clusters (with or without editing them first), which can improve the clustering of other workloads upon rerunning. For more information, refer to Approvals of clusters.

  • Exclude flows that you know you do not want to influence policy so you do not have to edit them out. For more information, refer to Policy discovery flow filters.

  • Change advanced settings (for details, refer to Advanced configurations for automatic policy discovery.)

  • Capture changes after you have made changes to Address policy complexities.

Rerunning automatic policy discovery on an existing workspace may generate different clusters and policies in the workspace.

If a host is not within the scope of the workspace, it will not appear in any cluster. If it were in an approved cluster, it will no longer appear in that cluster. Automatic policy discovery may result in different clusters when using the same set of member workloads but a different timeframe or configuration.


Note


For a list of the types of policies that are not modified during policy discovery, refer to Approved policies.


Note


Removal of Redundant Policies On subsequent automatic policy discovery, approved policies in primary workspaces will remove matching conversations for policy generation, so redundant policies are not generated. This functionality may not work perfectly on non-primary workspaces with a Cluster filter. Cluster filters from a non-primary workspaces are not active, and will not match any flows, thus redundant policies may still be generated in non-primary workspaces during automatic policy discovery.


Important: Before you re-run automatic policy discovery

Important


Before re-discovering policies in a workspace, address each issue listed:

  • Each time you discover policies in a particular workspace, by default, existing set of discovered policies and clusters are overwritten based on the data included in the new discovery period. Approve any policies and clusters you want to keep.

  • If you want to preserve any existing generated clusters, see Preventing Cluster Modification During Automatic Policy Discovery Reruns or Approvals of clusters.

  • If you want to preserve any existing generated policies, see Approve policies.

  • Any existing Advanced Configuration settings configured in the previous discovery run are used unless you change them.

    However, any configured default external Dependencies will be used instead of those from the previous run.

  • If the displayed version of the discovered policies is outdated, and you want to retain previously discovered versions, click the version displayed at the top of the page and then select the latest version.

    If a previous version is displayed, any versions between that version and the new discovered version will be deleted.

    For details, see View, compare, and manage discovered policy versions.


To rerun policy discovery, see Automatically discover policies. The process is the same each time you discover policies.

View, compare, and manage discovered policy versions

Each time you discover policies in a workspace, the version number (v*) assigned to the set of policies increments.

For more information, refer to About policy versions (v* and p*) (reference).

Procedure

Step 1

Click Defend > Segmentation.

Step 2

Navigate to the workspace.

Step 3

Click Manage Policies.

Step 4

The currently displayed version of the policies generated by automatic policy discovery is shown at the top of the page:

Currently displayed version of policies

If you have already analyzed or enforced policies, the displayed version may be a policy discovery version, an analyzed policy version, or an enforced version.

Step 5

Do one of the following:

Display a different version of the policies generated by automatic policy discovery:

Click the current version and select a different v* version.

(If you see p* versions, those are analyzed and/or enforced versions, not versions of discovered policies.)

Show policy versions

Important!! Refer to the caveat in the What To Do Next section at the end of this procedure.

View details about a version

  1. Click View Version History at the top of the page beside the current version.

  2. Click the Versions tab to view the versions of discovered policies. (Not the Published Versions tab.)

    The list of versions displays:

    Figure 21. List of generated policy versions with summary information
    List of generated policy versions with summary information
  3. Click the log events link in the version.

  4. Click a link in an event row for detailed statistics and configurations.

    Figure 22. Configurations used for particular automatic policy discovery runs
    Configurations used for particular automatic policy discovery runs

Compare two versions to see what has changed:

  1. Click Compare Revisions, choose versions to compare and review results.

    For result details, refer to Comparison of policy versions: policy diff.

Delete an unwanted version:

Click More button for the version and choose Delete.

You cannot delete the last remaining version generated by automatic policy discovery (v* version).

Export a version:

Click More button for the version and choose Export....


What to do next

Important


If you want to preserve previous versions of the discovered policies, always display the current version of the discovered policies when you are done working with older versions.

If you do not display the most current version of the discovered policies when you next discover policies for this workspace, older versions may be deleted.

For example, if the most current version of discovered policies is v4, and v2 is displayed when you discover policies again, then the existing v3 and v4 will be deleted and the new discovered policy version will be v3.

This behavior ensures a linear version history, which simplifies reverting to a previous version if desired.

In addition, you can manually create policies only if the latest v* version is displayed.


Policy discovery kubernetes support

Policy discovery uses Kubernetes configuration information on pods and services to create clusters for both pods and services, resulting in generation of respective policies.

If the Cluster Granularity is set to COARSE or VERY COARSE, the services and the pods backing them are clustered together.

If the Cluster Granularity is set to Medium or Fine or Very Fine, the services and the pods backing them are clustered separately.

For pod clusters, the cluster description includes the the source information about which entity caused the cluster formation.

For example, Description: “The cluster was formed from the following sources: ReplicaSet name: replicaset-zeta”.

Import/Export

Export a workspace

You can download all relevant cluster and policy contents in each workspace as a single file in a number of popular structured document formats such as JSON, XML and YAML. You can use these files for in-house processing or ingestion by other policy enforcement or analysis tools.

Navigate to the . . . menu item on the workspace header and click the export item to display the export dialog. You can choose to include only the cluster contents or both the cluster contents and the security policies. These policies are among the clusters generated by automatic policy discovery based on real network flows in the exported file. Choose the desired format, then click Download to download the file into the local file system.

Figure 23. Import/Export menu items
Import/Export menu items
Figure 24. Exporting Policies of a workspace
Exporting Policies of a workspace

When you export a workspace, the "Auto accept outgoing policy connectors" setting that is in the automatic policy discovery configuration is included and will be active in the imported workspace.

Import

You can import known cluster and policy definitions into a workspace by directly uploading a JSON file. Similar to automatic policy discovery, uploading policies into an existing workspace creates a new version and organizes clusters and policy definitions under the new version. Errors may occur if filters are missing or property values are incorrect.

Choose Import from the . . . menu in the workspace header. In the import dialog, you can select a JSON file with a valid format. Click Sample to find a small sample JSON file demonstrating the schema for policies and clusters.

Figure 25. Importing Clusters/Policies
Importing Clusters/Policies

If the JSON contains unrecognized attributes and Strict Validation is enabled, an error will occur. This is useful for locating typos or incorrectly identified optional fields.


Note


All imported policies are marked as approved by default unless you explicitly mark them as approved: false. You can maintain approved policies during automatic policy discovery to generate a new set of policies. For more information, refer to Approved policies.


Pro Tip: The JSON file schema exported from an application workspace is schema-compatible with the expected format for importing policies into a workspace. Therefore, you can clone policies from one application workspace to another using an export followed by an import. Note that many features may not work the same when exporting and then importing policies. For example, the conversations backing the policies are not included in the export and will not be present when importing the policies either.

Platform-specific policies

A platform-specific policy option is a configuration method that:

  • specifies how policies vary across different platforms,

  • defines the strategies for enforcing policies on each platform, and

  • includes guidelines specific to Kubernetes or OpenShift.

These policies are essential for maintaining consistency and operational efficiency across diverse systems.

To understand how agents enforce policy on each platform, refer to Enforce Policies with Agents. For Kubernetes/OpenShift, refer to Enforcement on containers.

Windows

Windows OS-based policy configurations

Specify ports and protocols in policies whenever possible. Do not allow ANY port, ANY protocol.

An example of a generated policy with port and protocol restrictions looks like this:


     dst_ports {
      start_port: 22
      end_port: 22
      consumer_filters {
        application_name: "c:\\test\\putty.exe"
      }
     }}
     ip_protocol: TCP

In contrast, if you allow network connections initiated by iperf.exe with ANY protocol and ANY port, the generated policy looks like this:


  match_set {
    dst_ports {
      end_port: 65535
      consumer_filters {
        application_name: "c:\\test\\iperf.exe"
      }
    }
    address_family: IPv4
    inspection_point: EGRESS
    match_comment: "PolicyId=61008290755f027a92291b9d:61005f90497d4f47cedacb86:"
  }

For this filter, Secure Workload creates a policy rule to allow the network traffic on the provider as follows:


  match_set {
      dst_ports {
      end_port: 65535
    }
    address_family: IPv4
    inspection_point: INGRESS
    match_comment: "PolicyId=61008290755f027a92291b9d:61005f90497d4f47cedacb86:"
  }

This network rule opens all the ports on the Provider. We strongly recommend not to create OS-based filters with Any protocol.

Configure Windows OS-based filters in a policy

For more granularity when enforcing a policy on Windows-based workloads, you can filter network traffic by:

  • Application Name

  • Service Name

  • User Names with or without User Groups

This option is supported in both WAF and WFP modes. Windows OS-based filters are categorized as consumer filters and provider filters in the generated network policy. The Consumer filters filter the network traffic that is initiated on the consumer workload and Provider filters filter the network traffic that is destined for the provider workload.

Before you begin

This procedure assumes you are modifying an existing policy. If you have not yet created the policy to which you want to add a Windows OS-based filter, create that policy first.


Important


Refer to Caveats and Known limitations for policies involving Windows attributes.


Procedure

Step 1

In the navigation pane, click Defend > Segmentation.

Step 2

Click the scope that contains the policy for which you want to configure Windows OS-based filters.

Step 3

Click the workspace in which you want to edit the policy. Click Manage Policies. Choose the policy to edit.

Important


Consumer and Provider must include only Windows workloads.

Step 4

In the table row for the policy to edit, click the existing value in the Protocols and Ports column.

Step 5

In the pane on the right, click the existing value under Protocols and Ports.

In the example, click TCP : 22 (SSH).

The image illustrates the configuration of policies for Windows attributes, highlighting the selection of TCP port 22 for SSH in a consumer and provider setup.

Step 6

Click Show advanced options.

The image illustrates the configuration settings for TCP port 22 (SSH) in a policy management interface, highlighting the required application and service name fields.

Step 7

Configure consumer filters based on Application name, Service name, or User name.

  • The application name must be a full pathname.

  • Service name must be a short service name.

  • User name can be a local user name (For example, tetter) or domain user name (For example, sensor-dev@sensor-dev.com or sensor-dev\sensor-dev)

  • User group can be local user group (For example, Administrators) or domain user group (For example, domain users\\sensor-dev)

  • Multiple user names and/ or user group names can be specified, separated by ",".(For example, sensor-dev\@sensor-dev.com,domain users\\sensor-dev)

  • Service name and User name cannot be configured together.

Step 8

Configure provider filters based on Application name, Service name, or User name.

Follow the same guidelines as given for consumer filters in the previous step.

Step 9

Enter the paths to the binary, as applicable. Click Update.

For example, enter c:\test\putty.exe.


Known limitations
  • Windows 2008 R2 does not support filtering policies based on Windows OS.

  • The network policy allows configuration with a single username, but the MS Firewall UI supports multiple users.

Caveats
  • While using the Windows OS-based policies, ensure a consumer or provider scope or filter contains only Windows agents. Operating Systems other than Windows (Linux, AIX) will skip the policy and report a synchronization error in Enforcement Status.

  • Avoid creating Windows OS filters with loose filtering criteria, as they may open unwanted network ports.

  • OS filters configured for the consumer are applicable only to the consumer. Similarly, those confiured for the provider are applicable only to the provider.

  • Because of limited knowledge of network flow contexts, discrepancies may occur in policy analysis if Windows OS-based filters are used.

Windows OS-based filtering attributes

Use Windows OS-based filtering attributes to find verification and troubleshooting information.

Cisco TAC can use this information to troubleshoot policies as needed.

Policies based on application name

Use this information to verify and troubleshoot policies based on application names on Windows OS workloads.

The following sections describe the way policies should appear on the workload for an application binary entered as c:\test\putty.exe.

Sample policy based on application name
dst_ports {
start_port: 22
end_port: 22
consumer_filters {
application_name: “c:\test\putty.exe”
}
}}
ip_protocol: TCP
address_family: IPv4
inspection_point: EGRESS
Generated firewall rule
Generated filter using netsh

Use native Windows tools to verify that a Windows Firewall Platform filter is added to an advanced policy.

  1. Run cmd.exe with administrative privileges.

  2. Run netsh wfp show filters.

    The output file, filters.xml, is generated in the current directory.

  3. Check FWPM_CONDITION_ALE_APP_ID for the application name in the output file, filters.xml.

<fieldKey>FWPM_CONDITION_ALE_APP_ID</fieldKey>
                     <matchType>FWP_MATCH_EQUAL</matchType>
                     <conditionValue>
                            <type>FWP_BYTE_BLOB_TYPE</type>
                            <byteBlob>
                                   <data>
˓→5c006400650076006900630065005c0068006100720064006400690073006b0076006f006
˓→</data>
                                  <asString>\device\harddiskvolume2\temp\putty.exe</
˓→asString>
               </byteBlob>
       </conditionValue>
Generated WFP filter using tetenf.exe -l -f
Filter Name:                   Secure Workload Rule 1
------------------------------------------------------
EffectiveWeight:               18446744073709551592
LayerKey:                      FWPM_LAYER_ALE_AUTH_CONNECT_V4
Action:                        Permit
RemoteIP:                      10.195.210.15-10.195.210.15
Remote Port:                   22
Protocol:                      6
AppID:                         \device\harddiskvolume2\test\putty.exe
Invalid application name
  • In WAF mode, a firewall rule is created for an invalid application name.

  • In WFP mode, if the application name is invalid, a filter is not created. The policy is still accepted and a warning is logged.

Policies based on service name

Use this information to verify and troubleshoot policies based on service name on Windows OS workloads.

These sections describe how policies should appear on the workload.

Sample policy based on service name
    dst_ports {
             start_port: 22
             end_port: 22
             provider_filters {
                    service_name: “sshd”
             }
         }}
         ip_protocol: TCP
         address_family: IPv4
         inspection_point: INGRESS
Generated Firewall rule
The image illustrates a sample policy based on service name, showing the generated firewall rule and filter configuration for Windows OS workloads. It serves as a reference for verifying and troubleshooting policies.
Generated filter using netsh

Using native Windows tools, verify that a filter is added for an advanced policy:

  1. Run cmd.exe with administrative privileges.

  2. Run netsh wfp show filters.

    The output file filters.xml is generated in the current directory.

  3. Check FWPM_CONDITION_ALE_USER_ID for user name in the output file, filters.xml.

    <item>
                         <fieldKey>FWPM_CONDITION_ALE_USER_ID</fieldKey>
                         <matchType>FWP_MATCH_EQUAL</matchType>
                         <conditionValue>
                                    <type>FWP_SECURITY_DESCRIPTOR_TYPE</type>
                                    <sd>O:SYG:SYD:(A;;CCRC;;;S-1-5-80-3847866527-469524349-687026318-
    →516638107)</sd>
                         </conditionValue>
    </item>
Generated WFP filter using tetenf.exe -l -f
Filter Name:       Secure Workload Rule 3
------------------------------------------------------
EffectiveWeight:            18446744073709551590
LayerKey:                   FWPM_LAYER_ALE_AUTH_RECV_ACCEPT_V4
Action:                     Permit
Local Port:                 22
Protocol:                   6
User or Service:            NT SERVICE\sshd
Invalid service name
  • In WAF mode, the firewall rule is created for a nonexistent service name.

  • In WFP mode, the WFP filter is not created for a nonexistent service name.

  • Service SID type must be Unrestricted or Restricted. If the service type is None, adding firewall rule and WFP filters has no effect.

    To verify the SID type, run this command:

    sc qsidtype <service name>
Policies based on user group or user name

Use this information to verify and troubleshoot policies on Windows OS workloads using user name and user group name.

These sections describes how policies appear on the workload.

This topic provides examples of certain policy configurations:

Figure 26. Policies based on user group or user name
The diagram illustrates the structure and configuration of policies based on user group or user name for Windows OS workloads, highlighting key elements and their relationships.
Sample policy based on user name
dst_ports {
          start_port: 30000
          end_port: 30000
          provider_filters {
               user_name: “sensor-dev\sensor-dev”
           }
}}
ip_protocol: TCP
address_family: IPv4
inspection_point: EGRESS
Sample policy based on user group and user name
dst_ports {
start_port: 30000
end_port: 30000
provider_filters {
user_name: “sensor-dev\domain users,sensor-dev\sensor-dev”
}
}}
ip_protocol: TCP
address_family: IPv4
inspection_point: EGRESS
Generated firewall rule

Firewall rule based on user name

Example: Firewall rule based on user name, sensor-dev\\sensor-dev

The image illustrates a sample firewall rule based on user group and user name, showing specific examples for both user name and user group configurations.

Firewall rule based on user group and user name

Example: Firewall rule based on user name, sensor-dev\\sensor-dev and user group, domain users\\sensor-dev

Generated filter using netsh

Using native Windows tools, verify a filter is added for an advanced policy:

  • Run cmd.exe with administrative privileges.

  • Run netsh wfp show filters.

  • The output file filters.xml is generated in the current directory.

  • Check FWPM_CONDITION_ALE_USER_ID for user name in the output file filters.xml.

    <item>
                <fieldKey>FWPM_CONDITION_ALE_USER_ID</fieldKey>
                <matchType>FWP_MATCH_EQUAL</matchType>
                <conditionValue>
                       <type>FWP_SECURITY_DESCRIPTOR_TYPE</type>
                       <sd>O:LSD:(A;;CC;;;S-1-5-21-4172447896-825920244-2358685150)</sd>
                </conditionValue>
    </item>
Generated WFP filters using tetenf.exe -l -f

Filter based on user name

Example: WFP Rule based on User Name, SENSOR-DEV\sensor-dev

Filter Name:                   Secure Workload Rule 1
------------------------------------------------------
EffectiveWeight:               18446744073709551590
LayerKey:                      FWPM_LAYER_ALE_AUTH_CONNECT_V4
Action:                        Permit
RemoteIP:                      10.195.210.15-10.195.210.15
Remote Port:                   30000
Protocol:                      6
User or Service:               SENSOR-DEV\sensor-dev

Filter based on user group and user name

Example: WFP Rule based on user name, SENSOR-DEV\\sensor-dev and user group name, SENSOR-DEV\\Domain Users

Filter Name:         Secure Workload Rule 1
------------------------------------------------------
EffectiveWeight:             18446744073709551590
LayerKey:                    FWPM_LAYER_ALE_AUTH_CONNECT_V4
Action:                      Permit
RemoteIP:                    10.195.210.15-10.195.210.15
Remote Port:                 30000
Protocol:                    6
User or Service:             SENSOR-DEV\Domain Users, SENSOR-DEV\sensor-dev

Service name and user name cannot be configured for a Network policy rule


Note


The Windows agent rejects the network policy if the user name or the user group is invalid.


Kubernetes and OpenShift

(Optional) Additional policies for Kubernetes workloads

Depending on your Kubernetes environment, these procedures are optional.

Policies for Kubernetes Nginx ingress controller running in host-network mode

Secure Workload enforces policies at both the nginx ingress controller and backend pods when the pods are exposed to external clients using a Kubernetes ingress object.


Note


IBM-ICP uses Kubernetes Nginx Ingress controller by default and runs on control plane nodes in host network mode.


To enforce the policy using the Kubernetes Nginx Ingress controller:

Before you begin
  • Ensure the ingress controller is running in host network mode.

  • If the ingress controller is not in host network mode, refer to the IngressControllerAPI documentation for alternative solutions.

Procedure

Step 1

Create an external orchestrator for Kubernetes/OpenShift as required.

The diagram illustrates the policy enforcement process for the Kubernetes Nginx Ingress Controller operating in host-network mode, highlighting the interaction between the ingress controller and backend pods when exposed to external clients.

Step 2

Create an ingress object in the Kubernetes cluster using a yaml file. This illustration provides a snapshot of the yaml file used to create the ingress object.

The diagram illustrates the steps to enforce policies using the Kubernetes Nginx Ingress controller in host-network mode, highlighting key components and their interactions.
The diagram illustrates the policies and configurations for the Kubernetes Nginx Ingress Controller operating in host-network mode, highlighting key components and their interactions within the network architecture.

Step 3

Deploy the Kubernetes Nginx Ingress controller in the Kubernetes cluster. By default, IBM-ICP Ingress controller pods run on control plane nodes.

The diagram illustrates the policies and configurations for the Kubernetes Nginx Ingress Controller operating in host-network mode, highlighting key components and their interactions within the network architecture.

Step 4

Create a backend service for consumers outside the cluster. For example, use the svc-ce2e-teeksitlbiwlc (http-echo) service.

The diagram illustrates the policies and configurations for the Kubernetes Nginx Ingress Controller operating in host-network mode, highlighting key components and their interactions within the network architecture.

Step 5

Create a policy between external consumer and backend service.

The diagram illustrates the policies and configurations for the Kubernetes Nginx Ingress Controller operating in host-network mode, highlighting key components and their interactions within the network architecture.

Step 6

Enforce the policy once ready.

Step 7

In case of Nginx ingress controller Secure Workload software applies the appropriate allow/drop rule where the source will be consumer specified in the previous step and destination will be corresponding Ingress controller pod IP. In case of backend pods, Secure Workload software will apply the appropriate allow/drop rule where the source will be Ingress pod and destination will be the backend pod IP.


The applicable allow/drop rules are enforced for both ingress controller pods and backend pods based on the specified policies.
Policies for Kubernetes Nginx/Haproxy ingress controller running as deployment/daemonset

Secure Workload enforces policies at both the ingress controller and backend pods when they expose pods to external clients using a Kubernetes ingress object.

Follow these steps to enforce policies on the ingress controller to ensure secure connectivity.

Before you begin
  • Ensure you set up Kubernetes, OpenShift, and OpenAPI.

Procedure

Step 1

Create or update an external orchestrator for Kubernetes/OpenShift using OpenAPI. For more information on creating the external orchestrator using OpenAPI, refer to Orchestrators .

Step 2

Create an ingress object within the Kubernetes cluster.

Step 3

Deploy the ingress controller within the Kubernetes cluster.

Step 4

Create a backend service accessible to the external consumers outside the cluster.

Step 5

Create and define a policy between external consumers and the backend service.

Step 6

Enforce the policy once it is ready.

Step 7

For ingress controllers Secure Workload software applies the appropriate allow/drop rule where the source is the consumer specified in the previous step and destination is the corresponding ingress controller pod IP. For backend pods, Secure Workload software applies the appropriate allow/drop rule where the source is the ingress pod, and the destination is the backend pod IP.


Grouping workloads: clusters and inventory filters

Clusters and inventory filters serve similar purposes, but they have some important differences:

Table 5. Comparison of clusters and inventory filters

Clusters

Inventory Filters

Can apply policy to a subset of the workloads within a scope. Can apply policy to a subset of the workloads in a scope.

Can apply policy to workloads regardless of scope (for example, to apply a policy to all workloads running a particular operating system.)

Defined by a query

Defined by a query.

Includes only workloads in a single scope.

Can have membership restricted to a single scope or include workloads in any scope (for example, if the filter is based on operating system.)

Can be used by policies in the same workspace and workspace version.

Can be used by policies in any scope and any workspace.

Created automatically during automatic policy discovery.

Created manually or converted from an existing cluster.

Overwritten during automatic policy discovery when not approved. Approving known good clusters can improve accuracy of other clusters in future discovery runs.

Never modified by automatic policy discovery.

Benefit from important features of automatic policy discovery. These features include:

  • Assigned a confidence rating, which helps to evaluate whether the workloads in the group belong together.

  • Can be compared with clusters generated during other policy discovery runs on the same workspace.

--

Cannot be used when configuring External dependencies and other features related to cross-scope policies and policy discovery.

Can be used to configure granular policies involving external dependencies and other features related to cross-scope policies, such as auto-pilot rules.

For more information, refer to Clusters and subtopics.

For more information, refer to Create an inventory filter and Convert a cluster to an inventory filter.

Clusters

A cluster is a collection of workloads grouped together within a workspace. (A Secure Workload deployment can also be called a cluster, but the two usages are unrelated.)

For example, if your application scope includes several web servers among many other types of servers and hosts that comprise your application, you might want a cluster of web servers within this application scope, so you can assign specific policies only to these web servers.

Automatic policy discovery groups workloads into clusters based on the signals observed during the specified timeframe in the run configuration.

Each cluster is defined by a query

Cluster queries are dynamic unless you define them with specific IP addresses. With dynamic queries, cluster membership can change over time to reflect changes in your inventory: More, fewer, or different workloads can match the query.

For example, if a cluster query is based on hostname containing the substring, new hosts matching the criteria automatically join the cluster.

Automatic policy discovery examines the hostnames and labels associated with workloads. For each cluster, it generates a short list of candidate queries. From these queries, you can select one, possibly edit it, and associate it with the cluster. In certain cases, when automatic policy discovery cannot formulate simple enough queries, alternate queries may not be suggested.

Workloads in approved clusters are not affected by future policy discovery

Only workloads that are not already members of an approved cluster in the relevant workspace are affected by policy discovery. An approved cluster is a cluster that you have manually approved. For details, see Approvals of clusters.

Edit clusters to improve grouping

The sections describe workflows to edit, enhance, and approve the clustering results. Note that one can change or approve clusters only in the latest version of a workspace (see History & Diff ).

See Making changes to clusters.

Clusters involving Kubernetes inventory


Note


If your workspace includes inventory from multiple Kubernetes namespaces, each cluster query must filter by namespace. Add the namespace filter to each query if it is not already present. If you change any query, then automatically discover the policies again.


A cluster may consist of a single workload.

You may want to create policies involving just a single workload.

Clusters may be converted to inventory filters

Like approved clusters, clusters promoted to inventory filters are not changed during subsequent policy discovery.

Unlike clusters, inventory filters are not tied to a workspace, but are globally available within your Secure Workload deployment.

To compare clusters and inventory filters, refer to Grouping workloads: clusters and inventory filters.

For more information, refer to Convert a cluster to an inventory filter.

Cluster confidence

Cluster confidence is a metric that

  • indicates clusters needing improvement based on the confidence or quality score,

  • calculates the average confidence of member workloads, and

  • shows the similarity of a workload to its assigned cluster compared to alternative clusters.

When flows are used for clustering, two workloads are similar if they have similar patterns of conversations, such as similar sets of neighbors in the conversation's graph, equivalent to similar consumer and provider workloads and ports.


Note


  • Cluster confidence is not computed (undefined) for these cases:

    • clusters with one workload

    • approved clusters

    • workloads in the scope where no communication was observed (or no process information is available, if process-based clustering was chosen)

  • Clusters do not span partition boundaries, like subnet boundaries.When computing confidence and alternate clusters, these boundaries are ignored. This indicates that workloads or clusters can exhibit similarl behaviors in different subnets.

  • Editing clusters affects confidence scores, and they remain inaccurate until policies are rediscovered.


For more information on viewing cluster confidence, refer to View clusters.

View clusters

A cluster view is a navigational feature that:

  • supports query-to-cluster association and query editing,

  • allows sorting of clusters based on various attributes (such as name and number of workloads, or confidence), and

  • facilitates detailed cluster information access, allowing for editing and further query approval.

You can view clusters and their details by performing these steps:

  1. Navigate to the scope and workspace of interest.

    Clusters are specific to a workspace; each workspace in a scope can have different clusters. To make clusters available outside their current workspace, refer to Convert a cluster to an inventory filter.

  2. Click Manage Policies.

  3. Click Filters.

  4. Click Clusters.

  5. To view information about a cluster, click a cluster.

    1. Look at the panel that opens on the right.

    2. For more details, click View cluster details.

      The Cluster Details page opens in a new browser tab.

Figure 27. Clusters View
Clusters View

Making changes to clusters

A cluster query is a filtering mechanism that:

  • helps refine the cluster grouping,

  • determines membership dynamics, and

  • affects policy discovery based on changes in the cluster.

Automatic policy discovery generates candidate queries for each cluster. Edit the query to improve clustering outcomes if they do not align with expectations.

To browse and edit clusters:

  1. Click the clusters box on the page.

  2. Select or edit the cluster’s query to change a cluster. For example, change the members of a cluster or select or change its query.

    Figure 28. Edit Cluster
    Edit Cluster

    You can add or remove explicit IP addresses or select another query from the list of alternatives provided and edit them A cluster’s query can be any query filter expressed in terms of addresses, hostnames, and labels. If you define a query based on labels instead of explicit IP addresses, the cluster will be dynamic, and new, changed, or removed inventory that is properly labeled will automatically be included in or excluded from the cluster.

  3. After editing, click Save.

    When saved, the cluster is marked as , indicated by a blue thumbs-up icon. You can toggle the approval status as needed. For more information, refer to Approvals of clusters.


Important


  • Changing a cluster's membership may necessitate policy rediscovery to ensure policies accurately reflect new or modified flows between clusters.

  • Changes in workspace scope or membership require a similar update process, with potential impacts on cluster confidence scores.

  • Editing cluster queries may cause overlapped queries. Automatically rediscover policies to update configurations and unapproved cluster confidences

Ensure to rediscover policies post-editing to reflect updates in cluster configurations and scores.


Convert a cluster to an inventory filter

Convert a cluster to an inventory filter if:

  • You do not want it to be modified by future automatic policy discovery runs, as a more versatile alternative to approving the cluster.

  • You want it to be independent of the workspace version.

  • You are creating or discovering policies where consumers and providers belong to different scopes and you want to create policies specific to a subset of workloads in a scope, not just policies involving the entire scope.

    Use inventory filters instead of clusters when creating cross-scope policies using the advanced method as described in When consumer and provider are in different scopes: policy options and you want policies to be more granular than scope-to-scope.

Procedure

Step 1

Navigate to the workspace that contains the cluster you want to promote.

Step 2

Click Manage Policies.

Step 3

Click Filters.

Step 4

Click Clusters.

Step 5

Select the cluster you want to use in the cross-scope policy.

Step 6

In the panel on the right, in the Cluster Actions section, click The image illustrates the process of converting a cluster into an inventory filter, highlighting the specific scope boundaries that should be maintained for workload inclusion. (Promote to Inventory Filter.)

Step 7

Make sure the name, description, and query are as expected.

Step 8

Select Restrict Query to Ownership Scope.

Inventory filters can cross scope boundaries, but you do not want this behavior for this purpose; you want this filter to include only workloads in this scope.

Step 9

If you want the application defined by this inventory filter to be the provider in policies generated during automatic policy discovery, select Provides a service external of its scope.

If this application acts as a consumer instead of a provider, or if the inventory filter is used only for manually created policies, you do not need to enable this option.

Step 10

Click Promote Cluster.

Step 11

Confirm the cluster is displayed in the Inventory Filters tab.

You may need to refresh the page to see this change.


Creating or deleting clusters

You can create a new cluster:

  1. Click Create Cluster on the clusters page to create a new empty cluster.

  2. Click Create Filter from the automatic policy discovery page and select Clusters.
    Figure 29. Creating a new Cluster
    Creating a new Cluster

    The new user-defined cluster appears on the side panel where you can rename it as needed. Rename clusters to organize them logically for better management.

    Figure 30. Renaming a Cluster
    Renaming a Cluster

You can delete an empty cluster.

  1. Select the cluster to view its details.

  2. Click the trash button located on the header of the cluster detail view.

Comparing versions of generated clusters: Diff Views

After you automatically discovering policies at least twice for a workspace, you can compare the generated clusters from different discovery runs to analyze changes.

Before you begin
Ensure discovery runs are completed twice or more for effective comparison.
Procedure

Step 1

Navigate to the clusters diff view using one of these paths:

  • After successfully discovering policies, a success message appears with a link that lets you navigate to the diff view showing discovery results. Click the results link.

    Figure 31. Successful automatic policy discovery run
    Successful automatic policy discovery run
  • Compare revisions from the versions view:

    1. Follow the steps in View, compare, and manage discovered policy versions.

    2. Click Compare Revisions, then click Clusters.

  • From the version details side panel:

    1. Follow the steps to view version details in View, compare, and manage discovered policy versions.

    2. From the side panel, click the double-arrow button to display the context transition.

      Figure 32. Showing Context Information
      Showing Context Information

Step 2

Select the versions to compare.

Step 3

Review the comparison results:

At the top level, the diff view for automatically discovered policies shows high-level statistics about changes in clusters and workloads showing the number of added, deleted, modified, and unchanged clusters and workloads.

The rest of the view is organized as a list of clusters categorized as added, deleted, modified, and unchanged. Each cluster is color-coded to show its status and reflects the number of workloads added to or removed it.

Search for a cluster or workload by name or IP address. To see changes in a cluster's contents, click any arrow representing a cluster to expand it.

Note


By default, unchanged clusters are hidden. To display uncheanged clusters, click the eye icon.

Figure 33. Cluster Diff View
Cluster Diff View

What to do next

To view a similar policy comparison, refer to Policy Diff .

Preventing cluster modification during automatic policy discovery reruns

Approve the cluster to prevent automatic policy discovery from modifying a cluster during future policy discoveries for the workspace.

Examples of clustering policy in use:

  • Modify the query and approve the cluster to ensure new workloads can be added without affecting existing policies. For more information, refer to Approvals of clusters.

  • Use inventory filters to promote clusters that should remain unaffected by automatic policy discovery. For more information, refer to Convert a cluster to an inventory filter.

Approvals of clusters

Cluster approvals are essential for maintaining the health of a workload. Workloads that are members of an approved cluster are referred to as "approved workloads". The membership of approved clusters changes only if the members of the workspace are changed.


Note


For more information, refer to Convert a cluster to an inventory filter.


To approve a cluster, review the cluster details on the side panel and then select the check box on the cluster information panel. Approval of the cluster ensures it remains unchanged by future automatic policy discovery.

Figure 34. Approve Clusters
Approving Clusters

After you approve a cluster, subsequent automatic policy discovery does not change the cluster query.

To remove approval of a cluster, deselect the approval check box .

Figure 35. Deselect the approval of a cluster
Removing Approval of a Cluster

Address policy complexities

A policy complexity is a set of factors that

  • influences enforcement results,

  • depends on rule type and rank, and

  • requires awareness of policy interactions across scopes.

Several factors impact your enforcement results.

  • Rule type and rank: The distinction between absolute and default policies, and the catch-all setting for the workspace

    For more information, refer to Policy ranks: Absolute, Default, and Catch-All.

  • Order of policies within the workspace: Policies are applied based on their order, impacting enforcement.

    For more information, refer to Policy priorities.

  • Inheritance: Policies inherited from parent or ancestor scopes, including the catch-all rule can affect traffic.

    Ensure that a higher-priority policy does not affect the traffic before the expected policy takes effect.

    To see the impact of policies in ancestor scopes, run live policy analysis on all involved scopes, refer to Live policy analysis.

    Use the wizard to identify which inherited policies impact workloads before enforcing the policies in a workspace. For information, refer to Policy enforcement wizard.

  • Cross-scope policy interactions: When consumer and provider are in different scopes, or one end of the conversation is in a different scope than the policy. For more information, refer to When consumer and provider are in different scopes: policy options.

  • Exception cases: Instances where the actual consumer or provider in a policy differs from the default configured consumer and provider, such as in failover scenarios. For more information, refer to Effective consumer or provider.

Policy priorities

In a network environment, policy priority is a configuration that:

  • Determines the relative importance of different policies.

  • Affect how traffic is handled by prioritizing certain policies over others.

  • Ensures critical policies are enforced first, followed by less critical ones.

Traffic handling is affected by:

Policy priorities within a scope

Within a workspace, the order of the policies in the list reflects their relative priorities:

  • Ensure that policies with the highest priority policy are at the top of the list, while those with the lowest priority policy are at the bottom of the list.

  • Absolute policies have higher priority than default policies

  • The Catch-All policy is the lowest priority policy in the workspace.

For more information, refer to Policy ranks: Absolute, Default, and Catch-All.

Policy global ordering and conflict resolution

A global policy is a mechanism that

  • resolves conflicts between contradictory policies defined under different scopes,

  • imposes a global order based on scope, and

  • accurately applies these sorted policies to workloads.

Within this framework, conflicts arise for workloads within multiple scopes. Dynamic scope membership exacerbates these conflicts, necessitating global ordering. For each workload, the list of relevant policies is identified and sorted by the global order. The decision to permit or drop a flow is made based on the first matching policy in the sortwheed list.

Network administrators can define the correct scopes and their priorities to apply overall desired policies by understanding the global ordering scheme of security policies. Application owners enforce detailed policies within each scope on their workloads.

A global network policy has the following characteristics:

  • A set of scopes ordered by priority, affecting the global order of policies

  • Absolute and default policies in each workspace are ranked by local priority.

The global order of policies is defined as follows:

  • Groups of absolute policies from the primary workspaces of all scopes, sorted from highest to lowest priority.

  • Groups of default policies, sorted from lowest to highest priority.

  • Catch-all policies from all scopes, ordered similarly.

Note that the scope order applies to groups of policies in category 1 and 2, rather than individual policies. Within each group, individual policies with lower policy priority numbers taking precedence.

For a specific workload, first determine the subset of scopes for a specific workload, then apply the order. The catch-all policy from the lowest priority (enforced) workspace to which this workload belongs is the applicable catch- all (but an absolute or default policy may override). For a given flow on that workload, the action of the highest matching policy is applied.


Note


  • If a workspace has neither Absolute nor Default policies defined, the workspace is ignored. The workspace’s catch-all policy will not be included in the global order.

  • The order of Default policies in the global order is the reverse of the scope priorities. This lets you define broad policies for all scopes to secure the perimeter of all workspaces including those that do not have policy enforcement enabled. At the same time application owners who have enabled enforcement on their scopes have the ability to override these default policies.

  • Overlapping scopes are not recommended; see Scope overlap for details. However, if a workload has two or more interfaces, in overlapping or disjoint scopes, the catch-all policy of the lowest priority workspace with enforcement enabled will apply (among all the applicable catch-all policies).

We expand our previous three-scope example to illustrate this ordering scheme. Assume that these three scopes are assigned the priorities indicated:


  1. Apps

  2. Apps:HR

  3. Apps:Commerce

For instruction on how to change scope priorities, refer to Application Workspaces.

The primary workspace of each of these scopes has absolute policies, default policies and a catch-all action. Each group of absolute or default policies within each workspace is sorted according their local priorities.

The global ordering of the policies are as follows:

  1. Apps Absolute policies

  2. Apps:HR Absolute policies

  3. Apps:Commerce Absolute policies

  4. Apps:Commerce Default policies

  5. Apps:HR Default policies

  6. Apps Default policies

  7. Apps:Commerce Catch-all

  8. Apps:HR Catch-all

  9. Apps Catch-all

A workload that belongs to the Apps scope will receive only the following policies in the given order:

  1. Apps Absolute policies that match the workload

  2. Apps Default policies

  3. Apps Catch-all

A workload that belongs to the Apps and Apps:Commerce scopes receive only the following policies in this sequence:

  1. Apps Absolute policies

  2. Apps:Commerce Absolute policies

  3. Apps:Commerce Default policies

  4. Apps Default policies

  5. Apps:Commerce Catch-all

A workload that belongs to the Apps and Apps:HR scopes will receive only the following policies in the given order:

  1. Apps Absolute policies

  2. Apps:HR Absolute policies

  3. Apps:HR Default policies

  4. Apps Default policies

  5. Apps:HR Catch-all

Policy Order and Overlapping Scopes

Important


The following scenario involves overlapping scopes. You should avoid having overlapping sibling scopes – workloads should not be members of multiple branches of the scope tree. For more information, see Scope overlap.


A workload that belongs to all three Apps, Apps:HR and Apps:Commerce scopes will receive the following policies in the given order:

  1. Apps Absolute policies

  2. Apps:HR Absolute policies

  3. Apps:Commerce Absolute policies

  4. Apps:Commerce Default policies

  5. Apps:HR Default policies

  6. Apps Default policies

  7. Apps:Commerce Catch-all

The relative ordering of the Apps:HR and Apps:Commerce scopes is significant only if the scopes overlap (that is, there are workloads that belong to both sibling scopes.) This is because policies are always defined under a scope. A workload belonging to one scope only will not be affected by policies from the other scope, thus the order does not matter.

Validate the order and priority of policies

Validating policy order and priority is a procedure to

  • verify the configured sequence of policies,

  • identify policies in parent or ancestor workspaces, and

  • view analyzed and enforced policies globally.

To assess and adjust policies, follow these steps:

To validate the order and priority of policies in parent or ancestor workspaces,

  1. Click the Analyzed Policies tab or the Enforced Polices tab at the top of the Defend > Segmentation page. These views provide a global view of the analyzed and enforced policies respectively.

    Figure 36. Example: List of enforced policies in their policy priority order
    List of enforced policies in their policy priority order
  2. Limit the policies shown by selecting a specific scope or by entering a filter as a consumer or provider.

    Available filters include:

    Filter Name

    Definition

    Port

    Policy port to match, for example, 80.

    Protocol

    Policy protocol to match, for example, TCP.

    Approved

    Matches policies that have been marked as Approved.

    External?

    Policies in which the consumer or provider reside in different scopes.

    Action

    Policy action: allow or deny

(Advanced) Change policy priorities

Changing policy priorities can significantly affect enforcement results across workspaces and should be performed with caution.


Note


Scope policy priority order must be changed only if required.


Only users with roles of high privilege, such as Tenant Owner can access this feature.

Before you begin

Before changing scope priority order:

  • Understand policy sorting logic and how policy priorities on scopes translate to ordering of individual policy intents. For more information, refer to Policy priorities.

  • Make changes in a secondary workspace until you are confident in the new order.

  • Plan your changes considering these guidelines:

    Keep a parent-first ordering (parent scopes preceding child scopes) to take advantage of the hierarchical structure of your scope tree.

    If you have overlapping sibling scopes, it may be necessary to reorder sibling scopes and their children. Overlapping sibling scopes are not recommended. Fix these by updating scope queries, refer to Scope overlap.

Procedure

Step 1

Choose Defend > Segmentation, and then click the < icon to expand the Tools pane to reorder policy priority.

Step 2

Click the three-dot icon next to Tools menu to choose Policy Order.

Figure 37. Navigate to Policy Priorities page
Navigating to Policy Priorities page

On the Policy Order page, you can see the list of all scopes and their corresponding primary workspaces according to the current policy priority.

Step 3

There are several ways to reorder the scopes:

  • To reorder the list so that parent scopes are listed before child scopes, pre-order: Click Reorder Naturally. This is the recommended order and any deviation from this should be done with care.

  • To reorder the list manually, perform these steps:

    • Drag the rows up and down

    • Click By Number to set a number for each scope to be used for sorting. This can be easier for large lists.

Figure 38. Set Policy Priorities for Scopes
Setting Policy Priorities for Scopes

The desired order of policy priorities is set, ready to be enforced.
What to do next

Run Quick Analysis to see the results of your changes.

When consumer and provider are in different scopes: policy options

Example scenario

When a cross-scope traffic scenario occurs, such as:

  • Network Services hosts a provider application.

  • HR hosts a consumer application.

  • They reside in different branches of the scope hierarchy.

Example of cross-scope situation

Policy options

Secure Workload offers several ways to address this situation:

Option

Instructions

Pros and Cons

Create policies in a parent or ancestor scope that includes both consumer and provider as children or descendants

  • Manually create one or more policies in the common-ancestor scope.

    (Optional) For more precise policies, group workloads using inventory filters. For examples and instructions, see Create an inventory filter.

  • Automatically discover policies in the common-ancestor scope, for the entire branch of the scope tree.

These methods are the simplest way to address cross-scope policies.

With these methods, only one policy is required for each consumer-provider pair.

If you are considering using automatic policy discovery, see important considerations in Discover policies for one scope or for a branch of the scope tree.

Use the advanced method for creating cross-scope policies

Automatically discover policies for each individual scope.

For more information, refer to (Advanced) Create cross-scope policies.

(This procedure applies to both manually created policies and discovered policies.)

This method requires two policies for each consumer-provider pair: a policy for the consumer and a policy for the provider.

This method allows you to create policies when differet people own consumer and provider policies.

Refer other considerations in Discover policies for one scope or for a branch of the scope tree.

(Advanced) Create cross-scope policies

This procedure describes an advanced method for creating cross-scope policies involving consumer and provider in different scopes. It applies to both manually and automatically discovered policies and involves creating two policies for each consumer-provider pair, ensuring both ends permit the conversation:

  • A policy in the consumer's scope must allow conversations with the provider,

    and

  • A policy in the provider's scope must allow conversations with the consumer.

This procedure details the necessary steps for each scope owner to create cross-scope policies. If your access privileges allow you to modify both scopes, you can perform all steps.

Before you begin
Procedure

Step 1

In the consumer's primary workspace, create the desired policy, manually or automatically.

This automatically generates a policy request for the provider.

To view the policy requests, see Viewing, accepting, and rejecting policy requests.

Note


Verify that existing policy matches in the provider workspace to avoid unnecessary policy duplication. This situation is indicated as described in Resolved policy requests.

Step 2

Respond to each policy request:

For more information, refer to Viewing, accepting, and rejecting policy requests.

  • Accept requests to approve policy creation in the provider's primary workspace.

  • Reject requests if traffic from the requesting application should not be allowed.

Step 3

(Optional) Fine-tune any auto-discovered policies. For more information, refer to Fine-tune external dependencies for a workspace.

Step 4

Review and individually validate both primary workspaces to ensure all policies are correct.


The policies, once implemented correctly, facilitate cross-scope communications efficiently.
What to do next

When satisfied, enforce the policies in both primary workspaces to activate them.

Policy requests

Policy requests are generated when you create cross-scope policies using the method described in (Advanced) Create cross-scope policies. Each time a policy is created in a consumer scope's primary workspace when the provider is a member of a different scope, if the policy does not exist in the primary workspace associated with the provider's scope, a policy request is generated.

This policy request alerts the owner of the provider application to allow dependent applications to access necessary services.

See options for viewing and responding to policy requests at Viewing, accepting, and rejecting policy requests and Automate handling of cross-scope policy requests.

Additional details about policy requests
  • The provided services page (on which policy requests appear) is only available to primary workspaces. This ensures isolated experiments on secondary workspaces do not create notifications on primary workspaces.

  • When a provider specified in the policy belongs to a different scope and the external scope lacks a primary workspace, no policy requests are sent (for example, this could be the case for the root scope, or scope defined for workloads outside the organization). If an external scope has not published any policy, policy analysis and enforcement are carried out on the consumer end only.

  • Clusters are not supported when providers are in different scopes. If the policy’s consumer is a cluster, the policy request will be made as if the policy request were from the consumer application’s scope. Multiple policies consuming the same service from a provider could be grouped together.

  • Policy requests are generated only for providers, not for consumers. If a consumer workspace is analyzing or enforcing policies, it has to explicitly include policies that allow all its legitimate consuming flows, either through automatic policy discovery or by explicitly manually crafting policies (no policy requests from external provider workspaces are generated to it).

Viewing, accepting, and rejecting policy requests

When creating cross scope policies using the method described in (Advanced) Create cross-scope policies, a policy is required in the primary workspace of the provider's scope in addition to the policy in the consumer's scope. When a cross-scope policy is created in the primary workspace of the consumer's scope, a policy request is automatically created in the primary workspace of the provider's scope.

Use the information in this topic to accept the request (to create the required policy in the provider scope) or reject the request (in which case the cross-scope policy will not take effect.)

To view, accept, or reject policy requests

To

Do This

View all policy requests

  1. Choose Defend > Segmentation.

  2. Click Policy Requests at the top of the page.

  3. Click a consumer scope to see policy requests from that scope.

View policy requests for a particular scope

To view pending policy requests for a provider scope:

  1. Choose Defend > Segmentation.

  2. Click the primary workspace of the applicable scope.

  3. Click Manage Policies.

  4. Click Provided Services.

    If the tab does not display a number, there are no policy requests pending for this workspace.

  5. Click Policy Requests.

  6. Click a consumer scope to see policy requests from that scope.

Or

To view a policy request from the consumer scope:

In the Policies tab of the primary workspace of the consumer scope, click the value in the Protocols and Ports column, then look at the panel that opens on the right side of the page. In the Protocols and Ports section, click a yellow dot to see pending policy requests.

Manually accept a request and automatically create the required policy in the Provider scope

From either of the locations above, click Accept next to the policy request.

Manually reject a request

From either of the locations above, click Reject next to the policy request.

View policy request status from the consumer workspace

On the Policies page of the primary consumer workspace, click the policy, then click the port/protocol value. Status is shown in the panel that opens on the right.

A pending request is shown with a yellow dot:

When the request is accepted, the dot changes to a green check mark:

Click the indicator for details.

View policy request status from the provider's workspace

View request status in the Provided Services tab described above.

Allow policy discovery to create the required policy for the provider

Automatically discover policies in the provider scope's primary workspace, using a time range that ensures that the corresponding flows are seen, then publish the policy.

See also options for automating handling of policy requests

Automate handling of cross-scope policy requests

Figure 39. Pending policy requests in the provider's workspace
Pending policy requests are indicated by a number on the Provided Services tab
Accepting Policy Requests: Details

Accepting a policy request on a service creates a policy from the requested filter that applies consumer settings to the service provider. Additionally, when you accept a policy request, the original policy from the consumer application’s workspace (in the example, FrontEnd application and Serving Layer) is marked as accepted.

Figure 40. Accepting/Rejecting policy requests
Accepting/Rejecting policy requests
Figure 41. Policy status shown as Accepted
Policy status shown as Accepted

The new policy created on the provider application’s workspace (in this example, the workspace is named Tetration) is marked with a plus icon indicating it was created due to an external policy request.


Note


If the original policy on the consumer side is deleted after the policy request is accepted, the policy on provider's side will not be deleted. However, the tooltip next to the policy shows the original policy as deleted with the timestamp of the event:


Figure 42. Provider side policy, created by accepting a policy request
Provider side policy, created by accepting a policy request
Rejecting Policy Requests: Details

Rejecting a policy request does not create or update any policies. The original policy from the consumer application’s workspace (in the example, Serving Layer application) is marked as rejected, but the policy remains in effect; and outbound traffic will continue to be allowed. The tooltip next to the rejected policy has information about the provider application, the user who rejected the policy request, and the time of the rejection.

Figure 43. Policy status shown as Rejected
Policy status shown as Rejected
Automate handling of cross-scope policy requests

Policy requests are generated when you create cross-scope policies using designated methods described in (Advanced) Create cross-scope policies.

There are several options to reduce the number of policy requests generated when creating cross-scope policies:

Table 6. Options for Automatically Handling Policy Requests

To

Do This

Specify handling of policy requests between specific consumer-provider pairs

Consult the relevant guidelines to ensure you have the necessary privileges as described in Auto-pilot rules.

You must have the required privileges.

Automatically create required policies for all cross-scope policies created during policy discovery in a particular workspace

When you start an automatic policy discovery run, enable the Auto accept outgoing policy connectors option in the Advanced Configurations section.

This option is available only to root scope owners and site administrators.

For details, refer to:

Advanced configurations for automatic policy discovery and

Auto accept policy connectors

Specify default handling for all policy requests from all workspaces

On the Default Policy Discovery Config page, enable the Auto accept outgoing policy connectors option in the Advanced Configurations section.

This option is available to root scope owners and site administrators only.

For details, refer to:

Default policy discovery config and

Advanced configurations for automatic policy discovery and

Auto accept policy connectors

Auto-pilot rules

An auto-pilot rule is a feature in policy management that helps to optimize decision-making by

  • automatically processing incoming policy requests,

  • filtering requests based on defined criteria such as consumer-provider pair and specified ports, and

  • alleviating the burden of handling large-scale policy requests manually in data center applications.

This feature applies only when you create cross-scope policies using the method described in (Advanced) Create cross-scope policies.

Infrastructure applications that provide services to many applications in a datacenter may receive a large number of policy requests from other applications.

You can reduce the volume of policy requests by creating auto-pilot rules to automatically accept or reject future matching policy requests.


Note


Auto-pilot rules do not apply to existing policy requests. They affect only future policy requests.


Automatically accept or reject policy requests using Auto-Pilot Rules

Configure auto-pilot rules to automatically accept or reject policy requests between a specified consumer-provider pair and specified ports. Auto-pilot rules can be broad (scope-to-scope), or apply only to a subset of workloads within each scope (as configured by inventory filters. You can use an inventory filter for the consumer, for the provider, or for each.)

  1. If you want your auto-pilot rule to apply to a subset of workloads within a scope rather than to the entire scope:

    Create an inventory filter in the relevant scope(s) to group the workloads. Be sure the Restrict Query to Ownership Scope option is selected in each inventory filter, to ensure that the filter only includes workloads that are members of the scope.

  2. Choose Defend > Segmentation.

  3. Click the primary workspace of the consumer scope for which you want to automatically accept or reject policy requests related to a specific provider.

  4. Click Manage Policies.

  5. Click Provided Services.

  6. If you are creating this rule for an inventory filter, perform these steps for the desired inventory filter (inventory filters are identified by an orange icon.)

    Otherwise, perform these steps for the scope (scopes are identified by a blue icon.)

    Ensure that you are clicking in the correct place.

  7. Click No Auto-Pilot Rules or auto-pilot rules, whichever is displayed.

  8. Click New Auto-Pilot Rule.

  9. Configure the auto-pilot rule. Select the scope or inventory filter that represents the provider.

  10. Click OK.

Example Auto-pilot rule

In this example, we create a new auto-pilot rule to reject TCP policy requests in port range 1 to 200 from any consumer contained in Tetration:Adhoc to the provider service Tetration

Figure 44. Creating/Updating Auto-pilot rules
Creating/Updating Auto-pilot rules

Then we create a new policy in the workspace for the FrontEnd App on TCP port 23. Since the policy is a match for the auto-pilot rule, it will be automatically rejected. The status and reason for policy rejection are indicated on the tooltip next to the rejected policy.

Figure 45. Policy automatically getting rejected by Auto-pilot rule
Policy automatically getting rejected by Auto-pilot rule
View a count of policies recently created by auto-pilot rules

To view the number of policies created in a workspace by auto-pilot rules since the last initiation of live policy analysis. (or re-initiated) for the workspace:

Navigate to the Provided Services page for the relevant primary workspace and look for the count of “Auto Created” policies.

Auto accept policy connectors

A policy connector is a configuration setting that

  • allows automatic acceptance of policy requests,

  • applies to manual, imported, and ADM-discovered policies, and

  • is available only for root scope owners or site administrators.

You can set Auto accept policy connectors option as the default policy discovery configuration, or set it in the automatic policy discovery advanced options for each workspace.

The Auto accept outgoing policy connectors option on the automatic policy discovery configuration page allows you to automatically accept any policy requests created as part of automatic policy discovery.

When you enable this option in the default automatic policy discovery config, it will also automatically accept policy requests created manually or by importing a workspace.

Figure 46. The Auto accept outgoing policy connectors option
Select Auto accept outgoing policy connectors option

After setting this option, any policy request created in any workspace by the root scope or in the applicable workspace will be automatically accepted.

Figure 47. Policy is automatically accepted by Auto accept policy connectors
Policy automatically getting accepted by Auto accept policy connectors

This improves policy management efficiency and ensures automatic policy validation and implementation within designated scopes.

Resolved policy requests

If all conditions for creating a policy request are met and a matching policy exists on the provider application’s workspace, the policy created on the consumer application’s workspace will be marked as resolved. This indicates that the provider application’s workspace allows the traffic through the requested port.

Figure 48. Policy status shown as Resolved
Policy status shown as Resolved
Provided services

A provided service is a network application component that:

  • allows the creation of policies between consumers and providers in different scopes,

  • list current policy requests to the application, and

  • enables marking filters as public to facilitate service dependencies.

The Provider Services page is used only for creating policies in which the consumer and provider are in different scopes using the method described in (Advanced) Create cross-scope policies.

For more information about options on this page, see:

Navigate to a primary workspace, then click Manage Policies, then click Provided Services to access this page.

Troubleshoot cross-scope policies

  • Check if cross-scope policies were created according to the method described in (Advanced) Create cross-scope policies. Make sure policies are present in both consumer and provider workspaces. You will not receive notifications if you delete or modify a policy.

  • Confirm that policy pairs are protected during discovery by approving them. For more information, refer to Approve policies

  • Make sure you consistently meet all requirements listed in the cross-scope policy creation tasks. For more information, refer to (Advanced) Create cross-scope policies

  • Ensure that workspaces with required policies have enforcement activated.

Useful tools for cross-scope policies
  • Use the External? filter option to detect policies when the provider is in a different scope from the discovered policies.

  • Use the policy visual view to display external policies. See Policy visual representation.

Default Policy Discovery Config

On the Default Policy Discovery Config page, ensure to save changes to make default external dependency configurations available across workspaces.

Effective consumer or provider

The consumer and provider specified in a policy determine:

  • The set of workloads with Secure Workload agents that receive the policy.

  • The set of IP addresses that are affected by the installed firewall rules.

These are the same by default.

However, you may need to specify a group of IP addresses in the firewall rules that is different from the IP addresses of the workloads that receive the policy. (See an example below.)

To address this need, you can configure effective consumer or effective provider, or both.

Default behavior for consumer and provider

By default, when a Secure Workload agent receives a policy, the firewall rules are specific to that workload. An example of this is shown here.

Consider an ALLOW policy with provider filter specifying 1.1.1.0/24 subnet. When this policy is programmed on a workload with IP address 1.1.1.2, the firewall rules look like the following:

  • For incoming traffic firewall rules allow traffic destined to 1.1.1.2 specifically and not to the whole subnet 1.1.1.0/24.

  • For outgoing traffic firewall rules allow traffic sourced from 1.1.1.2 specifically and not from the whole subnet 1.1.1.0/24 (to prevent spoofing).

As a corollary, any agent workloads belonging to the workspace that do not have IP address within 1.1.1.0/24 subnet will not receive the above firewall rules.

Example: Effective Consumer or Effective Provider

In this example, suppose you are configuring policies for a fleet of workloads behind a virtual IP (VIP), similar to keepalive or windows failover clustering solutions. You will use effective consumer and /or effective provider to ensure that traffic is not disrupted during a failover event.

Consider a fleet of workloads with IP addresses (172.21.95.5 and 172.21.95.7) that provide a service sitting behind a VIP - 6.6.6.6. This VIP is a floating VIP and only one workload owns the VIP at any point in time. The goal is to program firewall rules on all the workloads in the fleet to allow traffic to 6.6.6.6.

In this setup, we have a scope and a corresponding workspace that contain a cluster of workloads that represents the fleet (172.21.95.5 and 172.21.95.7) as well as the VIP (6.6.6.6).

Figure 49. Scopes including VIP and cluster of workloads
Scopes including VIP and cluster of workloads

The VIP is exposed in this workspace as a provided service as shown below:

Figure 50. VIP exposed as a provided service
VIP exposed as a provided service

If we were to add a policy from the clients of this service to the service VIP, then (by default) firewall rules allowing traffic to the VIP will only be programmed on the workload that owns the VIP. However, in case of a failover event, it may take some time for the new workload that subsequently owns the service VIP to get the right firewall rules and traffic may be disrupted for a brief while.

Figure 51. Policy allowing traffic from clients to service VIP
Policy allowing traffic from clients to service VIP

To address this issue, we configure the Effective Provider using a specific procedure. Specifically, Effective Provider is set to to include the group of workloads that need firewall rules to allow traffic to the service VIP, regardless of whether any of these workloads own the VIP.

When Effective Provider is set, the firewall rules for allowing traffic to 6.6.6.6 are programmed on the workloads, even if they do not own the VIP. This ensures that during a failover event, traffic will not be disrupted as the new primary workload will have the necessary firewall rules..

Figure 52. Firewall rules on the host allowing traffic to service VIP
Firewall rules on the host allowing traffic to service VIP

How to Configure Effective Consumer or Effective Provider

  1. Click the policy to edit.

  2. Click Edit to access advanced policy options.

  3. Click Effective Consumer or Effective Provider.

  4. Specify the desired addresses for both effective consumer and effective provider.

About deleting policies

A policy serves as a management directive that

  • governs network behavior,

  • sets guidelines for network access, and

  • ensures compliance with security protocols.

These are the important considerations before deletion:

  • Before you delete a policy, check to ensure it is not a pair of policies required when the consumer and provider are in different scopes.

  • To determine this, click the link for the policy in the Protocols and Ports column.

  • Check for a plus sign next to the port and protocol. This indicates policies created by accepting a cross-scope policy request.
    Plus sign next to the port and protocol indicating the policies created by accepting a cross-scope policy request
  • Click the plus sign for details about the creator of the cross-scope policy and the corresponding consumer policy.


Note


Policies suggested by automatic policy discovery that is not approved may disappear after a subsequent policy discovery, if the traffic flows that produced them are not detected. To preserve suggested policies, refer to Approve policies.


Review and analyze policies

To ensure your policies have the intended impact and avoid unintended consequences, consider these checks and processes:

Review automatically discovered policies

An automatically discovered policy is a feature in network management software that:

  • Identifies existing network traffic.

  • Generates suggested policies.

  • Offers management tools to review and refine these policies.

Review Process

When you review automatically discovered policies, particular focus needs to be directed on areas like:

  • Critical, common ports,

  • Internet-facing traffic,

  • Traffic between different applications (which may involve workloads in different scopes)

  • Traffic within the same application (which are likely to involve workloads in the same scope)

Review policy discovery results on the Policies page of the workspace in which you discovered policies.

Helpful tools for reviewing policies

  • Filter and sort the policies to review related policies as a group.

    • Click table headings to sort the columns, for example by consumer, provider, or port/protocol.

    • Use the filter at the top of the policies list to view specific subsets.

      To see a list of properties that you can filter on, click the (i) button in the Filter Policies area.

  • Look at the graphical representation of the generated policies:

    Click the Policy Visual View button (Policy Visual View button).

    For more information, refer to Policy visual representation.

  • Click Ungrouped to search or filter the rows based on ports.

  • By default, the policies are grouped by consumer/provider/action. To return to this view, click Grouped.

  • Select the External? filter option to find policies in which the provider is in a different scope from the scope in which you discovered policies.

    Create policies for this traffic using one of the methods described in When consumer and provider are in different scopes: policy options.

  • Look at the confidence level of the generated policies. For more information, refer to Address low-confidence policies.

  • Look at the Workload Profile for detailed information about a workload. Click the IP address, then click View Workload Profile in the pane on the right.

  • To view the traffic flows that were used to produce a particular policy, click the value in the Protocols and Ports column for that policy, then click View Conversations in the side panel that opens.

    For more information, refer to Conversations.

    Click Flow Search to view the flows for a conversation.

Other things to do and check

Examples of additional tasks and checks include:

  • Identifying unknown IP addresses (such as failover or other floating IPs) and tagging them accordingly.

    Find helpful details on the Inventory Profile page. Click the IP address, then click View Inventory Profile in the pane on the right.

  • Group workloads using inventory filters. For more information, refer to Create an inventory filter.

  • Investigating unusual and unnecessary policies.

  • For information on manual and approved policies as well as automatically discovered policies, refer to Address policy complexities.

  • Keep the number of policies in a scope to 500 or fewer. If you have many more than this, see if you can consolidate similar policies or consider splitting the scope.

  • Approve policies you know are correct to preserve them in future discovery runs as you review.

Address low-confidence policies

A low-confidence policy is a policy identified during automatic policy discovery that

  • has a low accuracy level,

  • may specify inappropriate service ports and protocols, and

  • can be either deleted or edited based on evaluation.

Steps to identify low-confidence discovered policies
  1. Navigate to the applicable scope and workspace and click Manage Policies.

  2. Click the Policies tab.

  3. Click Ungrouped Policy List View .

  4. Click the Confidence column heading to sort the list of policies by confidence level.

  5. Click the values in the Protocols and Ports column to open a panel on the right side of the window.

  6. In the Protocols and Ports section, the color of each C indicates the confidence for each service (port and protocol) specified in the policy.

    Hover over the C to interpret the confidence level.

  7. Identify low-confidence indicators for any services in the list.

  8. Delete or edit unwanted policies, or add additional policies.

Steps to view the confidence levels for a particular policy
  1. In the Policies tab, click the value in the Protocols and Ports column for that policy.

    The Policy Side View panel opens on the right.

  2. In the Protocols and Ports section, the color of each C indicates the confidence for each service (port and protocol) specified in the policy.

    Hover over the C to interpret the confidence level.

Flow Direction and Policy Confidence

Accurately identifying flow direction enhances policy accuracy, while incorrect identification may lower confidence ratings. For information about determining flow direction when creating policies, refer to Client Server Classification.

Troubleshoot automatic policy discovery results

If automatic policy discovery results are not as expected, consider these troubleshooting checks:

Extend the selected time range to include more data

You should extend the time window to capture infrequent events. Ensure reports reflect comprehensive data, especially for specific intervals, like a quarterly report.

Avoid data gathered before certain changes

Adjust your time range to exclude outdated data if the scope definition has changed.

Exclude misleading traffic flows

Modify exclusion filters as needed by checking configurations in multiple settings:

  • Workspace-specific exclusion filters.

  • Default exclusion filters in the Default Policy Discovery Config page.

  • Exclusion filter settings in the Advanced Configurations section.

  • Enable the Default Exclusion Filters by saving changes on the Default Policy Discovery Config page.

  • Make sure you have clicked Save on the Default Policy Discovery Config page to make those configurations available to individual workspaces.

For more information, refer to Policy discovery flow filters.

Troubleshoot Policies in which Consumer and Provider Are in Different Scopes

For information on handling cross-scope policies, refer to Troubleshoot cross-scope policies.

Check Status of Approved Policies

For more information on approved policy troubleshooting, refer to Troubleshoot approved policies.

Policy visual representation

A policy visual representation is a graphical tool that:

  • provides a visual overview of network policies,

  • allows for interaction such as viewing details or exporting images, and

  • facilitates policy creation and management.

To navigate to the policy visual representation page:, from the Policies page, click the graph icon, Policy Visual View button, to the right of the list icon.

Policy View Elements

The visual elements on the policy view are:

This Element

Represents This

A blue, orange, or purple icon

A node (the consumer or provider of a policy)

Blue icon

A scope

Orange icon

An inventory filter

Purple icon

A cluster

Line connecting two icons

One or more policies.

Policy View Options

To

Do This

View the list of workloads included in a consumer or provider node

Double-click the node's icon.

View policy specifics such as services (ports), action (Allow/Deny) and protocol between a consumer and provider

Double-click the line connecting them. Details appear in the pane on the right.

View the policies entering and leaving a node

Click the icon.

View only the policies between workloads within the scope

Click Internal.

View only the policies in which the provider is in a different scope from the consumer

Click External.

Use advanced filtering options

Click the (i) button to the left of the filter text input box to see the options, then enter filter criteria.

Figure 53. Filtering policies in graphical view
Filtering policies in graphical view

To download a high resolution image of the graphical view of the policies:

  1. Click the ellipsis icon, and click Export Image.

  2. Choose the resolution and image type.

  3. Click Download.

Add a Policy (Policy View Page)

  1. Hover over the consumer for a plus sign, then hold and drag the policy to a provider.

  2. Toggle the Absolute checkbox in the modal for the Absolute policies. Otherwise, the policy is created as a Default policy.

  3. Click a line and select a policy from the pop-up list in the sidebar to manage policies.
Figure 54. Policy creation in graphical view
Policy creation in graphical view

Quick analysis

A quick analysis is a testing mechanism that:

  • allows testing a hypothetical flow against all relevant policies,

  • enables debugging and experimentation without running live policy analysis, and

  • limits usage to primary workspaces while not supporting Kubernetes service flows.


Restriction


  • Quick Analysis can only be run on primary workspaces.

  • Quick Analysis is not currently supported on flows from Kubernetes services.


Click the Run Quick Analysis tab in the navigation pane to view the dialog box.

Figure 55. Quick Analysis Tab
Quick Analysis Tab

Enter the Consumer or client IP, provider or server IP, port, and protocol for the hypothetical flow. Click Find Matching Policies.

A policy decision indicates whether a hypothetical flow would be allowed or denied given the policy definitions in the latest version of the workspace and all other policies from relevant workspaces that are already pushed for live policy analysis.

Matching outbound and inbound policies are shown in sequence, emphasizing the role of top rules in establishing connections.

The first row of rules affects the connection. For an established connection, both top inbound and outbound rules must be ALLOW.

Viewing all policies helps identify issues in policy coverage. You can modify, add, or remove policies immediately and repeat the analysis without running live policy analysis.

Figure 56. Quick Policy Analysis
The Quick Policy Analysis figure illustrates the matching outbound and inbound policies in a dialog, highlighting the importance of the top rules for establishing a successful connection. It serves as a debugging tool by displaying all matching policies in their globally sorted order.

Live policy analysis

After reviewing and approving the network security policies generated by automatic policy discovery, and before you enforcing policies, use live policy analysis to observe how these policies affect actual network traffic.

Questions addressed by Live Policy Analysis:

  • What is the impact on this scope's applications if these workspace policies are enforced now?

  • Could a known security attack or risk have been prevented with these policies?

    For more information, refer to Policy Experiments.

  • Are the current policies functioning correctly in the network?

You should run policy analysis on any workspace that has policies. Because workloads in any particular scope can be affected by policies in other scopes, you should analyze all relevant scopes before enforcing policy changes. Consider analyzing policies for all scopes that may affect traffic in a particular scope.

For example:

  • Policies defined in higher scopes within the hierarchy may apply to workloads in this scope.

  • If workloads in this scope communicate with workloads in a different scope, policies in that scope may affect these communications. When policy analysis is started in that scope (or latest policies are analyzed after a policy change there), this can affect this scope's policy analysis results.

Perform policy analysis when you revise policies to ensure that applications continue to operate correctly.

Running live policy analysis on a workspace is sometimes referred to as "publishing".

Start live policy analysis

Review and confirm that the workspace policies meet your requirements using automatic policy discovery. Then, start policy analysis to comprehensively assess the effects.

Before you begin

Note


  • Analyze policies in other workspaces to ensure accurate results.

  • Simulate policies in related workspaces to avoid inconsistencies.


Procedure

Step 1

Click the More buttonnext to the workspace name "Secondary" in the header and toggle the workspace to Primary.

Step 2

Navigate to the Policy Analysis tab.

Step 3

Click Start Policy Analysis.

Figure 57. Enable Policy Analysis
Enable Policy Analysis

What to do next
  • Analyze policies from other scopes that might influence this workspace. For more information, refer to Example: Impact of policies analyzed in other scopes.

  • To receive alerts for any escaped flows, configure notifications in Manage Alerts.

  • Use available filters to refine data analysis. Click the information icon in the filter box to proceed.

  • Restart the analysis after you alter policies to incorporate these changes. For more information, refer to After changing policies, analyze latest policies.

Stop live policy analysis

A live policy analysis is a policy-setting tool that:

  • allows continuous monitoring of policy impacts,

  • enables real-time adjustments for better accuracy, and

  • influences outcomes across multiple workspaces.

Let policy analysis continue running even after enforcing policies. This ensures that policies in this workspace do not adversely affect analysis results in other workspaces you analyze.

To stop live policy analysis:

Click Live Policy Analysis: P<number>, then select Disable policy:

Figure 58. Disable Live Policy Analysis
Disable Live Policy Analysis

Policy analysis results: understand the basics

A policy analysis result is a network analysis component that

  • evaluates the flows based on the scope associated with the workspace,

  • assigns result types to the evaluated flows, and

  • categorizes flows for further analysis.

During policy analysis, all flows traveling into, out of, and within the scope associated with the workspace are assigned one of these results:

  • Permitted: Flow was allowed by the network as well as the analyzed policies.

  • Escaped: Flow is allowed by the network, but should be dropped according to the analyzed policies.

  • Rejected: Flow was dropped by the network, and also by the analyzed policies.

Figure 59. Policy Analysis Page
Overview of Policy Analysis

Components of the Policy Analysis Page

  • Filter Flows—Use the faceted filter bar to update all the charts.

  • Chart Interaction—Hover over the chart to view aggregate flow percentages; click a timestamp to view all filtered flows.

  • Result Types—Manage interactions by selecting or deselecting result types in the time series charts.

    The Top N chart displays contributors such as hostnames, addresses, and ports.

    You can limit the time series chart to escaped flows and select “Ports” to identify major contributors.

Example: Impact of policies analyzed in other scopes

A policy impact is a network analysis mechanism that

  • identifies the immediate effects of policy changes

  • assesses traffic conditions due to scope association

  • highlights traffic flow adjustments based on new analyses.

In some scenarios, activities in one scope impact traffic in another. During a workspace analysis unrelated to the current scope, changes did not originate from new policy analysis because it did not trigger a label flag. However, this resulted in unexpected traffic handling, which was marked as escapes.

Effect of policy change in another scope
Analysis without Policies

A workspace flow analysis is a monitoring mechanism that

  • monitors flows into, within, and outside the workspace,

  • identifies effects on these flows due to policies in other linked workspaces, and

  • categorizes flows according to enabled live policy analysis.

Flows are marked as similar to those with live policy analysis enabled if live policy analysis is not enabled. If no workspaces are running live policy analysis, the time-series chart will be empty.

Policy analysis details

A policy analysis is a method that

  • determines the disposition of network flows,

  • analyzes flow types and agent reports, and

  • categorizes flows into permitted, escaped, or rejected based on policy.

Flow Disposition

In policy live analysis, determining whether a flow is Permitted, Escaped, or Rejected, requires first evaluating its Disposition of the flow from the network perspective:

  • Each flow will receive an ALLOWED, DROPPED or PENDING disposition, based on the signals and observations given by Secure Workload agents.

  • Scenarios vary based on the agent configurations along the path of the flow and the flow types.

  • If any agent reports a flow as DROPPED, assign the flow a DROPPED disposition, regardless of the flow type.

When no agent reports a DROP along the flow path, examine bidirectional and unidirectional flows separately. When bidirectional flows are observed, we look at flows in pairs (forward and reverse) based on their source, destination ports and protocol, and timings. The same cannot be done for unidirectional flows.

For bidirectional flows, if there are agents installed and data plane enabled on both ends, a forward flow receives an ALLOWED disposition when both the source and the destination agents report that the flow is observed. Otherwise, the forward flow will get a PENDING disposition. If an agent is on either the source or the destination workload but not both, the forward flow will receive an ALLOWED disposition only is observed within 60 seconds. Otherwise a PENDING status will be assigned to the forward flow. The reverse part of the bidirectional flow follows the same logic, with the source and the destination reversed. For example, if only one side has an agent, whether a reverse flow disposition is PENDING or ALLOWED depends on the observation and timing of its subsequent forward flow based on the same logic.

Note that we assume firewalls implement silent drop. If a reject message is sent on the same flow (for example, rejecting a TCP SYN with RST + ACK), a reverse flow will be detected, and the previous forward flow will be marked as ALLOWED. However if the reject message is sent on a different flow (for example, rejecting a TCP SYN with an ICMP message), the forward flow will remain as PENDING.

A unidirectional flow is considered DROPPED if any agent reports it as DROPPED, similar to bidirectional flows. However, since there is no matching reverse flow, the flow will have PENDING disposition status if both agents observe the flow.

Violation Types

Policies are analyzed to determine final violation types by checking that flow dispositions align them.

A flow’s violation type will be

  • Permitted, if its disposition is ALLOWED or PENDING, and its deciding policy action is ALLOW,

  • Escaped, if its disposition is ALLOWED, and its deciding policy action is DENY,

  • Rejected, if its disposition is DROPPED or PENDING, and its deciding policy action is DENY,

A flow receives a DROPPED status only when an agent explicitly reports it. When there is no explicit report of dropping for agents, the flow receives PENDING status.

If the disposition is PENDING:

  • and policy action is DENY, set the violation type to Rejected.

  • and policy action is ALLOW, set the violation type to Permitted.

For a bidirectional flow, if the policy violation types of forward and reverse part of the flow agree, only a single type is shown in the policy analysis or enforcement analysis page. Otherwise, forward and reverse are shown separately, such as PERMITTED:REJECTED.

Example scenarios:

  • Packets are dropped at the source-side enforcement.

    • In this case, the source side Secure Workload egress agent will report that the flow is DROPPED.

  • Packets leave the source.

    • If only the source side has an agent, the flow reports as ALLOWED by the egress agent if the agent observes a reverse packet within 60 seconds.

    • If there is a visibility-only agent on both the source and the destination side, the flow receives a DROPPED disposition status only if the ingress agent reports it as DROPPED; otherwise, it is reported as ALLOWED.

    • Flow packets are received at the destination, but no reverse traffic.

      If there is no destination side agent, the flow will receive a PENDING status. Otherwise, it will be assigned ALLOWED status.

Suggested steps for investigating flows

When exploring network flows and policy outcomes, apply the following recommended steps and filters:

  1. Focus on ESCAPED FLOWS initially because they need special attention. Their actual flow dispositions differ from intended actions based on analysis. Ensure these flows are not blocking necessary traffic and are not damaging your applications.

    Click the violation type, such as Escaped.

    (Later, you can look at rejected and permitted flows as needed.)

    Escaped flows can occur for several reasons, including but not limited to:

    • Another policy higher in the priority order is taking effect

    • The traffic is using a different path than the one addressed by your policies.

    • The policy that you expect the traffic to hit is in a workspace that is not being analyzed (if you are looking at escaped flows on the Policy Analysis page) or enforced (if you are looking at escaped flows on the Enforcement page), for example in an ancestor scope or even in a secondary workspace in the same scope.

  2. Select flows matched to catch-all policies to determine their legitimacy. If they are legitimate but lack explicit allow policies, add appropriate explicit policies. If suspicious, investigate further. Use filters based on inbound_policy_rank or out- bound_policy_rank whether you are looking at the inbound, outbound or both sides, as shown in the diagram.

    Figure 60. Policy Analysis Filtering Options for Rank
    The diagram illustrates the policy analysis filtering options for rank, highlighting how to apply filters based on inbound and outbound policy ranks to focus on specific flows.
  3. Filter out TCP flows with RST flag Fwd flags do not contain RST, Rev flags do not contain RST.

    The RST flags of some escaped TCP flows are set by their consumers or providers. These flows are reset by either their consumers or providers. They are unestablished connections without data exchange, but may be reported as ALLOWED because the agents see their handshaking packets. Since they do not have established connections to begin with, they will not be affected when currently analyzed policies are enforced. Filtering out TCP flows that have the RST flag on either side allows you to focus on more meaningful and important escaped flows whose established connection will be blocked by the currently analyzed policies.

  4. If the majority of traffic uses IPv4, apply filters to focus solely on IPv4 flows:

    Filter using address type = IPv4, address type != IPv6. It is also helpful to filter out link-local address.

  5. Prioritize diagnostic efforts by identifying the most frequent hostnames, ports, addresses, scopes, and so on, involved in escaped traffic utilizing the TopN feature pane. Combine filters for analysis.

  6. Search flow data for the hostnames, ports, protocols, and so on, identified in the previous step.

    Once you have identified the top candidates based on the targeted flows' hostnames, port and and so on, drill down into the flows by applying drill-down filters directly from values given in the top N query window. Alternatively, manually enter relevant filters into the flow search filters bar. For example, Consumer Hostname contains {something}, Provider Hostname contains {something}, Provider Port = {some port number}, Protocol = TCP Protocol != ICMP

  7. Check individual flows and quick analysis:

    Finally, you can focus on a specific flow to examine its policy result by clicking the table row corresponding to the flow. Make sure to pay attention to the policies matched to the flow and the scopes of both the consumer and the provider addresses. If the policy action does not match your intended action, create appropriate policies in workspaces associated with the consumer’s and/or the provider’s scopes to change the policy action.

    Figure 2 shows an example workflow of narrowing down escaped flows using some of the described filtering. The search input also supports “,” and “-” for Port, Consumer Address and Provider Address, by translating “-” into range queries.

    Figure 61. Example of Policy Analysis for Diagnosing Escaped Flows
    Example of Policy Analysis for Diagnosing Escaped Flows

Run policy experiments to test current policies against past traffic (Task)

Use this feature when you need to understand how current or the versioned policy sets would handle specific traffic patterns, particularly from historical incidents.

Use the Run Experiments feature to evaluate how existing network policies would respond to past traffic scenarios, including known attacks.

Before you begin

Tip


As an alternative to this procedure, you can run automatic policy discovery again, including the relevant time range, and see what different policies are suggested.


Procedure

Step 1

Navigate to the Policy Analysis page of your selected workspace.

Step 2

Select the policy version you want to evaluate.

Step 3

Click Run Experiment.

Step 4

Enter a name and duration for the policy experiment.

This will start a policy analysis job that reanalyzes all flows within the selected duration against the selected versioned policy. This job may take a few minutes, depending on the selected duration.

Step 5

Monitor the progress in the policy selector menu and review the results when they are ready.

You should be able to select the policy experiment like any other versioned policy and the time series charts showing different flow categories will be updated accordingly.

Figure 62. View Experiment Status
Experiment

Note


If you cannot see any flows when selecting a policy experiment, it might be due to time range mismatch, for example, the current time range of the charts is the past one hour, but the experiment duration is six hours in the past. To reset the time range to the duration of the experiment, click the clock icon next to the policy selector.

Figure 63. Match Time Range
Match time range

After changing policies, analyze latest policies

A policy analysis is a review mechanism that

  • ensures the latest updates are reflected,

  • provides insights into the effectiveness of current policies, and

  • determines the impact of newly implemented changes.

Click Analyze Latest Policies to review the current set of policies after making changes and verify policy analysis reflects the changes made. Policy analysis does not automatically reflect policy changes in the workspace.

The Analyze Latest Policies button will not be available if the policies in the workspace have not changed since policy analysis was last initiated, or if policy analysis is not currently enabled. If the button is clickable, it indicates there are policy changes that have not yet been analyzed.

For more detailed instructions, refer to View, compare, and manage analyzed policy versions.

Policy label flags

A policy analysis label flag is a marker on the policy analysis timeseries chart that

  • indicates the point in time when policy analysis is initiated,

  • updates to reflect policy and cluster changes, and

  • provides access to specific versions of policies when clicked.

Policy label flags help in tracking and reviewing policy changes and updates efficiently by marking analysis initiation points on the timeseries chart, reflecting policy versions, and supporting investigation.

When you click a flag, you can view associated policy versions, which open corresponding Policies pages for detailed inspection.

Figure 64. Policy label flag in timeseries chart
Policy label flags

View, compare, and manage analyzed policy versions

Versions are created to track changes whenever policies are analyzed during a workspace update. Each analysis or re-analysis results in a new version.

For details about versioning, refer to About policy versions (v* and p*) (reference).

Before you begin
Ensure all necessary policy changes in the workspace are applied.
Procedure

Step 1

Choose Defend > Segmentation.

Step 2

Navigate to the relevant scope and primary workspace.

Step 3

Click Manage Policies to access your policy versions.

Step 4

The currently displayed version of the policies is shown at the top of the page:

Currently displayed version of policies

The displayed version may include policy discovery versions, analyzed policy versions, or enforced versions.

Step 5

You can:

To display a different version of the policies:

Click the current version, then select a different version.

For descriptions of the versions, see About policy versions (v* and p*) (reference).

Important! If you select a v* version, refer to View, compare, and manage discovered policy versions instead of this topic, including the important caveat at the end of the topic.

To view details of the analyzed versions:

  1. Click View Version History at the top of the page beside the current version.

  2. Select the Published Versions tab to see the versions of analyzed and enforced policies.

  3. To view log entries for a version, click the version link.

    Pale green rows represent analysis activity.

    Bright green rows represent enforcement activity.

To compare two versions to see what has changed:

  1. Click Compare Revisions.

  2. Choose the versions to compare.

    You can compare the latest draft version, analyzed and enforced versions.

  3. For result details, refer to Comparison of policy versions: policy diff.

To delete an unwanted version:

Click More button for the version and select Delete.

Published policy versions (p* versions) can be deleted as long as the version is not being actively analyzed or enforced.

To export a version:

Click More button for the version and select Export....
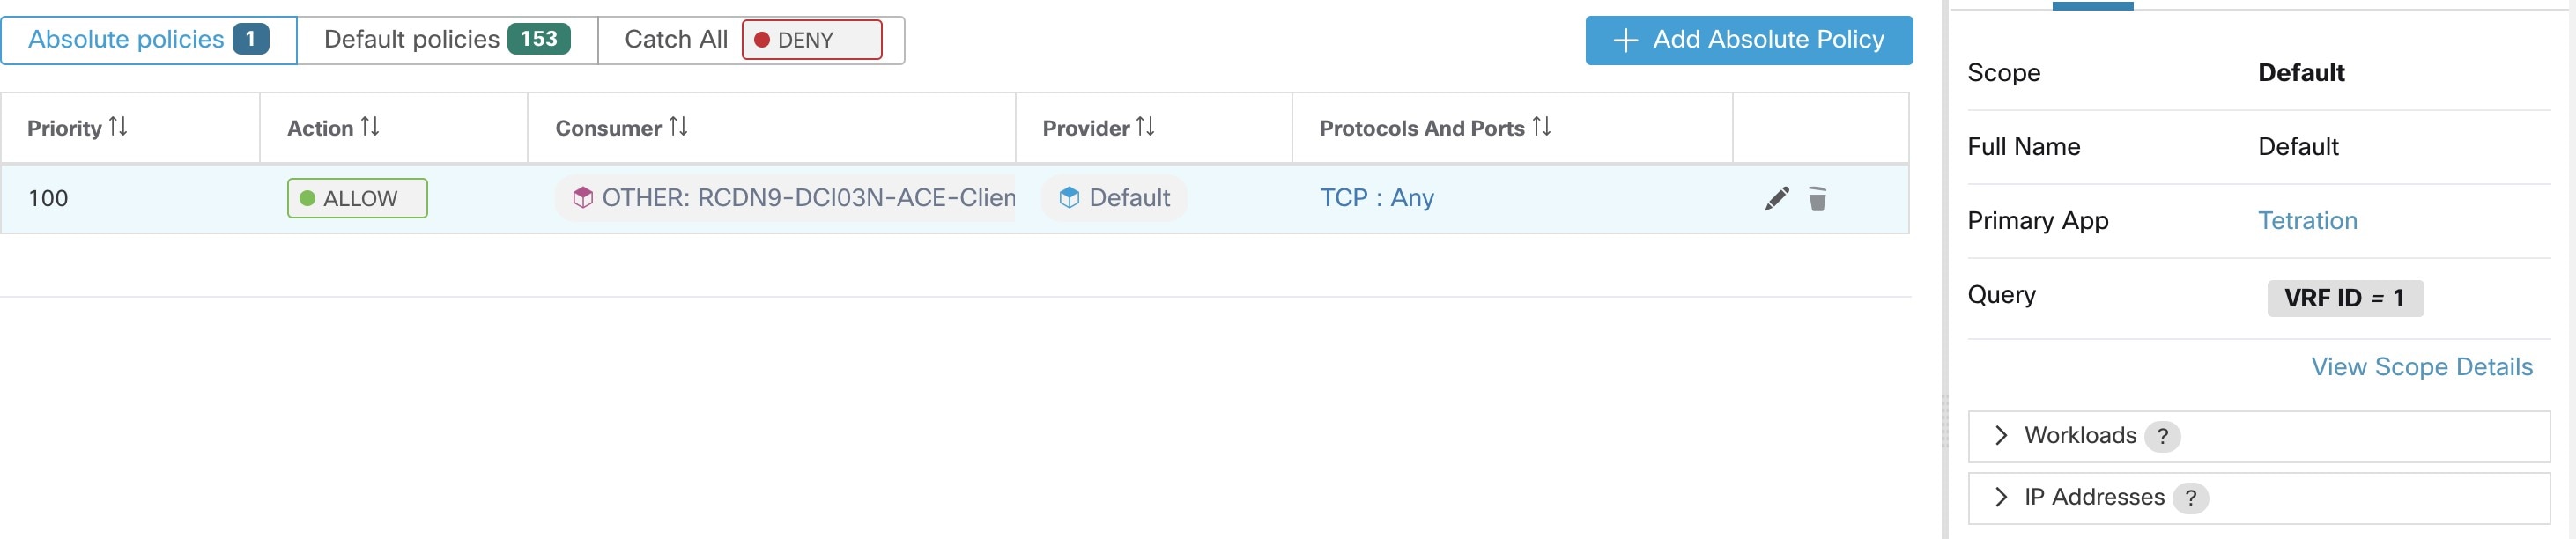
For more information, refer to Export a workspace.


What to do next

Set the version to the most recently discovered policy version to ensure policies can be created manually without accidental deletion.

Activity logs of policy analysis

A log entry is a record that

  • provides details on actions performed within the policy analysis page,

  • includes timestamps and user information, and

  • grants access to all workspace users.

  • Enable policy analysis

    Figure 65. Enable policy analysis
    Enable policy analysis
  • Disable policy analysis

    Figure 66. Disable policy analysis
    Disable policy analysis
  • Update policy analysis

    Figure 67. Update policy analysis
    Update policy analysis

For more information on the workspace history, refer to History & Diff.

Enforce policies

Secure Workload can enforce policies using:

A policy enforcement mechanism is a system feature that can

  • enforce policies on workloads and cloud connectors,

  • integrate load balancers through external orchestrators, and

  • stream to third-party orchestrators for policy enforcement in third-party infrastructure.

  • Workloads: Install software agents on Linux, Windows, and Kubernetes/OpenShift environments for efficient policy enforcement.

    For more information on deploying agents on individual workloads, refer to Deploy Software Agents on Workloads.

    For technical details about how agents work on each platform, see Enforce Policies with Agents and Enforcement on containers.

  • Cloud connectors: Connec through AWS and Azure platforms using specialized connectors.

  • Load Balancers Integration: Utilize external orchestrators to link with systems like F5 and Netscaler for policy enforcement.

  • Firewall Logic: When enforcing policies, the system automatically inserts new firewall rules and deletes existing ones on affected hosts. For more information, refer to Cisco Secure Firewall Management Center Connector.

  • Streaming to third-party orchestrators for enforcement in third-party infrastructure.


Caution


Enforcing policies inserts new firewall rules on affected hosts and deletes any existing rules on relevant hosts.


Check agent health and readiness to enforce

To ensure effective policy enforcement, verify the installation and health of agents with these checks:

Verify

More Information

Agents are installed on all workloads in the scope that are associated with the enforced workspace

Choose Defend > Segmentation and navigate to the relevant scope and workspace. Click Matching Inventories, then click IP Addresses.

IP addresses on this tab typically lack installed agents, which are generally required to enforce policy.

Exceptions: Enforcement occurs for these types of inventory that appears on the IP Addresses tab:

  • Cloud-based inventory where the policy is enforced using a cloud connector. Installing agents on individual workloads is optional.

  • Kubernetes addresses appear in the IP Addresses list if agents are installed on individual workload pods; Kubernetes inventory with installed agents appears on the Pods tab.

The installed agent version is current and supported

For an overview of installed agent versions, choose Manage > Agents, then click Distribution and look at the Agent Software Version Distribution chart.

For details, choose Manage > Agents, then click Agents List.

Installed agents have enforcement capability

Choose Manage > Agents, then click Convert to Enforcement Agent.

In the Filter box, enter Agent Type = Deep Visibility

Convert any agent that must enforce policy to enforcement agent.

Enforcement is enabled for all agents

(This requirement is distinct from ensuring that agents have enforcement capability and from enabling enforcement in the workspace.)

Note


You may need to enable enforcement capabilities specific to your deployment, separate from workspace enforcement.

Enforcement is enabled for nonagent enforcement mechanisms

Enable enforcement on cloud connectors without agents only after workspace policy enforcement.

Note


External orchestrators that support enforcement must also be enabled before they can enforce.

The Preserve Rules setting in the Agent Config Profile is appropriate for the workload platform

  • For Kubernetes/OpenShift and other platforms, verify the Preserve Rules setting in the Agent Config Profile.

(After the workspace is enforced) All agents have received the applicable policies for the workload

Ensure agents receive workload policies after workspace enforcement.

Agents are healthy

These locations also contain information about agent health:

  • Choose Manage > Agents, then click Monitor.

    Look at the information under Enforcement Agents. For details, see the Agent Monitoring section.

  • Choose Manage > Agents, then click Distribution.

    Choose the agent type from the top of the page.

    For information about this page, see the Agent Status and Statistics.

  • Choose Manage > Agents, filter to find a specific workload of interest, and select the IP address.
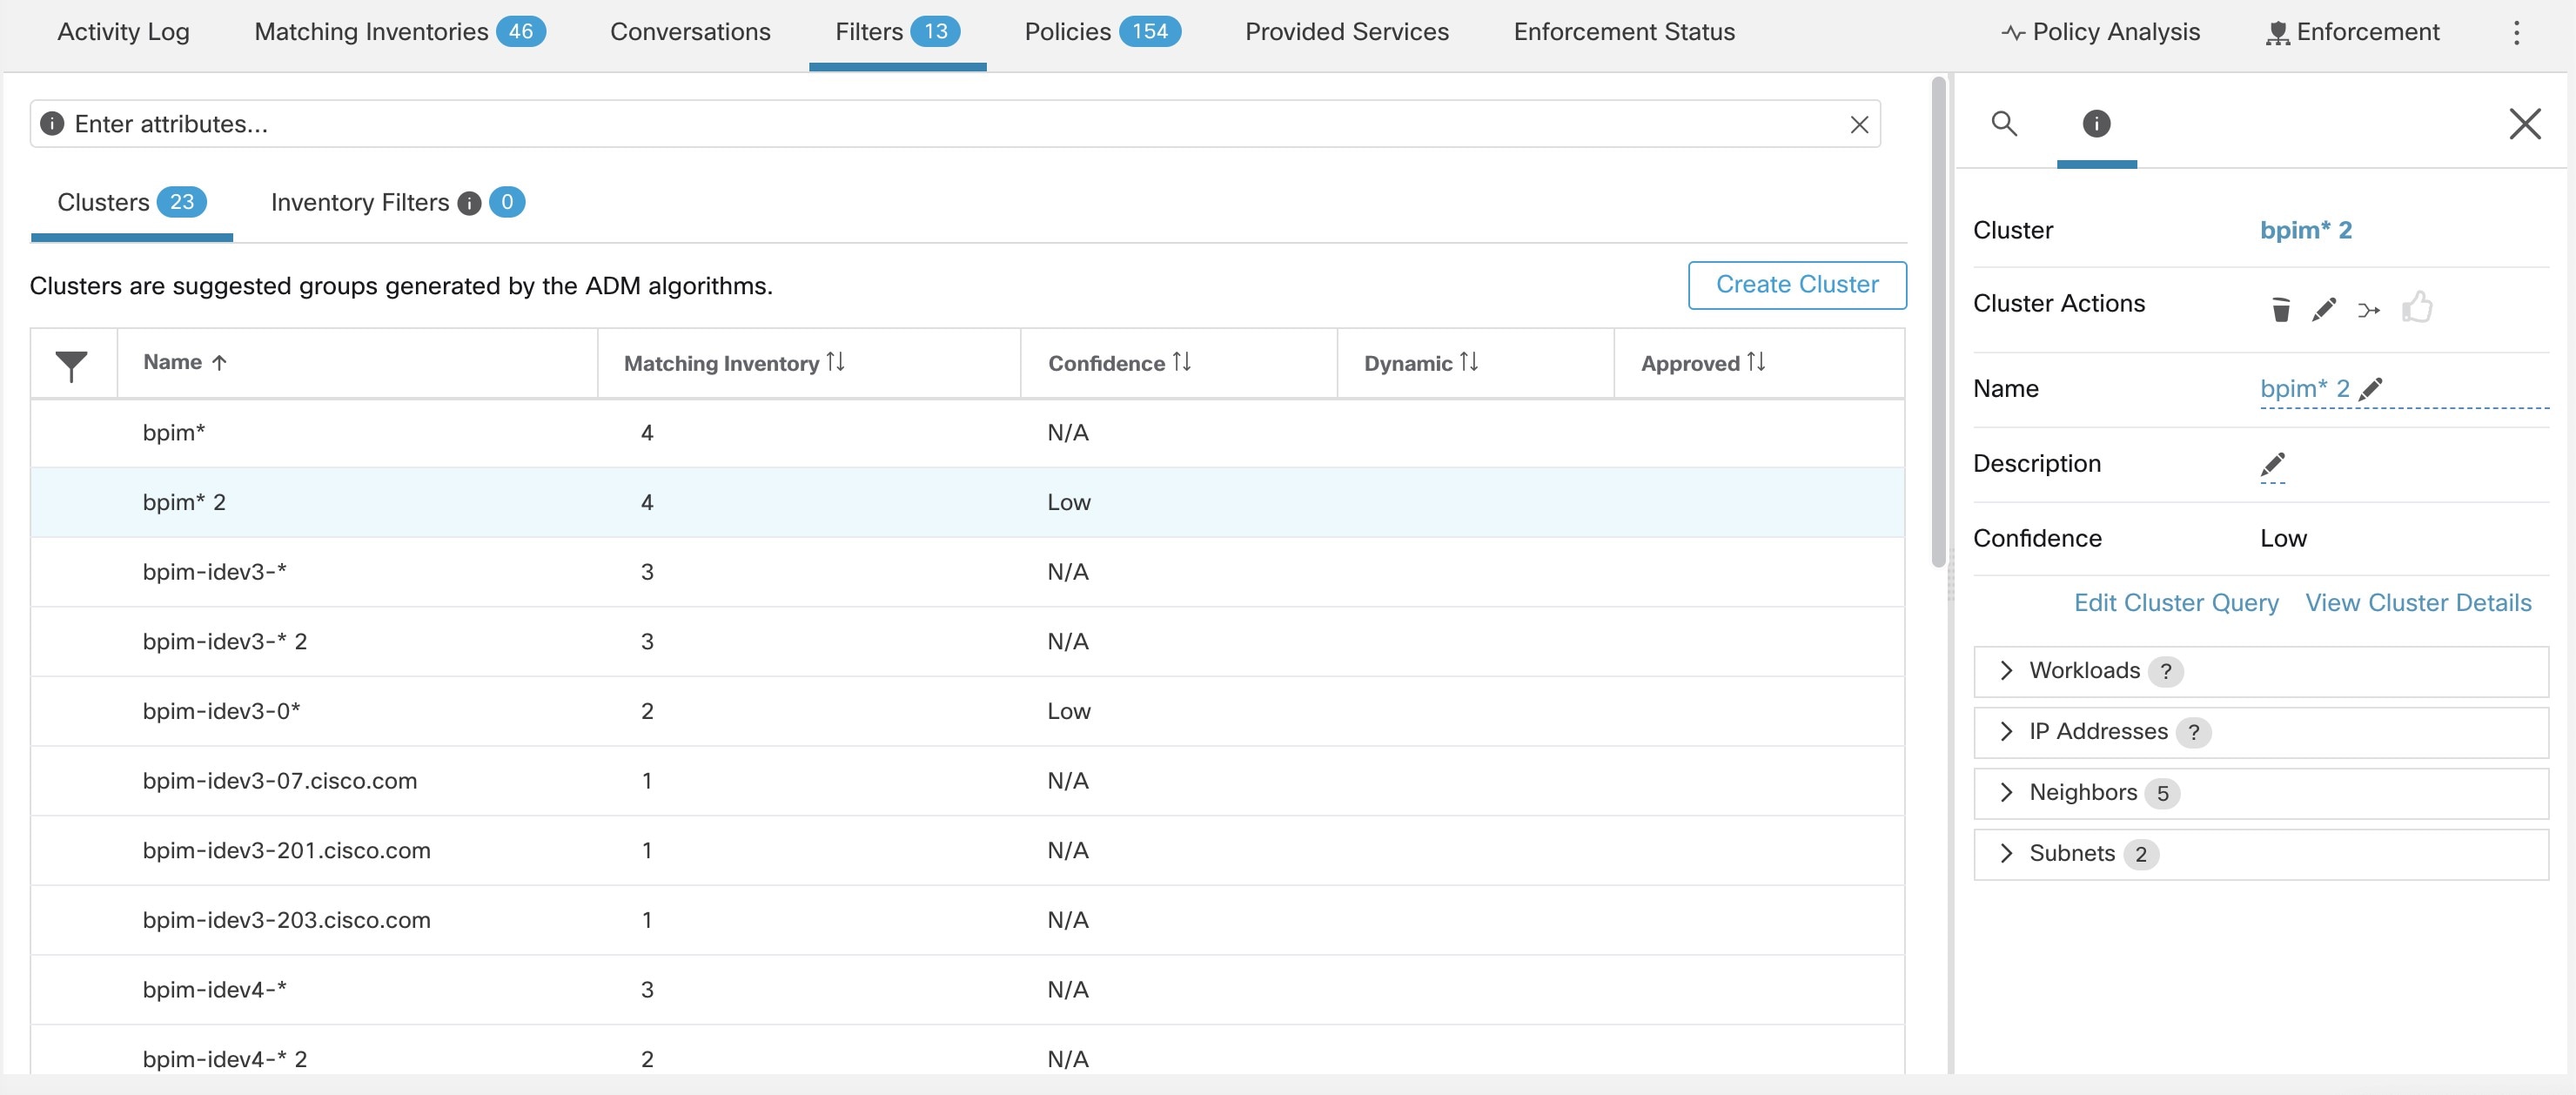
    The Workload Profile page opens in a separate browser window including an Agent Health panel.

    For details, see Workload Profile section.

Enable policy enforcement


Caution


Enforcing policies deletes existing firewall rules and writes new firewall rules on every workload in the affected scope.

If you have not properly verified that your policies are working correctly, enforcing policies can change the way that your applications work and disrupt business operations.


Before you begin

  • Initally, set the catch-all to Allow traffic when enforcing policies. Monitor the traffic to check if it matches the catch-all rule. Change the catch-all to Deny if no necessary traffic matches the catch-all rule.

  • If you enforce workspaces in multiple scopes at once, you can enforce only analyzed workspaces. If you enforce a single workspace using the second method that is described in the procedure below, analyzing the policies in the workspace before you enforce them is recommended but not required.

    For more information, refer to Live Policy Analysis and subtopics.

  • The wizard for single-scope enforcement is more detailed than for multiple scopes. If you require the features in the Policy Enforcement Wizard, use the second method described in the procedure below.

  • IMPORTANT! Verify that the policies are correct.

    Policy results in any workspace may be affected by enforced policies in other scopes. Before policy enforcement is enabled on a workspace, the Policy Enforcement page shows how flows are affected by enforced policies in the workspaces associated with other scopes. For example, a broad “production hosts should not talk with non-production hosts” policy in the enforced workspace of a parent scope may impact traffic on workloads belonging to an application in a child scope.

    If no new information is being shown in the Enforcement charts, make sure that the correct time range is selected.

    For information about the information you see on the Enforcement page, see Live Analysis Live Policy Analysis and subtopics. (The same information for Live Analysis also applies to the Policy Enforcement page.)

    If live analysis results differ from the Enforcement page results, ensure the analyzed scopes, policy versions, and time range match those used to generate the Enforcement page results to keep your data aligned.

  • Understand how agents enforce policies on each platform. See:

  • You must have the required permissions to enforce policies. Ensure you have the ability to enforce or higher access for the scopes. Users with alternative abilities can view the page but cannot enforce or disable new policies.

  • Verify that all relevant installed agents and other enforcement endpoints such as cloud connectors are ready to enforce policy. For a list of agent health and readiness checks, see Check Agent Health and Readiness to Enforce.


Note


Some of these checks must wait until after enforcement; for example, you should enable enforcement on cloud connectors only after you have enabled enforcement in the workspace. For installed agents, you will typically enable enforcement in the agent configuration before you enforce the workspace.


Procedure


Step 1

From the navigation pane, choose Defend > Segmentation.

Step 2

You can enforce policies for one scope or for multiple scopes at the same time:

To enforce policy for multiple scopes at the same time:

(Only workspaces that have been analyzed can be enforced using this process.)

  1. Open the Tools pane and click Enable Enforcement.

  2. Follow the wizard to select and configure workspaces and versions.
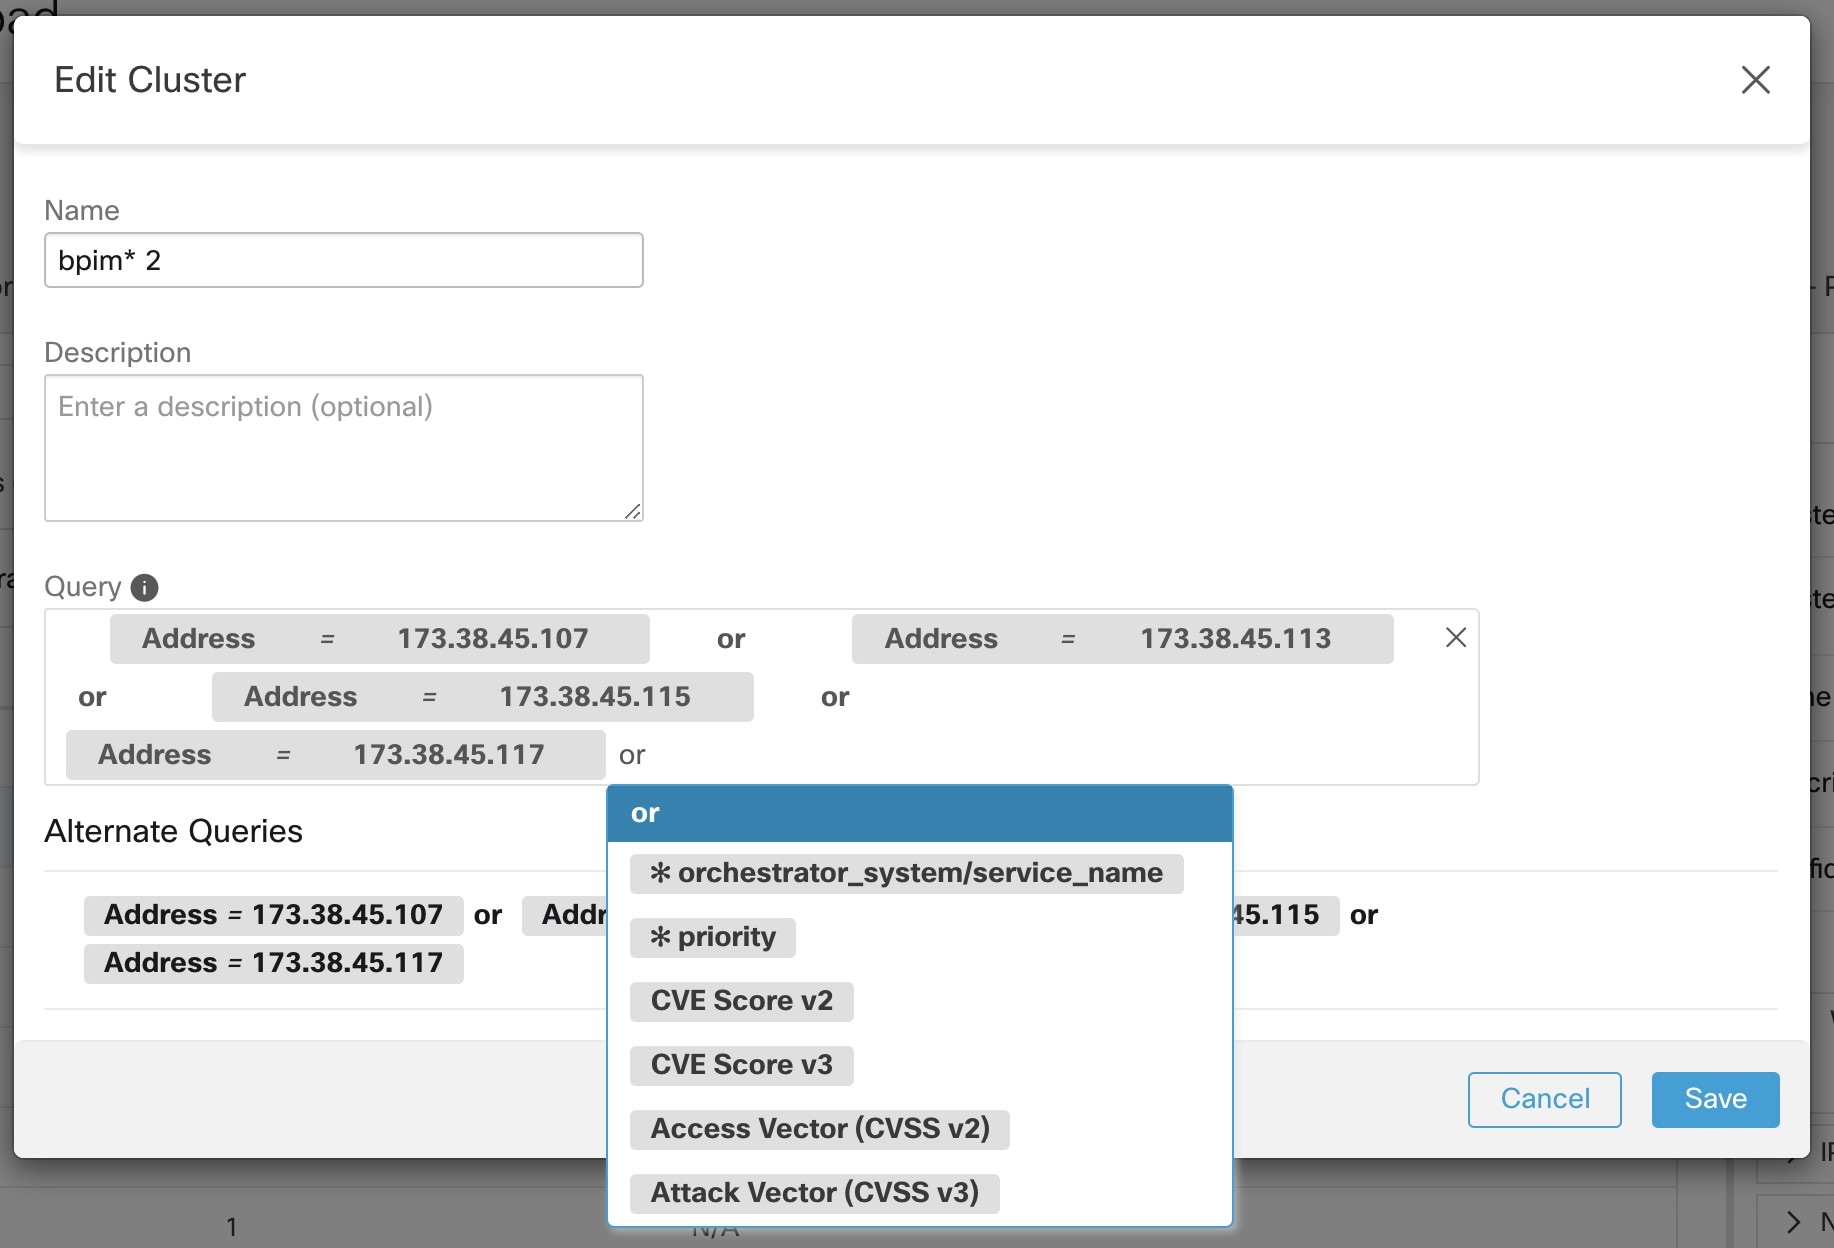
  3. To simultaneously enforce policies for another scope, click + Add Another Workspace and complete the steps.

    Repeat the process for additional scopes.
  4. Click Accept and Enforce to apply the changes.

To enforce policies for a single scope:

  1. Navigate to the primary workspace for the scope for which you want to enforce policy.

  2. Click Manage Policies.

  3. Click Enforcement.

  4. Click Enforce Policies.

  5. Step through the wizard to cofigure the policies as instructed.

    For wizard details, see Policy Enforcement Wizard.

Step 3

Click Accept and Enforce to deloy new firewall rules to the assets that are affected by policies in this workspace. A label flag is created at the time of enforcement:

Figure 68. Policy Enforcement Page with Enforcement Enabled
Policy Enforcement page showing Label flag after enforcement

Refresh the page to see the flag.


What to do next

Policy enforcement wizard

A policy enforcement wizard is a management tool that

  • allows reviewing existing policies before implementation on workloads,

  • supports downloading and comparing various policy versions, and

  • facilitates rolling back policies to former states.

When you enforce policies for a single workspace from the Enforcement page of the workspace, the policy enforcement wizard lets you:

  • Review policies before they are implemented on the workloads.

    This includes policies that are inherited from ancestor scopes.

  • Download policy changes for review.

  • Compare policy versions.

  • Choose which analyzed version of the workspace to enforce.

  • Roll back policies to a previous version.

The policy enforcement wizard operates with these stages:

  1. Select Policy Updates—Choose and analyze which policy versions to enforce, and review differences from current policies.

    You can filter and review the policy changes and download them as CSV, similar to the Policy Diff .

  2. Impacted Workloads—Display workloads impacted by new firewall rules due to selected policies.

    The result is obtained by searching all workloads enforcement agents within the union of consumers or the providers of the selected policy changes.

    The number of potentially impacted workloads cannot exceed the total number of workloads within the scope. However, the actual impacted workloads might be smaller due to other factors such as agent config intents.

    Figure 69. List of Impacted Workloads
    List of impacted Workloads

    For more details on viewing, filtering, and downloading inventory items, refer to Manage inventory for Secure Workload.

  3. Impacting Policies—Consider policies from ancestor workspaces impacting current workloads.

    Make sure that the desired allow policies from ancestor workspaces are enforced.

    Figure 70. List of ancestor workspaces and enforced versions
    List of ancestor workspaces and enforced versions
  4. Review & Accept—Summarize the enforced changes, identify impacted workloads, and enforce policies with proper documentation.

    When you click Accept and Enforce, the policies in the workspace will be used to calculate the new firewall rules that will be configured on the relevant workloads.

    You can provide a name, description, and reason for action for the newly enforced policies for future reference. In case of rollback, you can provide only the reason, as name and description for a past version cannot be changed.

    Figure 71. Review the Summary and Enforce Policy Changes
    Review the summary and enforce policy changes

Enforcement on containers

A container security policy is a guideline that

  • uses Kubernetes or OpenShift service abstractions as providers,

  • transforms policies into specific rules for provider pods, and

  • dynamically updates upon changes from the API server.

For an overview of the steps that are required to set up segmentation on container-based workloads managed by Kubernetes and OpenShift, refer to Set Up Microsegmentation for Kubernetes-Based Workloads.


Attention


Agents running on Kubernetes/OpenShift hosts must be configured to preserve existing rules.

To prevent enforcement from interfering with iptables rules added by Kubernetes, the agent must be configured with a profile that has the Preserve Rules option enabled. For more information, refer to Creating an Agent Config Profile


When enforcing policies on containers, Secure Workload Kubernetes or OpenShift service abstractions are used as providers. Internally, the policies for service abstractions are transformed into rules for the provider pods and the nodes they are running on. This transformation depends on the type of the Kubernetes or OpenShift service and is dynamically updated whenever changes are received from the API server.


Note


For NodePort and KubeloadBalancer services, the flows are routed at the node level. Hence, ensure that the policy is created at the app scope workspace where the nodes belong. Otherwise, the rules will not be generated on the node.


Example:

Consider a policy allowing traffic from hosts and pods with the label environment = production to a Kubernetes service of type NodePort with the name db which exposes TCP port 27017 on a set of pods.

Consumer

Provider

Protocol/Port

Action

environment = production

OR

orchestrator_environment = production

orchestrator_system/service_name = db

TCP 27017

Allow

This policy results in these firewall rules:

  • Hosts and Pods—On hosts and pods that are labeled with environment = production, allow outgoing connections to all Kubernetes nodes of the cluster to which the service belongs. This rule uses the node port that is assigned to this service.

  • Pods—On pods with the label environment = production, allow outgoing connections to the ClusterIP assigned to this service by Kubernetes. This rule uses the port that is exposed by the service (TCP 27017).

  • Provider Pods—On Kubernetes nodes of the cluster to which the service belongs, allow outgoing connections to the provider pods.

    On pods providing the service db, all incoming connections from all Kubernetes nodes and consumer hosts and pods. This rule uses the target port that is exposed by the service (TCP 27017).

Changes to the type of the service, ports, and set of provider pods will immediately be picked up by Secure Workload rule generator and used to update the generated firewall rules.


Caution


Policies including Kubernetesor OpenShift inventory must be designed carefully to avoid conflicting with the internal operation of the Kubernetes cluster.

Kubernetes or OpenShift items imported by Secure Workload include the pods and services constituting the Kubernetes cluster (for example, pods in the kube-system namespace). This allows precise policies to be defined to secure the Kubernetes cluster itself, but it also means that badly designed policies can affect the operation of the cluster.


Verify enforcement works as expected

Check for agent health

Verify of enforcement by performing critical checks to ensure policies function as expected.

Verify agent readiness for enforcement by referring to the agent health and readiness documentation, available at Verify Enforcement Works as Expected.

Check for escaped and rejected flows

Navigate to the Security Dashboard page and check the Segmentation Compliance Score.

A score below 100 may indicate potential issues, such as escaped or rejected flows which signal configuration errors. For more information, refer to Segmentation Compliance Score.

Reference segments

Investigate these situations using topics related to Policy Analysis Results: Understand the Basics as they apply to enforced policies.

Policy modifications

Evaluate existing policies and make necessary adjustments to accommodate legitimate traffic requirements, such as protocols and ports. Perform a thorough reanalysis before reenforcement.

View enforced policies for a specific workload (Concrete Policies)

Use this procedure to view all enforced policies for a specific workload (that is, the concrete policies for that workload). This view is useful because all policies in a workspace may not apply to every workload in the workspace, and because policies in multiple workspaces may apply to a particular workload. For example, inherited policies in parent or ancestor scopes.

Concrete policies are listed in priority order. For more information about the effects of priority, refer to the Policy Priorities section.

Before you begin

Note


Concrete policies include only policies in enforced workspaces. If a workspace is not enforced, any policies that would apply to the workload if the workspace were enforced do not appear in the list.


Procedure

Step 1

You can navigate to the Concrete Policies page for a workload from the Inventory page or from the workspace:

To navigate from the Scopes and Inventory page:

  1. Choose Organize > Scopes and Inventory.

  2. Search for the IP address of the workload and click it.

    The Workload Profile appears in a new tab.

    In general, except for cloud-based workloads that are managed without agents, Kubernetes, and OpenShift workloads, if the IP address appears in the IP Addresses tab and not in the Workloads tab, this means that an agent is not installed on the workload, so policies cannot be enforced, and there is no concrete policies list.

To navigate from the Segmentation page:

  1. Choose Defend > Segmentation.

  2. Select the scope.

  3. Click the Primary workspace.

  4. Click Manage Policies.

  5. Click the Matching Inventories tab.

  6. Search for the IP address of the workload and click it.

  7. In the panel that appears, click View Workload Profile.

    The Workload Profile appears in a new tab.

Step 2

On the Workload Profile page, click CONCRETE POLICIES.

Step 3

Click a row to view details.

For more information, see the Concrete Policies tab.

Step 4

To view the traffic stats:

  1. Click Fetch All Stats.

  2. Click each policy of interest.

Step 5

To view information about Kubernetes or OpenShift workloads, click CONTAINER POLICIES.


What to do next

Choose Monitor > Enforcement Status for status of concrete policies, for example to view if any policies have been skipped. For details, see the Enforcement Status section.

Verify that enforcement is enabled for agents

Ensure agents are properly enforced, so security measures remain active within your network.
Before you begin
Access the console with the necessary permissions to view and modify agent settings.
Procedure

Step 1

Choose Defend > Enforcement Status.

Step 2

Toggle the Filter by Scope control to view the enforcement status for a specific scope and then select a scope.

Step 3

Look at the Agent Enforcement Enabled chart.

If agents display as Not Enforced, continue with this procedure.

If all agents are enforced, no further action is required.

Step 4

Click the Not Enforced section of the chart to display the affected workloads.

Step 5

Enable enforcement on these workloads, then modify the Agent Config profile as needed. For more information, refer to Create an Agent Configuration Profile.


Verify that enforced policies are being pushed to agents

For successful enforcement, push each workload specific policy to the installed agent. The status for policy enforcement is displayed even when cloud connectors manage it, without requiring agents.

Before you begin

Enforce policies for at least one scope.

Procedure

Step 1

Choose Defend > Enforcement Status.

Step 2

Toggle the Filter by Scope control to view the enforcement status for a specific scope and select a scope.

Step 3

Look at the Agent Concrete Policies chart.

If any policies are marked as Skipped, continue with this procedure.

Otherwise, skip the rest of this procedure.

Step 4

Click the red Skipped slice of the chart to display the list of affected workloads.

Affected workloads will appear in the table next to the charts.

Step 5

Click the (i) button beside Skipped in the Concrete Policies column for details.

Use the table to interpret error messages.

Error Message

More Information

Agent does not have Windows OS

At least one policy applicable only to Windows workloads includes non-Windows consumers or providers.

Remove non-Windows workloads.

Maximum number of policies has been reached

For more information, refer to If there are too many policies for the agent.

What to do next

(Optional) Configure an alert to receive notifications if this situation occurs. For more information, refer to Configure Alerts.

If there are too many policies for the agent

The agent may not accommodate all policies due to inherent limits; requiring modifications to fit within constraints. The latest version of the policies will not be pushed if the complete set of applicable concrete policies cannot be pushed to a particular agent.

There is a limit to the number of policies supported on each agent. Policies enforced using cloud connectors also have limits. For more information about limits, refer to Configuration Limits in Secure Workload.

Before you begin

Check if enforced policies are maxed out using relevant diagnostics.

Procedure

Step 1

Navigate to the primary workspace for the affected scope.

Step 2

Modify affected policies:

  • Reduce policies to a manageable number.

  • Simplify long IP address lists, using subnets if possible.

  • Adjust cloud connector policies as per platform documentation.

Step 3

Enforce changes and monitor for any skipped policy notifications.

Step 4

Repeat the procedure for other affected scopes if necessary.


Modify Enforced Policies

Enforce new and revised policies

To effectively enforce a policy:

  • Review policy changes carefully.

  • Analyze the workspace to ensure the effects meet expectations.

  • Confirm the desired effect and enforce it using the appropriate system control.

Examples

When you make policy changes in a primary workspace, you need to reanalyze subsequent enforcement to verify expected outcomes.

View, compare, and manage enforced policy versions

Each time you enforce or re-enforce policies in a workspace after making changes, a new version (p*) is created.

For detailed information about versioning, see About policy versions (v* and p*) (reference).
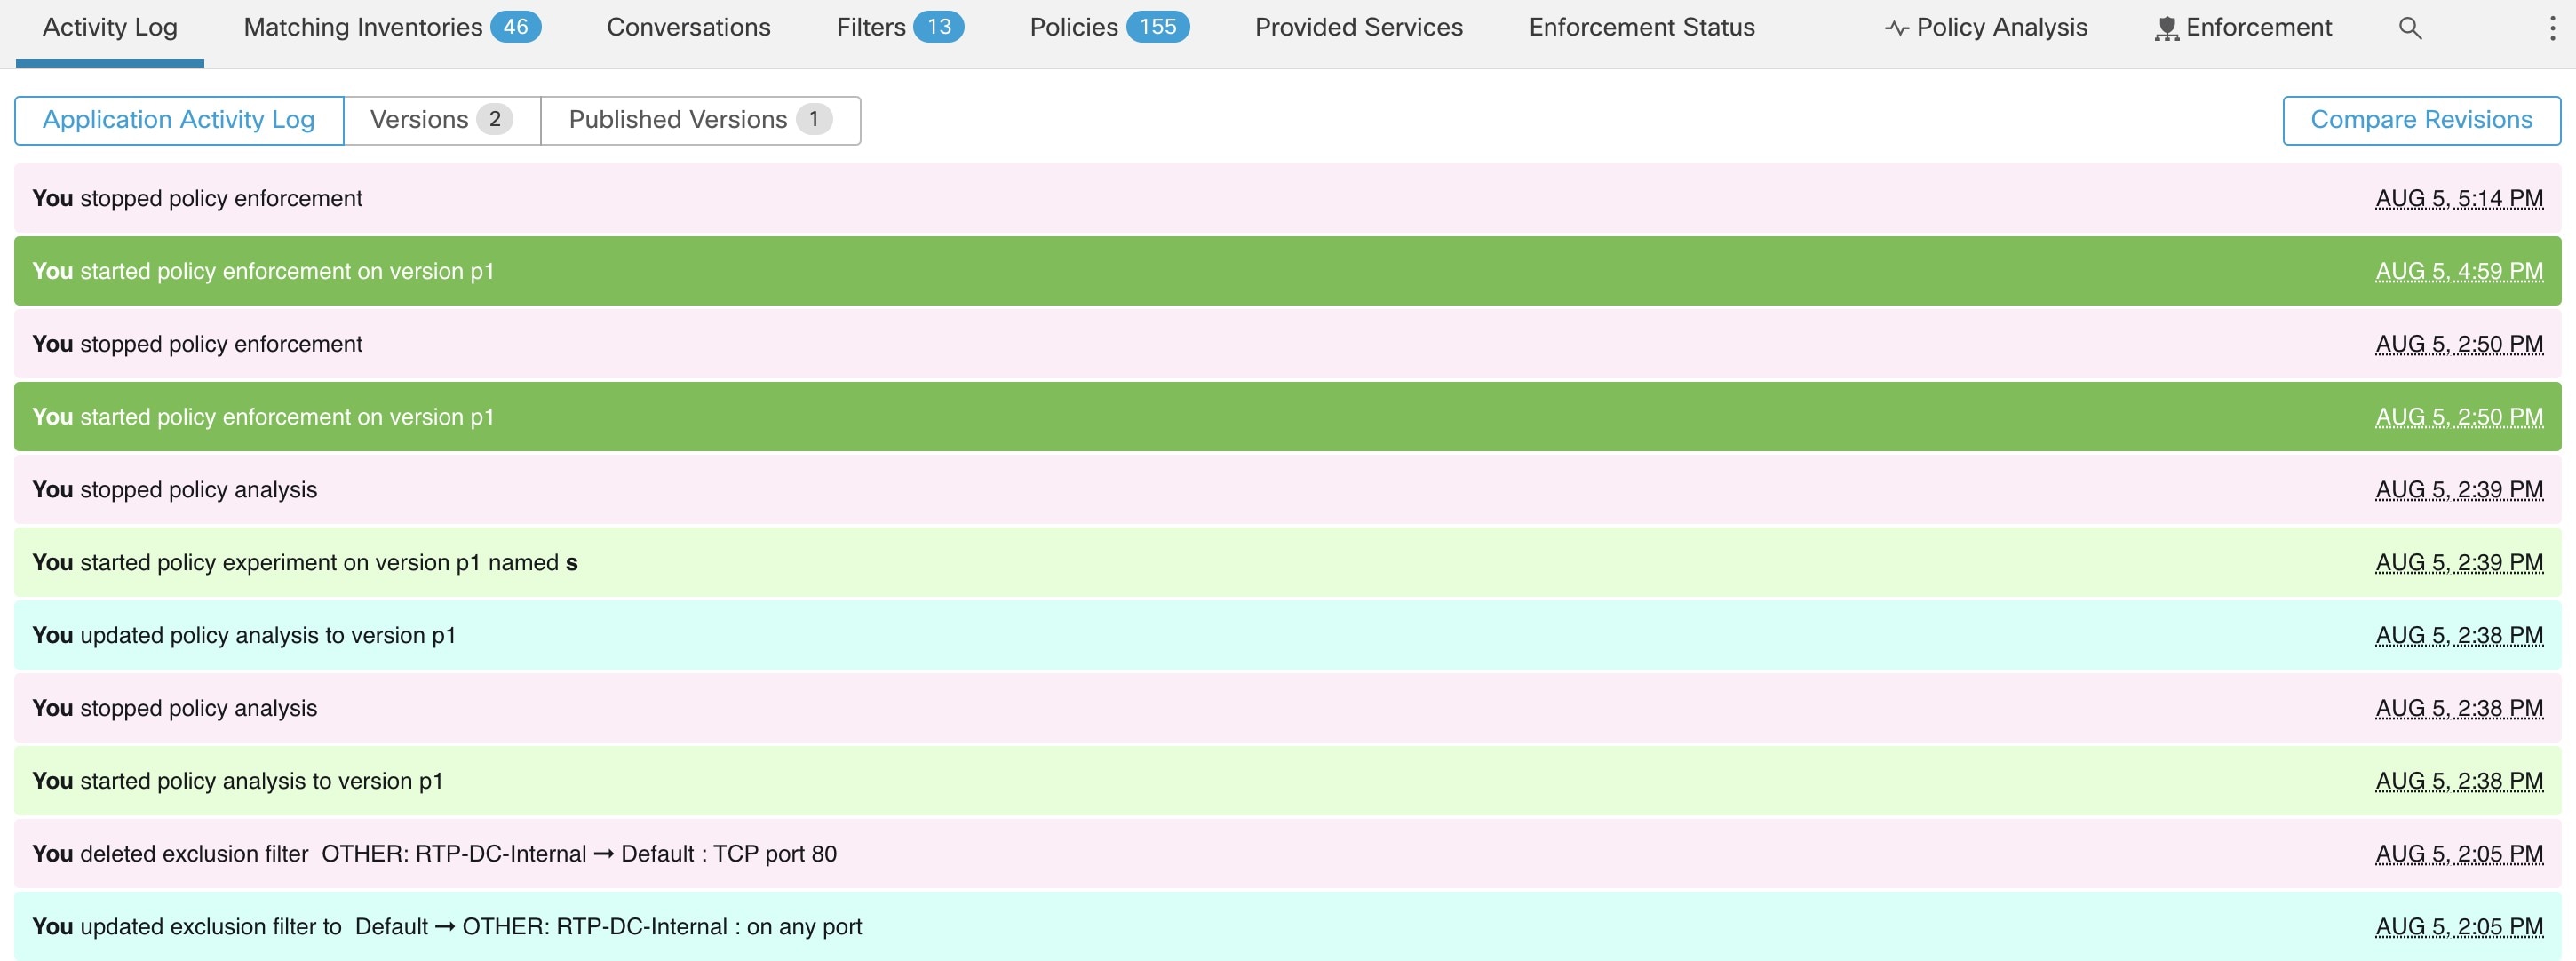
Procedure


Step 1

Choose Defend > Segmentation.
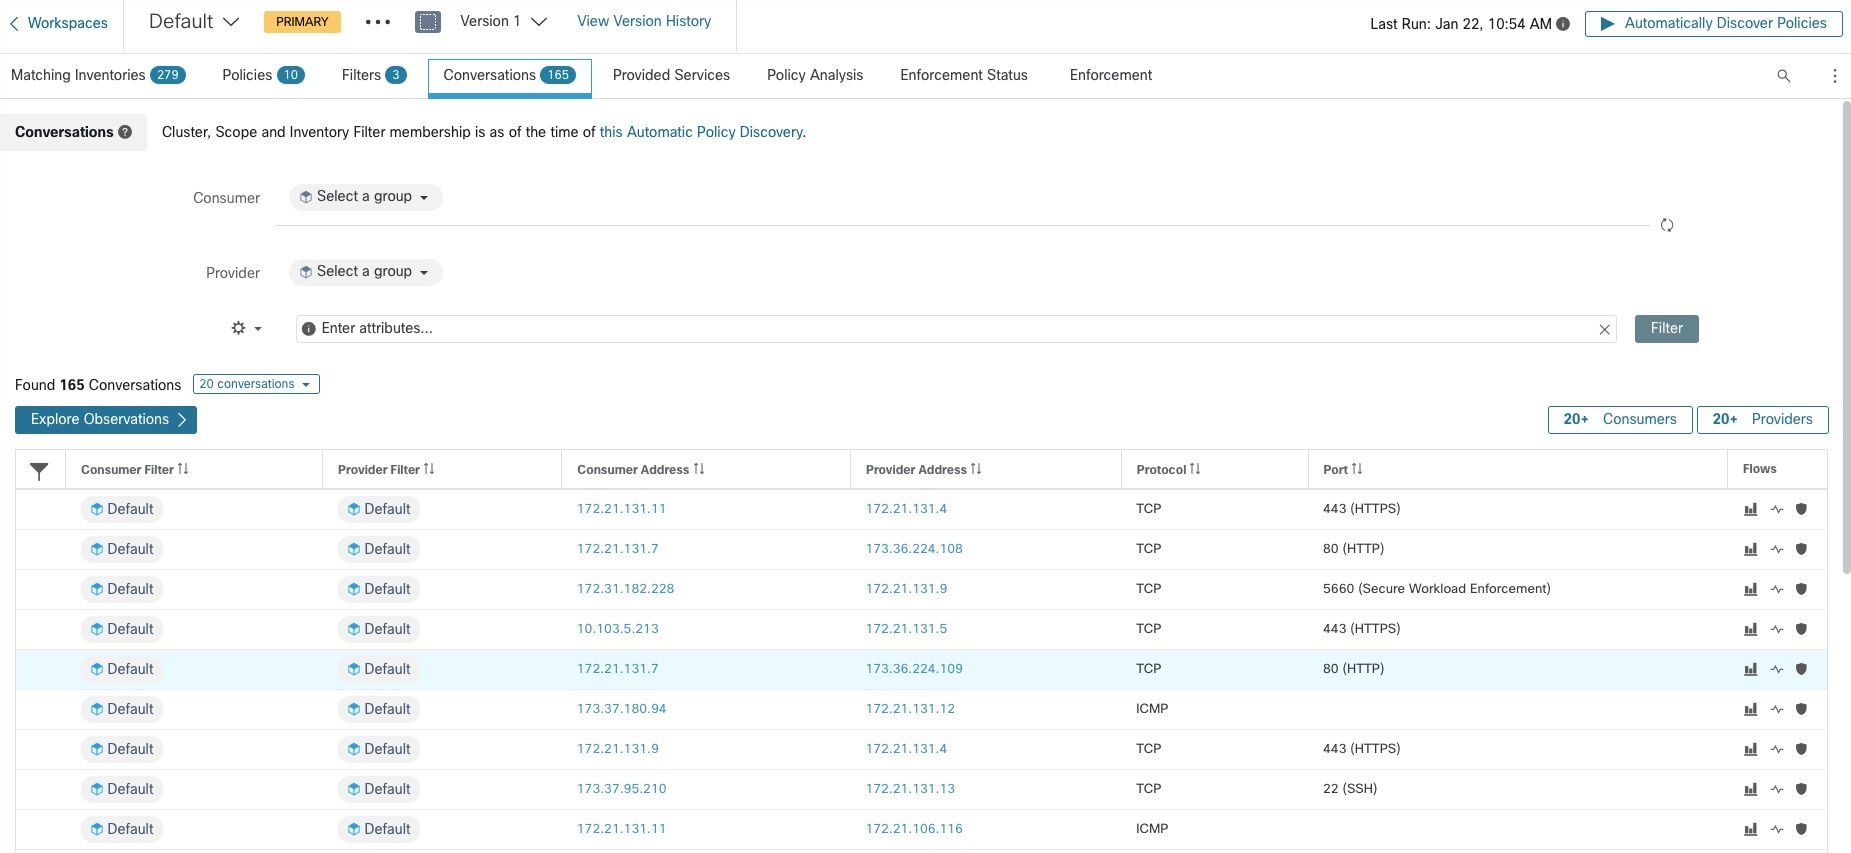
Step 2

Navigate to the relevant scope and primary workspace.

Step 3

Click Manage Policies.

Step 4

The current version of the policies is displayed at the top of the page:

Currently displayed version of policies

The displayed version may be a policy discovery version, an analyzed policy version, or an enforced version.

Step 5

Choose one option:

To display a different version of the policies:

Select the current version and change it.

For more information about the versions, refer to About policy versions (v* and p*) (reference).

Note


If you choose a v* version, refer to View, compare, and manage discovered policy versions instead of this topic, including the important caveat at the end of the topic.

To view details about the analyzed versions:

  1. Click View Version History, located beside the current version at the top of the page.

  2. Click the Published Versions tab to view the versions of analyzed and enforced policies.

  3. To view log entries for a version, click the link in the version.

    • Pale green rows indicate analysis activity.

    • Bright green rows indicate enforcement activity.

To compare two versions to check what has changed:

  1. Click Compare Revisions.

  2. Choose the versions to compare.

    You can compare the latest draft version, analyzed and enforced versions.

  3. For result details, see Comparison of policy versions: policy diff.

To delete an unwanted version:

Click More button for the version and choose Delete.

You can delete published policy versions (p* versions) unless the version is actively analyzed or enforced.

To export a version:

Click More button for the version and choose Export....

For more information, refer to Export a workspace.


What to do next

After working on versions, ensure you set the latest discovered policy version is set to prevent unintentional deletions. Additionally, explore manual policy creation.

Revert enforced policies to an earlier version

To roll back enforced policies to a previous version, examine the available policy enforcement options. Key processes include selecting an earlier policy version to be enforced again, as described in Enable policy enforcement.

Key steps to roll back enforced policies include:

  • Access policy management controls.

  • Identify and select the policy version for rollback.

  • Ensure reenforcement adheres to organizational requirements.

Ensure all steps comply with current network architecture and security mandates to prevent disruptions during policy reversion.

Disable policy enforcement

Disable policy enforcement for multiple scopes

Use the procedure described in Enable policy enforcement to enforce policy in multiple scopes simultaneously. On the Select Version page of the wizard, click Select a version and choose Disable enforcement.

Disable policy enforcement for a single scope

Navigate to the Policy Enforcement page for the scope's primary workspace and click the red Stop Policy Enforcement button. The system updates firewall rules for assets in the scope based on enforced policies in ancestor workspaces. Additionally, it creates a Label Flag with an ‘x’ on the time series chart.

Enforcement history

An enforcement history is a recordkeeping tool that

  • tracks changes to enforced workspaces,

  • lists their respective versions, and

  • provides details related to policy implementations.

To view the enforcement history:

  1. Click the caret at the right side of the Segmentation page to expand the Tools menu.

  2. Click Enforcement History.

    Each section proides a description of an event and a summary of the changes.

  3. Click an event for details about all the policies that were enforced at that time.

Figure 72. Enforcement history view
Enforcement history view

About policy versions (v* and p*) (reference)

You Can use policy versions to manage your workspace configurations effectively. These versions often display as workspace versions.

Displayed Version

The policy version you're working with appears at the top of the workspace page. Here are the types of versions:

Policy version displays at top of the workspace page
  • V* versions: Automatically generated by automatic policy discovery.

  • P* versions: Versions that have been analyzed and enforced.

Icons appears next to version numbers, showing if the version is the latest analyzed, enforced, or discovered.

Table 7. Version Icons

Latest analyzed policies icon

Indicates the version of the policies that is currently being analyzed

Latest enforced policies icon

Indicates the version of the policies that is currently being enforced

Latest version of discovered policies

Indicates the latest version of automatically discovered policies

(no icon)

Indicates that the version is not the latest version of its type

Examples:

  • Displayed version is the latest discovered version of the policies:

    Discovered policies version.
  • Displayed version is the version of the policies that is currently being analyzed:

    Policy Analysis Version
  • Displayed version is the version of the policies currently being analyzed and enforced:

    Published policy version: Analyzed and Enforced

Policy Discovery Version (v*)

Every automatical policy discovery increments the version number (v*) .

The first time you automatically discover policies, version 1 is generated. All modifications after that run, such as editing or approving clusters (but not a rerun), are also grouped under version 1. When you subsequently automatically discover policies, a new version is generated (unless discovery failed).

Importing policies also increases the version count.

To work with v* versions, refer to the View and Compare Discovered Policy versions section.

Published Policy Version (p*)

Published policy versions might refer to analyzed or enforced versions. Both types can have separate version numbers based on workspace changes.

  • Policy Analysis:

    Each time you analyze policies in a workspace, or click Analyze Latest Policies after making a change, the system takes a snapshot of all the clusters and policies that are defined in that workspace, and the "published" policy version (p*) number for analysis increments. The latest Live Policy Analysis version is shown at the top-left side of the page on the Policy Analysis tab of the primary workspace.

    Analyzed policy version on Policy Analysis tab
  • Policy Enforcement:

    Each time you enable enforcement of the policies in a workspace, or enable enforcement again after making changes, the "published" policy version (p*) for enforcement becomes the number of the analyzed version that you choose in the enforcement wizard. So, if you enforce analyzed version 5, the enforced version is also version 5, even if it is, for example, the first time policy has been enforced for the workspace. The current Enforced Policy Version is shown at the top-left side of the page on the Enforcement tab of the primary workspace.

    Enforced policy version on Enforcement tab

Managing Published (p*) Versions

Published policy versions cannot be edited; they can only be deleted entirely.


Note


Published policy versions (p*) are limited to 100 total. After reaching this limit, you must delete old versions.

For managing and deleting p* versions, refer to the sections on View and Compare Manage Analyzed Policy versions and View and Compare Manage Analyzed Policy versions or View and Compare Manage Analyzed Policy versions. Note that you can also use the API to delete published versions.


Comparison of policy versions: policy diff

To compare policies, see any of the these topics: View, compare, and manage discovered policy versions, View, compare, and manage analyzed policy versions, or View, compare, and manage enforced policy versions

Policy changes are displayed in three categories: Absolute, Default and Catch All. In the comparison table:

  • Services belonging to the same policy are grouped together

  • Filter policy changes by facet or by diff type

  • Policy changes and services are paginated

  • Download filtered policy changes as a CSV

Table 8. Facet filter properties

Property

Description

Priority

For example, 100

Action

For example, ALLOW, DENY

Consumer

For example, Consumer Cluster

Provider

For example, Provider Cluster

Port

For example, 80

Protocol

For example, TCP

Table 9. CSV output columns

Column

Description

Rank

The category of the policy. For example, ABSOLUTE, DEFAULT, CATCH_ALL

Diff

The diff type of the change. For example, ADDED, REMOVED, UNCHANGED

Priority

For example, 100

Action

For example, ALLOW, DENY

Consumer Name

The name of the consumer cluster.

Consumer ID

The ID of the consumer cluster.

Provider Name

The name of the provider cluster.

Provider ID

The ID of the provider cluster.

Protocol

For example, TCP

Port

For example, 80

Figure compares policy versions p1 and v1.

Figure 73. Policy Diff View
Policy Diff View
Figure 74. Policy Diff View Download Button
Policy Diff View Download Button
Figure 75. Filtering Policy Diff View
Filtering Policy Diff View
Figure 76. Policy Diff View Diff Type Filter
Policy Diff View Diff Type Filter
Figure 77. Policy Diff View Grouping
Policy Diff View Grouping
Figure 78. Policy Diff View CSV Output
Policy Diff View CSV Output

Tip


For more information, refer to Comparing versions of generated clusters: Diff Views.


Activity logs and version history

An activity log is a feature that provides several functionalities:

  • records modifications made in a workspace,

  • displays which user performed each action, and

  • includes activities such as adding, removing, renaming workloads and clusters, and moving workloads between clusters.

The version history is a feature that:

  • shows the log of events applicable to a specific workspace version,

  • enables you to view the modification history, and

  • provides links to policy version management pages.

To view the modification history for a workspace:

  1. Choose Defend > Segmentation.

  2. Select the relevant scope and workspace.

  3. Click the View Activity Logs link.

  4. Click the Workspace Activity Log tab.

Figure 79. Log of Events Applicable to Version v1 of this Workspace
Log of events applicable to version v1 of this workspace

For information about the version-related tabs and options on the page, refer to:

Automatic Deletion of Old Policy Versions

The policy deletion process is a system management feature that:

  • Automatically removes workspace versions not accessed for six months

  • Deletes policy experiments not accessed in the last 30 days

  • Helps manage system resources efficiently.

Every week, the system automatically deletes old data that hasn't been accessed for a defined period, optimizing resource use and maintaining system performance.

This approach helps manage old and irrelevant policy versions, preventing excessive data accumulation and aiding in resource conservation.

Conversations

A conversation is a network service that

  • is provided by one host on a particular port,

  • is consumed by another host, and

  • comprises many flows over different times.

Automatic policy discovery processes involve collecting all flows and ignoring ephemeral or client ports, and deduplicating them to generate the conversation graph. For conversations between host A and host B on server (provider) port N, ensure at least one flow is observed from A to B on port N within the timeframe for which automatic policy discovery is performed.

Use flow data to understand which flows associate with which process while evaluating clusters in automatic policy discovery.

Agents collect information providing visibility of unused L4 ports which are ports without communication during the selected interval for automatic policy discovery. Use this information to open policies for communication on those ports or close applications binding to unused ports, reducing the attack surface of the workload.

Client-Server classification affects the conversation view in automatic policy discovery. It determines which port is dropped (is deemed ephemeral) in the aggregation: For more information, refer to Client Server Classification.

Conversations table view

The conversation tables view is a feature that:

  • enables viewing of aggregated flows collected during automatic policy discovery,

  • summarizes all data by removing the consumer port for the specified period , and

  • enables showing conversations between IP addresses instead of policy filters.

Figure 80. Conversations table view
Conversations Table View

Note


You can manage file sizes by applying filters to enable downloads for files up to 200 MB. Larger files require reducing columns or conversations.


Choosing consumer or provider

Consumers and Providers are selected using the typeahead dropdown selector. The selector allows the user to choose inventory filters, scopes, and clusters. All conversations between the chosen Consumer and Provider are displayed. To remove a filter, click the ‘x’ icon.

During automatic policy discovery, the system matches the Consumer and Provider with all inventory filters where the IP address is a member. For example, searching for the “root scope” will match all the conversations even though some IPs may be better matched by more specific scopes. To enable specific matches, select the the Restrict scope filtering to an IP’s best match option from the settings dropdown next to the faceted filter input.

Figure 81. Choosing Consumer or Provider
Choosing Consumer or Provider

Conversation Filters

Figure 82. Conversation Filters
Conversation Filters

This is where you define filters to narrow-down the search results. All the possible dimensions can be found by clicking on the (?) icon next to the word Filters. For any User Labels data, those columns will also be available for the appropriate intervals. This input also supports and, or, not, and parenthesis keywords, use these to express more complex filters. For example, a direction-agnostic filter between IP 1.1.1.1 and 2.2.2.2 can be written:

Consumer Address = 1.1.1.1 and Provider Address = 2.2.2.2 or Consumer Address = 2.2.2.2 and Provider Address = 1.1.1.1 And to additionally filter on Protocol = TCP:

(Consumer Address = 1.1.1.1 and Provider Address = 2.2.2.2 or Consumer Address = 2.2.2.2 and Provider Address = 1.1.1.1) and Protocol = TCP

The filter input also supports “,” and “-” for Port, Consumer Address and Provider Address, by translating “-” into range queries. The following are examples of a valid filter:

Figure 83. Filter input Supports Range Query for Consumer Address
Filter input supports range query for Consumer Address

Available filters:

Filters

Description

Consumer Address

Enter a subnet or IP Address using CIDR notation (for example, 10.11.12.0/24). Matches conversation flow observations whose consumer address overlaps with the provided IP Address or subnet.

Provider Address

Enter a subnet or IP Address using CIDR notation (for example, 10.11.12.0/24) Matches conversation flow observations whose provider address overlaps with provided IP address or subnet.

Port

Matches conversation flow observations whose port overlaps with provided port.

Protocol

Filter conversation flow observations by Protocol type (TCP, UDP, ICMP).

Address Type

Filter conversation flow observations by Address type (IPv4, IPv6, DHCPv4).

Confidence

Indicated the confidence in the direction of flow. Possible values: High, Very High, Moderate.

Excluded?

Match conversations that are excluded by an exclusion filter or approved policy.

Excluded By

Match conversations excluded by a specific filter. Possible values: Exclusion Filter, Policy.

Explore observations

A chart serves as a visualization tool to:

  • enable quick exploration of high-dimensional data,

  • represent observations through lines intersecting various axes, and

  • use a "Parallel Coordinates" chart for better understanding of data.

The Explore Observations feature includes a chart view that allows quick exploration of the high-dimensional data using a “Parallel Coordinates” chart. The chart is useful when you enable only the dimensions you are interested in by unchecking items in the Dimensions dropdown and rearranging their order. Each line represents a single observation and intersections show the observation's value across dimensions. When you hover over the list of observations, the specific line in the chart is highlighted.

Figure 84. Explore Observations
Explore Observations

Conversation observation hovered

A conversation observation is a data insight that

  • involves mapping conversation interactions,

  • provides context for data positioning, and

  • enables efficient visibility in list views.

Converstations data is high-dimensional. Dsable unwanted dimensions to enhance visual clarity. The hover state in Explore Conversations maps each conversation with the table list view. This feature improves navigation and data assessment efficiency without requiring extensive scrolling.

Figure 85. Conversation Observation Hovered
Conversation Observation hovered

Filtering

A filtering concept is a method that

  • allows users to make selections along axes,

  • updates observation lists dynamically, and

  • enhances the clarity of observation data.

Drag the cursor along any axis to create selections that show observations matching those selections. Clicking on the axis again will remove the selections. Users can make selections on any number of axes simultaneously, and the list of observations will subsequently update to show only the selected conversations.

Figure 86. Filtering
Filtering

Top consumersor providers of conversations

A top Consumers or Providers list is a feature that:

  • Highlights Consumers or Providers in a network based on conversation count

  • Offers user-selected filters that modify results dynamically

  • Displays additional details such as address, hostname, and annotated fields.

You can view the number of top Consumers or Providers based on total conversations with selected filters using the buttons on top of the Conversations table. Each button reveals a dialog displaying a table with columns such as Conversation Count, Consumer/Provider’s Address, Hostname, and other User-Annotated columns.

Figure 87. Above the Conversations Table
Above the conversations table
Figure 88. Top Consumers Modal
Top Consumers Modal
Figure 89. Top Providers Modal
Top Providers Modal

Automated load balancer config for automatic policy discovery (F5 Only)


Important


This experimental feature and its APIs are currently in ALPHA, and will receive changes and enhancements in upcoming releases.

Automatic policy discovery generates policies using the configuration for load balancers connected to an external orchestrator. This approach reduces dependency on flow data and enhances the accuracy of discovered clusters and policies.

This process relies on clients reporting flows to the load balancer, which then generates policies to permit this traffic.

Terminology

Virtual IP (VIP): Describes the IP where clients send service-destined traffic.

SNAT IP (SNIP): Used by a load balancer to direct traffic to backend hosts.

Backend Endpoint (BE): Indicates the specific IP of a backend host in communication setups.

Health-check IP (HIP): Used by the load balancer to send health-check traffic to backend hosts.


Note


HIPs are identical to SNIPs in automap mode, but they differ when a SNAT pool is configured.


Deployment

A deployment strategy is a methodology that

  • involves the context for setting up load balancer scopes,

  • defines the client, lb, and be scope queries,

  • ensures coherence in SNIPs and VIPs scope.

Figure 90. Deployment
Deployment

In this deployment, load balancer VIPs, SNIPs, and HIPs are in the lb scope, and BEs are in the be scope. Scopes are created as follows.

  • Client Scope—Communicates with the load balancer. For example, use the following client scope query:

    address eq 192.168.60.21 or address eq 192.168.60.22
  • lb Scope—The F5 external orchestrator labels VIPs, SNIPs, HIPs, and BEs used by the load balancer. These labels can be used to construct scope queries, where orchestrator_system/service_name is used for selecting VIPs, orchestrator_system/service_startpoint SNIPs, and orchestrator_system/service_healthcheck_startpoint HIPs for the service. For example, a scope query that includes VIPs, SNIPs, and HIPs for service db is as follows:

    user_orchestrator_system/cluster_id eq 1234 and
    (user_orchestrator_system/service_name eq db or
    user_orchestrator_system/service_startpoint eq db or
    user_orchestrator_system/service_healthcheck_startpoint eq db)

Note


SNIPs and VIPs must be part of the same scope.


  • user_orchestrator_system/service_endpoint selects BEs for a service. For example, a scope query includes BEs for service db like this:

    user_orchestrator_system/cluster_id eq 1234 and
    user_orchestrator_system/service_endpoint eq db

Clusters

A cluster is a network architecture component that:

  • includes different types of groups based on roles,

  • is automatically generated based on the scope of load balancing, and

  • involves visible and related service clusters.

Each service generates up to four discovered clusters, with only the service cluster that is visible to the user. SNIP, HIP, and BE clusters appear as related clusters for the service cluster. HIP and BE clusters are generated when HIPs and BEs are present only in the lb scope.

  • SNIP Cluster—Contains SNIPs for the service and is automatically generated when SNIPs are in the load balancer scope.

  • HIP Cluster—Contains HIPs for service, generated under similar conditions as SNIP clusters.

  • BE Cluster—Created when Back Ends (BEs) are part of the load balancer scope; otherwise added to related service clusters.

Example

Automatic policy discovery generates a SNIP cluster and HIP cluster in the lb scope that include SNIPs and HIPs for service. If BEs are outside the lb scope, automatic policy discovery does not generate a backend cluster but adds the be scope to the list of related clusters for db.

Queries for generating clusters:

  • Service Cluster Query—The service cluster includes VIPs for service. The query for the service cluster is:

    user_orchestrator_system/cluster_id eq 1234 and
    user_orchestrator_system/namespace eq common and
    user_orchestrator_system/service_name eq db
  • SNIP Cluster Query—SNIPs for a service are included in the SNIP cluster. The query for the SNIP cluster is:

    user_orchestrator_system/cluster_id eq 1234 and
    user_orchestrator_system/service_startpoint eq db
  • HIP Cluster Query—HIPs for a service are included in the HIP cluster. The query for the HIP cluster is:

    user_orchestrator_system/cluster_id eq 1234 and
    user_orchestrator_system/service_healthcheck_startpoint eq db
  • Backend Cluster—A backend cluster for the service is generated when one or more BEs are part of the lb scope. This does not apply to the example, so the backend cluster is not generated in the lb scope.

Policies

A policy framework is a collection of rules that

  • defines traffic management between clients and servers,

  • automatically creates rules based on configurations, and

  • ensures security compliance by generating firewall rules.

Policy Example

Figure 91. Policy Generation
Policy Generation

Assume you have a service db with VIP 192.168.60.100, SNIP 192.168.50.100, and a backend VM with IP 192.168.50.11 listening on port 10000. Traffic from client VM 192.168.60.21 to db generates policies:

  • Policy from client to VIP

    Allows communication from a client VM to the service db through specified port 10000 using the TCP protocol.

    {
    "src": "<uuid of client scope>",
    "dst": "<uuid of service cluster>",
    "l4_params": [
    {
    "port": [
    10000,
    10000
    ],
    "proto": 6,
    }
    ]
    }
  • Policy from SNIP to BE.

    Auto-generated policy for allowing traffic from the SNIP to the backend (BE) is linked to the service db.

    {
    "src": "<uuid of SNIP cluster>",
    "dst": "<uuid of be scope>",
    "l4_params": [
    {
    "port": [
    10000,
    10000
    ],
    "proto": 6,
    }
    ]

    A policy connector from the lb scope to the be scope pushes this policy to it.

    Consumer

    Provider

    Port

    Protocol

    Action

    SNIP

    be

    10000

    TCP

    Allow

    Generates firewall rules on BE host 192.168.50.11 to allow incoming traffic from LB SNIP 192.168.50.100 on port 10000.

  • Policy from HIP to BE.

    Automatically generated to permit incoming ICMP traffic from SNIP's HIP to BE.

    {
    "src": "<uuid of HIP cluster>",
    "dst": "<uuid of be scope>",
    "l4_params": [
    {
    "port": [
    0,
    0
    ],
    "proto": ICMP,
    }
    ]
    }

    A policy connector from the lb scope to the be scope pushes this policy to it.

    Consumer

    Provider

    Port

    Protocol

    Action

    HIP

    be

    0

    ICMP

    Allow

    This generates firewall rules on BE host 192.168.50.11 allowing incoming ICMP traffic from LB HIP 192.168.50.2.

Caveats

A caveat is a concern in load balancer configurations that

  • occurs when multiple services share the same name in a single load balancer instance,

  • results in backend rules that include backend pools for all such services, and

  • makes those rules more permissive than necessary.

Policies publisher

A Policies Publisher is a Cisco Secure Workload feature that

  • allows third-party vendors to implement customized enforcement algorithms optimized for network appliances,

  • publishes defined policies to a Kafka instance residing within a Cisco Secure Workload cluster, and

  • provides customers with Kafka client certificates for retrieving policies and translating them into their network appliances' configurations.

This feature is particularly beneficial for vendors working with load balancers or firewalls. In Linux Java environments, you can refer to instructions to efficiently use the Policies Publisher feature.

Getting kafka client certificates

A Kafka client certificate is a security credential that:

  • ensures secure communication for Kafka clients,

  • provides specific user role access, and

  • is available in a downloadable Java Keystore format for easy integration.

To manage data security, you must enforce policies to create a corresponding Kafka topic tied to an account with the "Owner" capability.

  • Create a user role with the capability “Owner” and assign it to a user account of choice.

    Figure 92. User Role Configuration to Receive Policies from Kafka
    User role configuration to receive policies from Kafka
  • Enforce policies to create a Kafka topic associated with active scope. For more information on policy enforcement, refer to Enforce Policies.

  • Navigate to Manage > Data Tap Admin

  • Select the Data Taps tab and click Download under the Actions column to download Kafka client certificates. Make sure to select the Java Keystore format in the download dialog.

    Figure 93. Data Taps View
    Data Taps view
  • The downloaded client certificates file usually has a name like Policy-Stream-10-Policies- Subscription.jks.tar.gz. Create a directory and unpack it for further usage:

    
        mkdir Policy-Stream-10-Policies-Subscription
        tar -C Policy-Stream-10-Policies-Subscription -zxf Policy-Stream-10-Policies-Subscription.jks.tar.gz
    

Protobuf definition file

A Protobuf definition is a format that

  • encodes data for structured messaging,

  • is lightweight and efficient,

  • facilitates data exchange across diverse systems.

The network policies of the Cisco Secure Workload backend to Kafka are encoded in Google Protocol Buffers format, ensuring efficient data transfer. For instructions on downloading and installing on a Linux system, refer to this guide.

The proto file of Secure Workload network policy can be downloaded from here.

Data model of Secure Workload network policy

A data model is a structured representation that:

  • organizes entities like InventoryGroups and Intents,

  • facilitates policy-driven network management, and

  • supports scalable enforcement through Kafka.

The Secure Workload Network Policy depends on a UML diagram that exposes various entities to Kafka.

Figure 94. Data Model of Secure Workload Network Policy
Data Model of Secure Workload Network Policy

A Secure Workload Network Policy as modeled in protobuf contains InventoryGroups, Intents and CatchAll policies. Each policy contains all the items belonging to a single root scope.

  • InventoryGroup —Lists InventoryItems, representing Secure Workload entities such as servers or appliances by specifying their network address (singular network address, subnet or address range).

  • Intent—Defines action (allow or deny) to be taken when a network flow matches with the given consumer’s InventoryGroup, provider’s InventoryGroup and the network protocols and ports.

  • CatchAll—Represents the catch-all action defined for the root scope inside Secure Workload. If no workspace with enforcement enabled exists for the root scope, a default policy of ALLOW is written to the produced policy.

When users trigger enforcement or there is a change in inventory groups, Secure Workload backend sends a full snapshot of defined network policies to Kafka as a sequence of messages represented as KafkaUpdates. For full snapshot reconstruction and eror mitigation, refer to the KafkaUpdate documentation in the tetration_network_policy.proto file.

If the KafkaUpdate message size exceeds 10 MB, then Secure Workload backend splits this message into multiple fragments, each with a size of 10 MB. If there are multiple fragments, only the first fragment has the ScopeInfo field of TenantNetworkPolicy. The ScopeInfo will be set to nil in the remaining fragments of KafkaUpdate message.

Reference implementation of Secure Workload network policies client

For implementation and instructions on how to compile and run a demo client, refer to tnp-enforcement-client in Java.

This implementation provides common code to read network policies from Secure Workload policy stream via Kafka. Implement the required interface to integrate vendor-specific code for programming the actual policies to a network device. For more information, refer to PolicyEnforcementClient.