- Title Page
- Table of Contents
- Preface
- Setting Up Devices and Using the GUI Clients
- Working with the Cisco Prime Network Vision Client
- Viewing and Managing NE Properties
- Device Configurations and Software Images
- Working with Prime Network Vision Maps
- Working with Links
- Labeling NEs Using Business Tags
- Working with the Prime Network Events
- Tracking Faults Using Prime Network Events
- Working with Tickets in Cisco Prime Network Vision
- Working with Reports
- Using Cisco PathTracer to Diagnose Problems
- Monitoring Carrier Ethernet Services
- Monitoring Carrier Grade NAT Properties
- Monitoring DWDM Properties
- Monitoring Ethernet Operations, Administration,and Maintenance Tool Properties
- Monitoring Y.1731 IPSLA Configuration
- IPv6 and IPv6 VPN over MPLS
- Monitoring MPLS Services
- Viewing IP and MPLS Multicast Configurations
- Monitoring MToP Services
- Viewing and Managing SBCs
- Monitoring AAA Configurations
- Monitoring IP Pools
- Monitoring BNG Configurations
- Monitoring Mobile Technologies
- Monitoring Data Center Configurations
- Icon and Button Reference
- Glossary
- Index
- User Roles Required to Manage Reports
- Using the Report Manager
- Report Categories
- Generating Reports
- Scheduling Reports
- Managing Reports
- Defining Report Types
- Managing Report Folders
Working with Reports
Cisco Prime Network (Prime Network) provides a Report Manager that enables you to schedule, generate, view, and export reports of the information managed by Prime Network. You can save the generated reports in any of the following formats: PDF, CSV, HTML, XLS, and XML.
In addition to a variety of standard reports for events and inventory, you can define reports as required for your environment. The following topics discuss the Report Manager and reports in more detail:
•![]() User Roles Required to Manage Reports
User Roles Required to Manage Reports
User Roles Required to Manage Reports
This topic identifies the roles that are required to manage reports. Prime Network determines whether you are authorized to perform a task as follows:
•![]() For GUI-based tasks (tasks that do not affect elements), authorization is based on the default permission that is assigned to your user account.
For GUI-based tasks (tasks that do not affect elements), authorization is based on the default permission that is assigned to your user account.
•![]() For element-based tasks (tasks that do affect elements), authorization is based on the default permission that is assigned to your account. That is, whether the element is in one of your assigned scopes and whether you meet the minimum security level for that scope.
For element-based tasks (tasks that do affect elements), authorization is based on the default permission that is assigned to your account. That is, whether the element is in one of your assigned scopes and whether you meet the minimum security level for that scope.
For more information on user authorization, see the Cisco Prime Network 3.10 Administrator Guide.
The following tables identify the tasks that you can perform:
•![]() Table 11-1 identifies whether you can generate a report if a selected element is not in one of your assigned scopes.
Table 11-1 identifies whether you can generate a report if a selected element is not in one of your assigned scopes.
•![]() Table 11-2 identifies whether you can generate a report if a selected element is in one of your assigned scopes.
Table 11-2 identifies whether you can generate a report if a selected element is in one of your assigned scopes.
•![]() Table 11-3 identifies the tasks you can perform on the reports that you generate.
Table 11-3 identifies the tasks you can perform on the reports that you generate.
•![]() Table 11-4 identifies the tasks you can perform on the reports that someone else generates.
Table 11-4 identifies the tasks you can perform on the reports that someone else generates.
•![]() Table 11-5 identifies the tasks you can perform on report folders.
Table 11-5 identifies the tasks you can perform on report folders.
By default, users with the Administrator role have access to all managed elements. To change the Administrator user scope, see the topic on device scopes in the Cisco Prime Network 3.10 Administrator Guide.
|
|
|
|
|
|
|
|---|---|---|---|---|---|
Generate Events Reports |
|||||
• |
— |
— |
— |
— |
X |
• |
— |
— |
— |
Partial1 |
X |
• |
— |
— |
— |
— |
X |
Generate Inventory Reports |
— |
— |
— |
— |
X |
Generate Network Service Reports |
— |
— |
— |
— |
X |
1 A user with the Configurator role can generate Detailed Provisioning Events reports for elements that are in and outside their scope. |
|
|
|
|
|
|
|
|---|---|---|---|---|---|
Generate Events Reports |
|||||
• |
X |
X |
X |
X |
X |
• |
— |
— |
— |
Partial2 |
X |
• |
X |
X |
X |
X |
X |
Generate Inventory Reports |
X |
X |
X |
X |
X |
Generate Network Service Reports |
X |
X |
X |
X |
X |
1 Detailed Ticket reports include only those tickets that have a root cause alarm associated with an element in the user's scope. 2 A user with the Configurator role can generate Detailed Provisioning Events reports for elements that are in and outside their scope. |
|
|
|
|
|
|
|
|---|---|---|---|---|---|
|
|
|||||
Schedule reports |
X |
X |
X |
X |
X |
Cancel reports |
X |
X |
X |
X |
X |
Delete reports |
X |
X |
X |
X |
X |
Export reports |
X |
X |
X |
X |
X |
Rename reports |
X |
X |
X |
X |
X |
Save reports |
X |
X |
X |
X |
X |
Set report preferences for purging and sharing |
— |
— |
— |
— |
X |
Share/unshare reports |
X1 |
X1 |
X1 |
X1 |
X |
View report properties |
X |
X |
X |
X |
X |
View reports |
X |
X |
X |
X |
X |
1 You can share or unshare reports only if sharing is enabled in Prime Network Administration. |
|
|
|
|
|
|
|
|---|---|---|---|---|---|
|
|
|||||
Create folders |
X |
X |
X |
X |
X |
Delete folders1 |
X |
X |
X |
X |
X |
Move folders1 |
X |
X |
X |
X |
X |
Rename folders1 |
X |
X |
X |
X |
X |
View report folder properties |
X |
X |
X |
X |
X |
View report type properties |
X |
X |
X |
X |
X |
1 You cannot perform this action on system-generated folders, such as the Events Reports folder. |
Using the Report Manager
The Report Manager is available from Prime Network Vision, Prime Network Events, and Prime Network Administration by choosing Reports > Report Manager. The Report Manager (shown in Figure 11-1) enables you to run standard reports, such as the number of syslogs by device.
The Report Manager also enables you to create reports and folders, view previously generated reports, define report types for your use, and organize reports in a manner suited to your environment and needs.
Figure 11-1 Report Manager Window
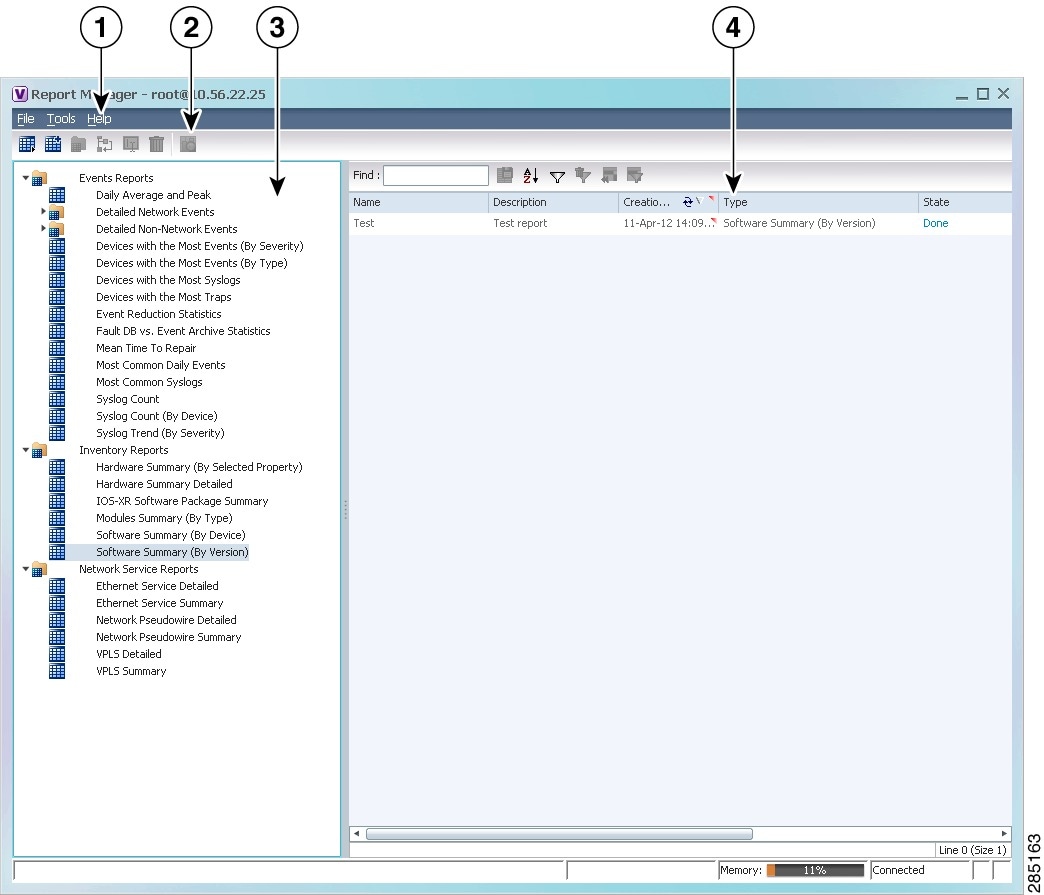
|
|
Menu bar |
|
Navigation tree with report types and folders |
|
|
Toolbar |
|
Content pane |
Figure 11-2 shows an example of a generated report with a pie chart.
Figure 11-2 Sample Report
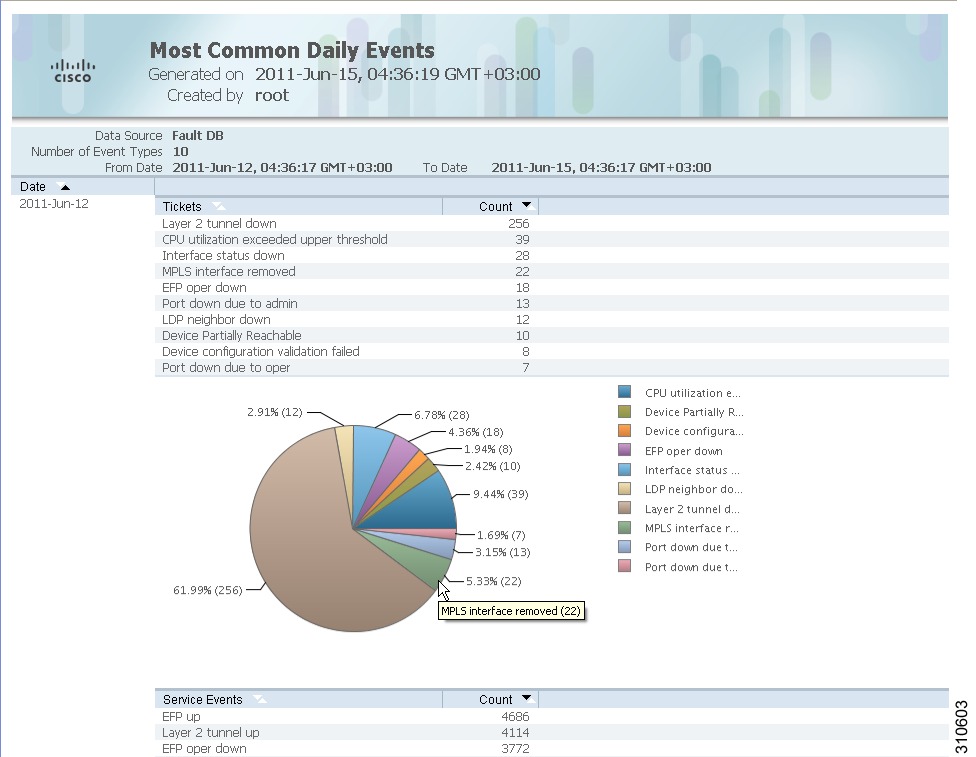
Generated reports contain the following information in the report heading:
•![]() Report name
Report name
•![]() Date, time, and time zone in which the report was generated
Date, time, and time zone in which the report was generated
•![]() Name of user who generated the report
Name of user who generated the report
Depending on the type of report, the following additional information can appear in the report heading:
•![]() Source of the data, such as the fault or alarm database
Source of the data, such as the fault or alarm database
•![]() Time period covered by the report
Time period covered by the report
•![]() Number of items included in the report
Number of items included in the report
•![]() Any filters or maps applied to the report
Any filters or maps applied to the report
A report might also include a pie chart. If you hover your mouse cursor over a section in the pie chart, a tooltip displays the information associated with that section, such as IP address, number of events, type of event, or percentage of total events.

Note ![]() Not all reports include pie charts. In addition, reports that normally include a pie chart do not display a pie chart if the chart exceeds 25 slices.
Not all reports include pie charts. In addition, reports that normally include a pie chart do not display a pie chart if the chart exceeds 25 slices.
Menu Options
Table 11-6 describes the menu options available in the Report Manager window.
Report Manager Toolbar
Table 11-7 identifies the buttons that appear in the Report Manager toolbar.


Navigation Tree
The navigation pane displays a tree-and-branch representation of report folders and types of reports. The highest level in the tree displays report folders. The following standard report folders are provided in Report Manager:
•![]() Events Reports
Events Reports
•![]() Inventory Reports
Inventory Reports
•![]() Network Service Reports
Network Service Reports
Each folder contains the types of reports that are provided with Prime Network and any user-defined reports. For more information on the standard report types, see Table 11-12.
When you select an item in the tree, the content pane displays the generated reports as follows:
•![]() If you select a folder, the content pane lists all reports that have been generated using any of the report types in that folder.
If you select a folder, the content pane lists all reports that have been generated using any of the report types in that folder.
•![]() If you select a report type, the content pane lists all reports that have been generated of that report type.
If you select a report type, the content pane lists all reports that have been generated of that report type.
Content Pane
The content pane lists all reports generated for the folder or report type selected in the navigation tree. You can double-click a report to view the report in HTML format.
Figure 11-3 shows an example of the content pane.
Figure 11-3 Reports Manager Content Pane
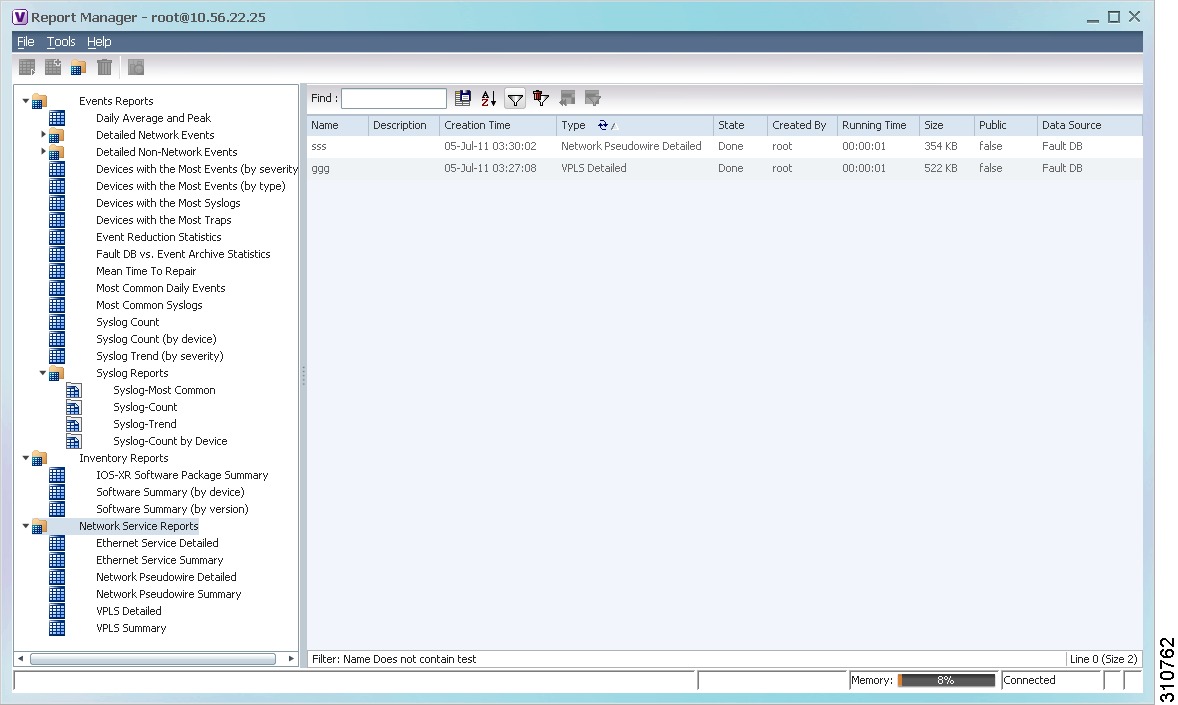
Table 11-8 describes the information displayed in the content pane for each report.
|
|
|
|---|---|
Name |
Name of the report. Double-click the report to view the report in HTML format. |
Description |
Brief description of the report. |
Creation Time |
Date and time when the report was generated. |
Type |
Report type. |
State |
State of the report: Running, Done, Canceled, or Failed. For more information about the Failed state, see Generating Reports. |
Created By |
User who created the report. |
Running Time |
Amount of time it takes for the report to be complete. |
Size |
Report size. |
Public |
Availability of the report to other users: • • |
Data Source |
Source of the information for the report: Fault Database, Event Archive, or Network Elements. |
Note ![]() Reports are purged from Prime Network after 90 days by default. This setting can be modified by changing the setting in Prime Network Administration. For more information, see the Cisco Prime Network 3.10 Administrator Guide.
Reports are purged from Prime Network after 90 days by default. This setting can be modified by changing the setting in Prime Network Administration. For more information, see the Cisco Prime Network 3.10 Administrator Guide.
Right-Click Options
Right-click options are available for:
Navigation Pane Folders
Table 11-9 describes the options available when you right-click a folder in the navigation pane.
|
|
|
|---|---|
New Folder |
Creates a new folder. |
Delete |
Deletes a user-defined folder. |
Rename |
Renames a user-defined folder. |
Move |
Moves a user-defined folder. |
Properties |
Displays the Folder Properties window which lists the folder contents. For more information on the Reports Category Properties window, see Viewing Folder and Report Type Properties. |
Navigation Pane Reports
Table 11-10 describes the options available when you right-click a report in the navigation pane.
|
|
|
|---|---|
Run |
Displays the Run Report dialog box so you can run a report of this type specifically for your environment and adds the generated report to the table in the content pane. |
Define Report of This Type |
This option is available only for Cisco-supplied report types. Displays the Define Report dialog box so you can create a report of this type specifically for your environment, and adds the newly defined report to the navigation tree. |
Delete |
Deletes a user-defined report. |
Move |
Moves a user-defined report. |
Properties |
For a standard report type, displays the Reports Type Properties window which includes a brief description of the report and enables you to generate the report. For more information on the Reports Type Properties window, see Viewing Report Properties. For a user-defined report, displays the Edit report dialog box so that you can modify the currently defined settings and generate the report. |
Content Pane Reports
Table 11-11 describes the options available when you right-click a report in the content pane.
|
|
|
|---|---|
View As |
Displays the report in the selected format: • • • • • The default option, HTML, is displayed in bold font. For more information on viewing reports, see Viewing and Saving Reports. |
Rename |
Renames the selected report. |
Share or Unshare |
Shares the selected reports or limits them to your viewing only. The option toggles between Share and Unshare, as appropriate for the selected reports. By default, the Share and Unshare options are available only to users with administrator access. These options are available to other users only if an administrator has enabled sharing in Prime Network Administration. For more information, see the Cisco Prime Network 3.10 Administrator Guide. |
Delete Report |
Deletes the selected reports. |
Cancel |
This option is displayed only while the selected report is being generated or queued. Cancels the report that is being generated or is queued. |
Show Only Selected Rows |
Displays only the rows that you select. |
Show All Rows |
Displays all table rows that meet the current filtering criteria. |
Properties |
Displays the Reports Type Properties window, which includes a brief description of the report and enables you to edit its name and description. |
Report Categories
Prime Network Vision provides reports related to:
•![]() Events—See Events Reports.
Events—See Events Reports.
•![]() Inventory—See Inventory Reports.
Inventory—See Inventory Reports.
•![]() Network services—See Network Service Reports.
Network services—See Network Service Reports.
Events Reports
Prime Network Vision provides the following standard event report types:
•![]() General report types, as described in Table 11-12.
General report types, as described in Table 11-12.
•![]() Detailed network event reports, as described in Table 11-13.
Detailed network event reports, as described in Table 11-13.
•![]() Detailed non-network event reports, as described in Table 11-14.
Detailed non-network event reports, as described in Table 11-14.
Inventory Reports
Table 11-15 describes the standard inventory report types provided by Prime Network Vision and the data source.
Network Service Reports
Table 11-16 describes the standard network service report types provided by Prime Network Vision and the data source.
Generating Reports
You can generate reports in any of the following ways:
•![]() Generating Reports from Report Manager
Generating Reports from Report Manager
•![]() Generating Reports from the Reports Menu
Generating Reports from the Reports Menu
•![]() Generating Reports from Prime Network Vision
Generating Reports from Prime Network Vision
You can generate reports only for devices that are within your scope.
Note ![]() Report Manager generates reports up to 150 MB in size. If you generate a report that exceeds this limit:
Report Manager generates reports up to 150 MB in size. If you generate a report that exceeds this limit:
•![]() Report Manager window displays Failed in the State column.
Report Manager window displays Failed in the State column.
•![]() An error message is entered in the log stating that the report failed because the resulting output is too large.
An error message is entered in the log stating that the report failed because the resulting output is too large.
To run the report successfully, enter more specific report criteria or limit the time period covered by the report.
Database Load and Report Generation
If you generate reports while Prime Network Vision is working under a database load, the reports move to a Load mode which is indicated by a system event. While Prime Network Vision is in Load mode, the reports currently running are cancelled and new reports are queued.
After Prime Network Vision returns to normal operation and is no longer operating under a load, a new system event is generated and the queued reports start running.
Report Generation Failure
If a report fails to generate successfully, the State column contains the word Failed. Click Failed to view the reason for the failure. A window is displayed with the cause of the failure, such as The disk space allocated for report storage is full or AVM 84 was restarted while the report was running.
Report Generation Canceled
If a report is canceled before it completes, the State column contains the word Canceled. Click Canceled to view the reason for the cancellation. A window is displayed with the cause of the cancellation, such as The report was canceled by user <user-name> or The report was canceled by the system to prevent system overload.
Generating Reports from Report Manager
Prime Network Vision provides three report categories as described in Report Categories. The information that you need to provide when generating a report depends on the report type. The following topics describe the information required to generate each report type:
•![]() Generating Network Service Reports
Generating Network Service Reports
Note ![]() You can generate reports only for devices that are within your scope.
You can generate reports only for devices that are within your scope.
Generating Events Reports
To generate an events report using Report Manager:
Step 1 ![]() In Prime Network Vision, Prime Network Events, or Prime Network Administration, choose Reports > Report Manager.
In Prime Network Vision, Prime Network Events, or Prime Network Administration, choose Reports > Report Manager.
Step 2 ![]() In the Report Manager window, choose Events Reports > report-type.
In the Report Manager window, choose Events Reports > report-type.
For information on the reports available for events, see Table 11-12.
Step 3 ![]() Generate the report by right-clicking the report type, then choosing Run.
Generate the report by right-clicking the report type, then choosing Run.
The Run Report dialog box is displayed. An example is shown in Figure 11-4. The fields displayed in the Run Report dialog box vary depending on the type of report.
Figure 11-4 Events Report - Run Report Dialog Box
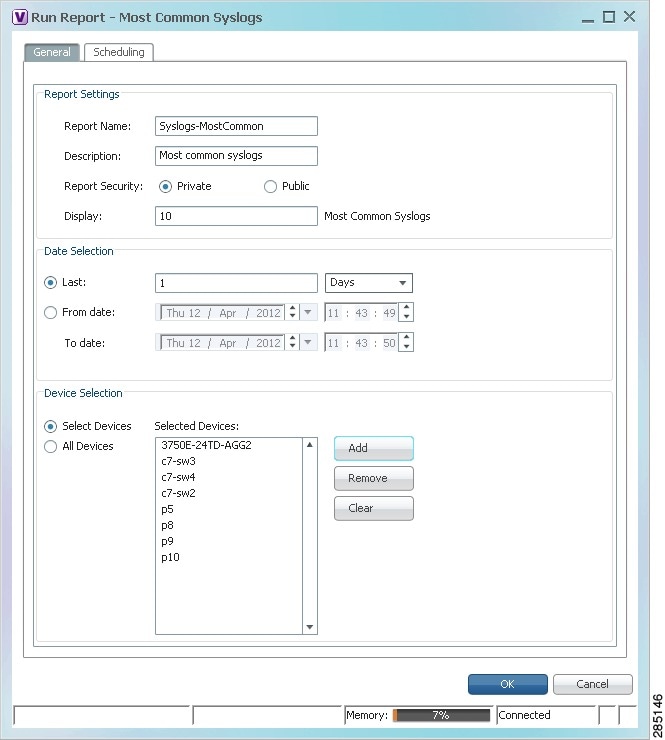
Step 4 ![]() In the Run Report dialog box, specify the report settings as follows:
In the Run Report dialog box, specify the report settings as follows:
•![]() For standard events reports, use the information in Table 11-17.
For standard events reports, use the information in Table 11-17.
•![]() For detailed network reports, use the information in Table 11-18.
For detailed network reports, use the information in Table 11-18.
•![]() For detailed non-network reports, use the information in Table 11-19.
For detailed non-network reports, use the information in Table 11-19.
|
|
|
|---|---|
|
|
|
Report Name |
Enter a unique name for the report, from 1 to 150 characters in length. Report names cannot include the following characters: ;?<>/:\"#*|. |
Description |
Enter a brief description of the report. |
Report Security |
This field is displayed only if report sharing is enabled in Prime Network Administration. Indicate the level of security for the report by clicking the appropriate option: • • Note |
Display n |
This field does not appear for all reports. Enter the number of items to be displayed in the generated report. |
Data Source |
This field does not appear for all reports. Select the source of information to use for the report: Fault Database or Event Archive. |
Include pie charts in report output |
This field does not appear for all reports. Check the check box to view pie charts in the report with the standard numerical output. |
|
|
|
Last |
Specify the length of time before the current date and time, and the unit of measure: seconds, minutes, hours, days, weeks, or months. |
From Date To Date |
Specify the date range for the report: 1. 2. 3. 4. 5. |
|
|
|
Select Devices |
Note • • Select devices to include in the report: 1. 2. 3. – – 4. 5. |
All Devices |
This field does not appear for all reports. Click All Devices to include all devices in your scope in the report. |
|
|
|
Intervals |
In the Grouped by drop-down list, choose the unit of time to use for tracking the trend: Seconds, Minutes, Hours, or Days. |
Severity |
Check the check boxes of the syslog message severities to be included in the report: All, Critical, Major, Minor, Warning, Cleared, Information, and Indeterminate. |
Syslog Messages |
Specify the syslog messages to be included in the report: • • To find syslog messages that match a string, enter the string in the Find field. The list of syslog messages is automatically updated to include only those messages that contain the string you enter. Click the Sort Order button to sort the syslog messages in alphabetic or reverse alphabetic order. |
|
|
|
|---|---|
|
|
|
Report Name |
Enter a unique name for the report, from 1 to 150 characters in length. Report names cannot include the following characters: ;?<>/:\"#*|. |
Description |
Enter a brief description of the report. |
Report Security |
This field is displayed only if report sharing is enabled in Prime Network Administration. Indicate the level of security for the report by clicking the appropriate option: • • Note |
Data Source |
This field does not appear for all reports. Select the source of information to use for the report: Fault Database or Event Archive. |
|
|
|
Last |
Specify the length of time before the current date and time, and the unit of measure: seconds, minutes, hours, days, weeks, or months. |
From Date To Date |
Specify the date range for the report: 1. 2. 3. 4. 5. |
|
|
|
Select Devices |
Note • • • Select devices to include in the report: 1. 2. 3. – – 4. 5. |
All Devices |
This field does not appear for all reports. Click All Devices to include all devices in your scope in the report. |
|
|
|
Severity |
This field does not appear for all reports. Check the check boxes of the syslog message severities to be included in the report: All, Critical, Major, Minor, Warning, Cleared, Information, and Indeterminate. |
|
|
|
Description Contains |
Enter the string that the service event must contain to be included in the report. |
|
|
|
Syslogs Description |
This field is displayed if you choose Fault DB for the data source. In the Description Contains field, enter the string that the syslog must contain to be included in the report. |
Syslogs Raw Data |
This field is displayed if you choose Event Archive for the data source. In the Raw Data Contains field, enter the string that the syslog raw data must contain to be included in the report. |
|
|
|
Traps Detailed Description |
In the Description Contains field, enter the string that the trap must contain to be included in the report. |
Long Description |
This option is enabled if you choose Fault DB for the data source. 1. 2. |
SNMP Version |
Specify the SNMP versions to include in the report: All, 1, 2, or 3. |
Generic |
This option is enabled if you choose Event Archive for the data source. Specify the generic traps to include in the report: 1. – – – – – – – – 2. The Vendor Specific field accepts a maximum of 125 digits. |
|
|
|
|---|---|
|
|
|
Report Name |
Enter a unique name for the report, from 1 to 150 characters in length. Report names cannot include the following characters: ;?<>/:\"#*|. |
Description |
Enter a brief description of the report. |
Report Security |
This field is displayed only if report sharing is enabled in Prime Network Administration. Indicate the level of security for the report by clicking the appropriate option: • • Note |
|
|
|
Last |
Specify the length of time before the current date and time, and the unit of measure: seconds, minutes, hours, days, weeks, or months. |
From Date To Date |
Specify the date range for the report: 1. 2. 3. 4. 5. |
|
|
|
Severity |
Check the check boxes of the syslog message severities to be included in the report: All, Critical, Major, Minor, Warning, Cleared, Information, and Indeterminate. |
|
|
|
Description Contains |
Enter the string that the event must contain to be included in the report. |
Command Name Contains |
Enter the string that the command name must contain to be included in the report. |
Originator IP Contains |
Enter the string that the originating IP address must contain to be included in the report. |
User Name Contains |
Enter the string that the username must contain to be included in the report. |
|
|
|
Description Contains |
Enter the string that the trap must contain to be included in the report. |
User Name Contains |
Enter the string that the username must contain to be included in the report. |
Status |
Choose the statuses to be included in the report: All, Unknown, Configuring, Success, and Fail. |
|
|
|
Description Contains |
Enter the string that the event must contain to be included in the report. |
Originator IP Contains |
Enter the string that the originating IP address must contain to be included in the report. |
User Name Contains |
Enter the string that the username must contain to be included in the report. |
|
|
|
Description Contains |
Enter the string that the event must contain to be included in the report. |
Step 5 ![]() To schedule a report to run immediately or at a later point in time, click the Scheduling tab. For more information, see Scheduling Reports.
To schedule a report to run immediately or at a later point in time, click the Scheduling tab. For more information, see Scheduling Reports.
Step 6 ![]() Click OK.
Click OK.
The report appears in the table in the content pane with a state of Running, if the report is scheduled to run immediately, or Scheduled, if the report is scheduled to run at a later point in time. When the report is complete, the state changes to Done.
You can view the reports when the state is Done. Occasionally, some report formats require additional time for generation. If so, a progress bar is displayed, indicating that the report is being created and will be available soon.
If the report exceeds 150 MB, the state changes to Failed and an error message is written to the log. We recommend running the report with more specific criteria or a shorter time period to avoid this situation.
If no data is found for the report, the report states that no results were found.
Generating Inventory Reports
To generate an inventory report using Report Manager:
Step 1 ![]() In Prime Network Vision, Prime Network Events, or Prime Network Administration, choose Reports > Report Manager.
In Prime Network Vision, Prime Network Events, or Prime Network Administration, choose Reports > Report Manager.
Step 2 ![]() In the Report Manager window, choose Inventory Reports > report-type.
In the Report Manager window, choose Inventory Reports > report-type.
For information on the standard reports available for inventory, see Table 11-15.
Step 3 ![]() Right-click the report type, then choose Run.
Right-click the report type, then choose Run.
The Run Report dialog box is displayed as shown in Figure 11-5.
Figure 11-5 Inventory Report - Run Report Dialog Box
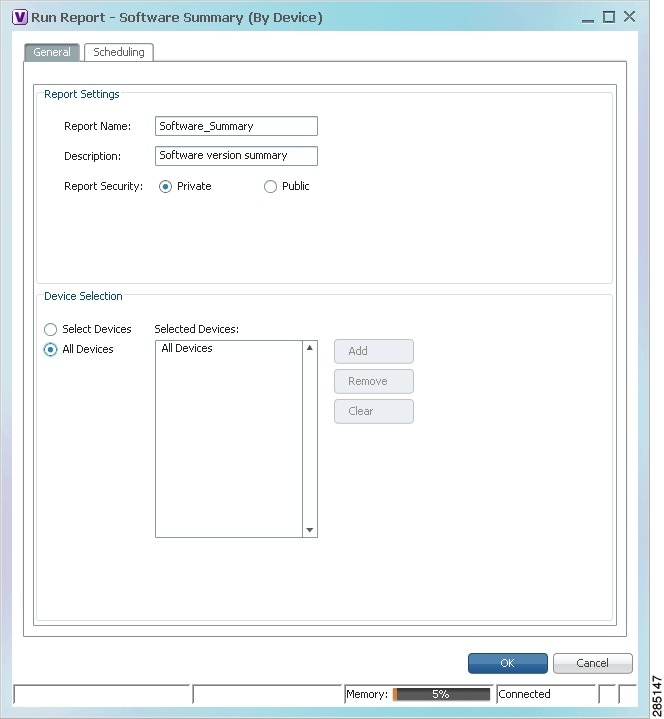
Step 4 ![]() Enter the required information in the Run Report dialog box as described in Table 11-20.
Enter the required information in the Run Report dialog box as described in Table 11-20.
|
|
|
|---|---|
|
|
|
Report Name |
Enter a unique name for the report, from 1 to 150 characters in length. Report names cannot include the following characters: ;?<>/:\"#*|. |
Description |
Enter a brief description of the report. |
Report Security |
This field is displayed only if report sharing is enabled in Prime Network Administration. Indicate the level of security for the report by clicking the appropriate option: • • Note |
|
|
|
Select Devices |
Note Select devices to include in the report: 1. 2. 3. – – 4. 5. |
All devices |
Click All Devices to include all devices in your scope in the report. |
Step 5 ![]() To schedule a report to run immediately or at a later point in time, click the Scheduling tab. For more information, see Scheduling Reports.
To schedule a report to run immediately or at a later point in time, click the Scheduling tab. For more information, see Scheduling Reports.
Step 6 ![]() Click OK.
Click OK.
The report appears in the table in the content pane with a state of Running, if the report is scheduled to run immediately, or Scheduled, if the report is scheduled to run at a later point in time. When the report is complete, the state changes to Done.
You can view the reports when the state is Done. Occasionally, some report formats require additional time for generation. If so, a progress bar is displayed, indicating that the report is being created and will be available soon.
If the report exceeds 150 MB, the state changes to Failed and an error message is written to the log. We recommend running the report with more specific criteria or a shorter time period to avoid this situation.
If no data is found for the report, the report states that no results were found.
Generating Network Service Reports
If you generate a detailed network service report on a large-scale setup, a message is displayed in the Run Report dialog box recommending that you apply a filter to limit the size of the report.
To generate a network service report using Report Manager:
Step 1 ![]() In Prime Network Vision, Prime Network Events, or Prime Network Administration, choose Reports > Report Manager.
In Prime Network Vision, Prime Network Events, or Prime Network Administration, choose Reports > Report Manager.
Step 2 ![]() In the Report Manager window, choose Network Service Reports > report-type.
In the Report Manager window, choose Network Service Reports > report-type.
For information on the standard reports available for network services, see Table 11-16.
Step 3 ![]() Right-click the report type, then choose Run.
Right-click the report type, then choose Run.
The Run Report dialog box is displayed as shown in Figure 11-6.
Figure 11-6 Network Service Report - Run Report Dialog Box
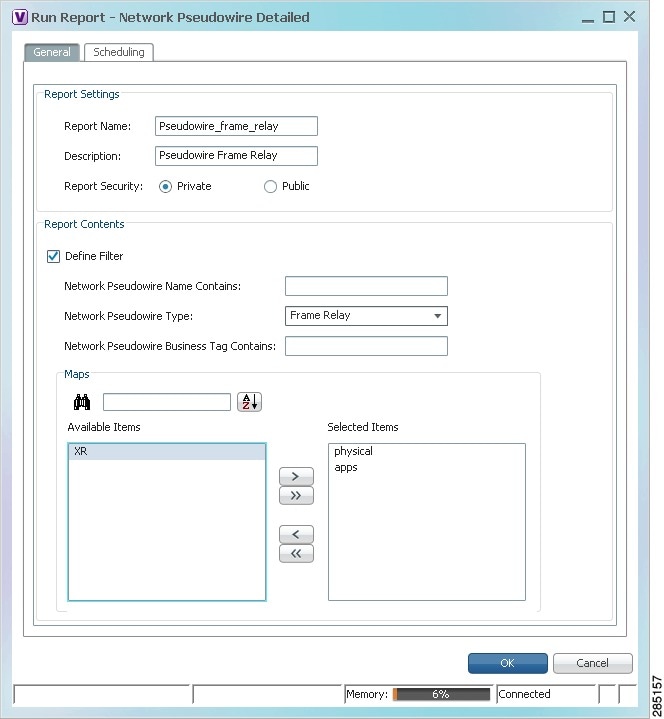
Step 4 ![]() Enter the required information the Run Report dialog box as described in Table 11-21.
Enter the required information the Run Report dialog box as described in Table 11-21.
|
|
|
|---|---|
|
|
|
Report Name |
Enter a unique name for the report, from 1 to 150 characters in length. Report names cannot include the following characters: ;?<>/:\"#*|. |
Description |
Enter a brief description of the report. |
Report Security |
This field is displayed only if report sharing is enabled in Prime Network Administration. Indicate the level of security for the report by clicking the appropriate option: • • Note |
|
|
|
Define Filter |
Check the Define Filter check box to enter criteria that must be matched for inclusion in the report. You can specify match criteria in any or all of the following fields. |
Ethernet Service Name Contains |
Enter a string that must appear in the Ethernet service name for the Ethernet service to be included in the report. |
EVC Name Contains |
Enter a string that must appear in the EVC name for the EVC to be included in the report. |
Ethernet Service Business Tag Contains |
Enter a string that must appear in the Ethernet service business tag for the Ethernet service to be included in the report. |
EVC Business Tag Contains |
Enter a string that must appear in the EVC business tag for the EVC to be included in the report. |
Maps |
Specify the maps to include in the report: • • To find maps that match a string, enter the string in the Find field. The list of maps is automatically updated to include only those maps that contain the string you enter. Click the Sort Order button to sort the maps alphabetically or in reverse alphabetic order. |
|
|
|
Define Filter |
Check the Define Filter check box to enter criteria that must be matched for inclusion in the report. You can specify match criteria in any or all of the following fields. |
Network Pseudowire Name Contains |
Enter a string that must appear in the network pseudowire name for the pseudowire to be included in the report. |
Network Pseudowire Type |
In the drop-down list, choose the type of network pseudowire to be included in the report. |
Network Pseudowire Business Tag Contains |
Enter a string that must appear in the network pseudowire business tag for the pseudowire to be included in the report. |
Maps |
Specify the maps to include in the report: • • To find maps that match a string, enter the string in the Find field. The list of maps is automatically updated to include only those maps that contain the string you enter. Click the Sort Order button to sort the maps alphabetically or in reverse alphabetic order. |
|
|
|
Define Filter |
Check the Define Filter check box to enter criteria that must be matched for inclusion in the report. You can specify match criteria in any or all of the following fields. |
VPLS Name Contains |
Enter a string that must appear in the VPLS name for the VPLS or H-VPLS to be included in the report. |
VPLS Business Tag Contains |
Enter a string that must appear in the VPLS business tag for the VPLS or H-VPLS to be included in the report. |
Maps |
Specify the maps to be included in the report: • • To find maps that match a string, enter the string in the Find field. The list of maps is automatically updated to include only those maps that contain the string you enter. Click the Sort Order button to sort the maps alphabetically or in reverse alphabetic order. |
Step 5 ![]() To schedule a report to run immediately or at a later point in time, click the Scheduling tab. For more information, see Scheduling Reports.
To schedule a report to run immediately or at a later point in time, click the Scheduling tab. For more information, see Scheduling Reports.
Step 6 ![]() Click OK.
Click OK.
The report appears in the table in the content pane with a state of Running, if the report is scheduled to run immediately, or Scheduled, if the report is scheduled to run at a later point in time. When the report is complete, the state changes to Done.
You can view the reports when the state is Done. Occasionally, some report formats require additional time for generation. If so, a progress bar is displayed, indicating that the report is being created and will be available soon.
If the report exceeds 150 MB, the state changes to Failed and an error message is written to the log. We recommend running the report with more specific criteria or a shorter time period to avoid this situation.
If no data is found for the report, the report states that no results were found.
Generating Reports from the Reports Menu
To generate reports quickly and without opening the Reports Manager window, choose Reports > Run Report > folder > report-type. The menus include all standard folders and reports, and any folders or reports that you have created. After entering the required information, you can view the report as soon as it is generated or at a later time.
Note ![]() You can generate reports only for devices that are within your scope.
You can generate reports only for devices that are within your scope.
To generate a report from the Reports menu:
Step 1 ![]() Choose Reports > Run Report > folder > report-type where:
Choose Reports > Run Report > folder > report-type where:
•![]() folder is the required folder.
folder is the required folder.
•![]() report-type is the required type of report.
report-type is the required type of report.
Step 2 ![]() In the Run Report dialog box, enter the required information. For more information on the options in the Run Report dialog box, see Generating Reports.
In the Run Report dialog box, enter the required information. For more information on the options in the Run Report dialog box, see Generating Reports.
Step 3 ![]() To schedule a report to run immediately or at a later point in time, click the Scheduling tab. For more information, see Scheduling Reports.
To schedule a report to run immediately or at a later point in time, click the Scheduling tab. For more information, see Scheduling Reports.
Step 4 ![]() Click OK.
Click OK.
Step 5 ![]() In the Running Report dialog box, select the required viewing options:
In the Running Report dialog box, select the required viewing options:
a. ![]() Check the Open Report Manager to monitor status check box to open the Report Manager window so that you can view the report generation process. Uncheck the check box to proceed without opening the Report Manager window.
Check the Open Report Manager to monitor status check box to open the Report Manager window so that you can view the report generation process. Uncheck the check box to proceed without opening the Report Manager window.
b. ![]() Check the View report immediately upon completion check box to view the report as soon as it is generated. If you enable this option, the report is displayed in HTML format as soon as it is complete. Uncheck the check box to view the report at a later time by using Report Manager.
Check the View report immediately upon completion check box to view the report as soon as it is generated. If you enable this option, the report is displayed in HTML format as soon as it is complete. Uncheck the check box to view the report at a later time by using Report Manager.
Step 6 ![]() Click OK.
Click OK.
Depending on your selections in Step 5, the Report Manager window is displayed, the report is displayed, or the report is available for viewing at a later time.
Generating Reports from Prime Network Vision
Prime Network Vision enables you to run reports on selected devices from the map and list views.
Note ![]() You can generate reports only for devices that are within your scope.
You can generate reports only for devices that are within your scope.
To generate a report from Prime Network Vision:
Step 1 ![]() In Prime Network Vision, select the required devices in the map or list view.
In Prime Network Vision, select the required devices in the map or list view.
Step 2 ![]() In the navigation tree or content pane, right-click the selected devices, then choose Run Report > folder > report-type.
In the navigation tree or content pane, right-click the selected devices, then choose Run Report > folder > report-type.
Step 3 ![]() In the Run Report dialog box, enter the required information as described in Generating Reports.
In the Run Report dialog box, enter the required information as described in Generating Reports.
The devices that you select in the navigation pane or content pane are automatically included in the report.
Step 4 ![]() To schedule a report to run immediately or at a later point in time, click the Scheduling tab. For more information, see Scheduling Reports.
To schedule a report to run immediately or at a later point in time, click the Scheduling tab. For more information, see Scheduling Reports.
Step 5 ![]() Click OK.
Click OK.
Step 6 ![]() In the Running Report dialog box, specify the desired viewing options:
In the Running Report dialog box, specify the desired viewing options:
a. ![]() Check the Open Report Manager to monitor status check box to open the Report Manager window so that you can view the report generation process. Uncheck the check box to proceed without opening the Report Manager window.
Check the Open Report Manager to monitor status check box to open the Report Manager window so that you can view the report generation process. Uncheck the check box to proceed without opening the Report Manager window.
b. ![]() Check the View report immediately upon completion check box to view the report as soon as it is generated. If you enable this option, the report is displayed in HTML format as soon as it is complete. Uncheck the check box to view the report at a later time by using Report Manager.
Check the View report immediately upon completion check box to view the report as soon as it is generated. If you enable this option, the report is displayed in HTML format as soon as it is complete. Uncheck the check box to view the report at a later time by using Report Manager.
Depending on your selections in Step 6, the Report Manager window is displayed, the report is displayed, or the report is available for viewing at a later time.
Scheduling Reports
Prime Network allows you to schedule a report to run immediately or at a later point in time.
To schedule a report:
Step 1 ![]() In Prime Network Vision, Prime Network Events, or Prime Network Administration, choose Reports > Report Manager.
In Prime Network Vision, Prime Network Events, or Prime Network Administration, choose Reports > Report Manager.
Step 2 ![]() In the Report Manager window, choose report-category > report-type.
In the Report Manager window, choose report-category > report-type.
For information on the various report categories and report types, see Report Categories.
Step 3 ![]() Right-click the report type, then choose Run.
Right-click the report type, then choose Run.
The Run Report dialog box is displayed.
Step 4 ![]() In the Settings tab, specify the required report criteria. For more information on the options in the Run Report dialog box, see Generating Reports.
In the Settings tab, specify the required report criteria. For more information on the options in the Run Report dialog box, see Generating Reports.
Step 5 ![]() Click the Scheduling tab. By default, the Run Now option is selected and the report is scheduled to run immediately.
Click the Scheduling tab. By default, the Run Now option is selected and the report is scheduled to run immediately.
Step 6 ![]() To schedule the report for a later date/time:
To schedule the report for a later date/time:
a. ![]() Select the Schedule Job radio button. The scheduling options Once and Recurring are enabled.
Select the Schedule Job radio button. The scheduling options Once and Recurring are enabled.
b. ![]() To generate the report once, select the Once radio button and specify the date and time when you want the report to be generated.
To generate the report once, select the Once radio button and specify the date and time when you want the report to be generated.
c. ![]() To generate the report on a recurring basis, select the Recurring radio button and specify the following:
To generate the report on a recurring basis, select the Recurring radio button and specify the following:
–![]() The date and time range for the recurrence.
The date and time range for the recurrence.
–![]() How often you want to generate the report within that time range - every X minutes, daily, weekly, or monthly.
How often you want to generate the report within that time range - every X minutes, daily, weekly, or monthly.
Step 7 ![]() Specify comments, if required and click Schedule. Prime Network creates a report job and executes it according to your scheduling specifications. Go to the Scheduled Jobs page (Tools > Scheduled Jobs), to check that your report job has been created. You can use the Scheduled Jobs page to monitor the job status and to reschedule a job if necessary. You can also clone a scheduled job and edit the report criteria, if required.
Specify comments, if required and click Schedule. Prime Network creates a report job and executes it according to your scheduling specifications. Go to the Scheduled Jobs page (Tools > Scheduled Jobs), to check that your report job has been created. You can use the Scheduled Jobs page to monitor the job status and to reschedule a job if necessary. You can also clone a scheduled job and edit the report criteria, if required.
Managing Reports
Prime Network provides the following options for working with reports:
•![]() Managing the Maximum Number of Concurrent Reports
Managing the Maximum Number of Concurrent Reports
•![]() Moving Reports Between Folders
Moving Reports Between Folders
Managing the Maximum Number of Concurrent Reports
Prime Network enables you to run multiple reports at the same time. When the maximum number of concurrent reports is running, new report requests are queued for generation and have the status Queued (n) where n is the number in the report queue. When a running report moves to a Completed, Failed, or Cancelled state, the first report in the queue starts running.
The maximum number of concurrent reports is set at 5 by default. As the event rate approaches the maximum committed event rate, we recommend that you decrease the maximum number of concurrent reports. The maximum number of concurrent reports is defined in the registry, in reports.xml, under site/reports/reports-setting/reports-running-settings/maxRunningReports.
Note ![]() Changes to the registry should only be carried out with the support of Cisco. For details, contact your Cisco account representative.
Changes to the registry should only be carried out with the support of Cisco. For details, contact your Cisco account representative.
To change the maximum number of concurrent reports, use the runRegTool command (located in ANAHOME/Main) as follows:
./runRegTool.sh -gs 127.0.0.1 set 0.0.0.0
site/reports/reports-setting/reports-running-settings/maxRunningReports value
where value is the new maximum number of concurrent reports.
You do not need to restart any AVMs after entering this command.
For more information on the runRegTool command, see the Cisco Prime Network 3.10 Administrator Guide.
Viewing and Saving Reports
You can view any reports that appear in the Report Manager content pane with the state Done. After viewing a report, you can save it in any of the available formats.
Note ![]() Reports are purged from Prime Network after 90 days by default. This setting can be modified by changing the setting in Prime Network Administration. For more information, see the Cisco Prime Network 3.10 Administrator Guide.
Reports are purged from Prime Network after 90 days by default. This setting can be modified by changing the setting in Prime Network Administration. For more information, see the Cisco Prime Network 3.10 Administrator Guide.
To view and save a report:
Step 1 ![]() Choose Reports > Report Manager.
Choose Reports > Report Manager.
Step 2 ![]() In the navigation pane, locate the required report.
In the navigation pane, locate the required report.
Step 3 ![]() In the content pane, right-click the report, then choose View As > format where format is one of the following:
In the content pane, right-click the report, then choose View As > format where format is one of the following:
•![]() HTML—Displays the report in a browser window. Clicking a column heading in the report sorts the report by that value; clicking the column heading again sorts the data in the reverse order. HTML is the default format.
HTML—Displays the report in a browser window. Clicking a column heading in the report sorts the report by that value; clicking the column heading again sorts the data in the reverse order. HTML is the default format.
•![]() PDF—Displays a PDF version of the report.
PDF—Displays a PDF version of the report.
•![]() CSV—Creates a CSV version of the report that you can either save to a specific location or view using another application. The CSV version contains only the report data; it does not contain the header information, layout, or formatting information that is available in other formats.
CSV—Creates a CSV version of the report that you can either save to a specific location or view using another application. The CSV version contains only the report data; it does not contain the header information, layout, or formatting information that is available in other formats.
•![]() XLS—Creates an XLS version of the report that you can either save to a specific location or view using another application, such as Microsoft Excel.
XLS—Creates an XLS version of the report that you can either save to a specific location or view using another application, such as Microsoft Excel.
•![]() XML—Creates an XML version of the report that you can either save to a specific location or view using an XML editor or viewer.
XML—Creates an XML version of the report that you can either save to a specific location or view using an XML editor or viewer.
Figure 11-7 is an example of the Most Common Daily Events report in HTML format. The data is sorted by the Count column, in descending order.
Figure 11-7 Most Common Daily Events Report Example
Step 4 ![]() Save the report as required.
Save the report as required.
Renaming Reports
You can rename:
•![]() Any report type that you defined.
Any report type that you defined.
•![]() Any generated report that you have access to.
Any generated report that you have access to.
You cannot rename any of the Prime Network standard report types.
Renaming a User-Defined Report Type
Note ![]() When you rename a report type, the new name applies to only those reports that you run after changing the name; it does not change the names of reports that were run prior to changing the name.
When you rename a report type, the new name applies to only those reports that you run after changing the name; it does not change the names of reports that were run prior to changing the name.
To rename a user-defined report type:
Step 1 ![]() In the navigation tree, select the user-defined report type.
In the navigation tree, select the user-defined report type.
Step 2 ![]() Right-click the report type, then choose Properties.
Right-click the report type, then choose Properties.
Step 3 ![]() In the Edit dialog box, enter a new name for the report type in the Report Name field, using the following conventions:
In the Edit dialog box, enter a new name for the report type in the Report Name field, using the following conventions:
•![]() The name can contain 1 to 150 characters.
The name can contain 1 to 150 characters.
•![]() The name cannot include the following characters: ;?<>/:\"#*|.
The name cannot include the following characters: ;?<>/:\"#*|.
Step 4 ![]() Click OK.
Click OK.
The navigation pane is refreshed and the report type is displayed with the new name.
Renaming a Generated Report
To rename a report:
Step 1 ![]() Choose Reports > Report Manager.
Choose Reports > Report Manager.
Step 2 ![]() In the content pane, right-click the report that you want to rename, then choose Rename or Properties.
In the content pane, right-click the report that you want to rename, then choose Rename or Properties.
Step 3 ![]() In the Name field, enter the new name for the report, using the following conventions:
In the Name field, enter the new name for the report, using the following conventions:
•![]() The name can contain 1 to 150 characters.
The name can contain 1 to 150 characters.
•![]() The name cannot include the following characters: ;?<>/:\"#*|.
The name cannot include the following characters: ;?<>/:\"#*|.
Step 4 ![]() Click OK.
Click OK.
The content pane is refreshed and the report is displayed with the new name.
Sharing Reports
Prime Network enables you to share reports that you generate with other users, or limit access to a report to only you and the administrator.
Note ![]() You can share reports with others only if sharing is enabled in Prime Network Administration. For more information, see the Cisco Prime Network 3.10 Administrator Guide.
You can share reports with others only if sharing is enabled in Prime Network Administration. For more information, see the Cisco Prime Network 3.10 Administrator Guide.
Sharing a Report
To share access to a report that you generated:
Step 1 ![]() Choose Reports > Report Manager.
Choose Reports > Report Manager.
Step 2 ![]() Locate the required report.
Locate the required report.
Step 3 ![]() In the content pane, right-click the report that you want to share, then choose Share.
In the content pane, right-click the report that you want to share, then choose Share.
The report is available to all system users for viewing and using.
Limiting Access to a Report
To limit access to a report that you generated and subsequently shared:
Step 1 ![]() Choose Reports > Report Manager.
Choose Reports > Report Manager.
Step 2 ![]() Locate the required report.
Locate the required report.
Step 3 ![]() In the content pane, right-click the report that you want to limit access to, then choose Unshare.
In the content pane, right-click the report that you want to limit access to, then choose Unshare.
The report can be viewed and used by only you and the administrator.
Moving Reports Between Folders
You can move a report type that you have defined from the current folder to another folder in the navigation tree.
Note ![]() You cannot move a standard report type from one folder to another.
You cannot move a standard report type from one folder to another.
To move a report type to a new folder:
Step 1 ![]() Choose Reports > Report Manager.
Choose Reports > Report Manager.
Step 2 ![]() In the navigation tree, select the required report that you have defined.
In the navigation tree, select the required report that you have defined.
Step 3 ![]() Right-click the report, then choose Move.
Right-click the report, then choose Move.
Step 4 ![]() In the Move To dialog box, select the folder to which you want to move the report.
In the Move To dialog box, select the folder to which you want to move the report.
Step 5 ![]() Click OK.
Click OK.
The Report Manager window is refreshed and the report appears in the specified folder.
Deleting Reports
You can delete reports to which you have access.
To delete a report:
Step 1 ![]() Choose Reports > Report Manager.
Choose Reports > Report Manager.
Step 2 ![]() Locate the required report.
Locate the required report.
Step 3 ![]() In the content pane, select the required report.
In the content pane, select the required report.
Step 4 ![]() Right-click the report, then choose Delete Report.
Right-click the report, then choose Delete Report.
Step 5 ![]() In the Delete Report confirmation window, click Yes to confirm deletion.
In the Delete Report confirmation window, click Yes to confirm deletion.
The Report Manager window is refreshed and the deleted report no longer appears.
Viewing Report Properties
The Report Properties dialog box enables you to view the report settings and to modify some of them.
To view report properties, and optionally change the name, description, or access:
Step 1 ![]() Choose Reports > Report Manager.
Choose Reports > Report Manager.
Step 2 ![]() Locate the required report.
Locate the required report.
Step 3 ![]() In the content pane, right-click the selected report, then choose Properties.
In the content pane, right-click the selected report, then choose Properties.
The Report Properties dialog box is displayed, as shown in Figure 11-8.
Figure 11-8 Report Properties Dialog Box
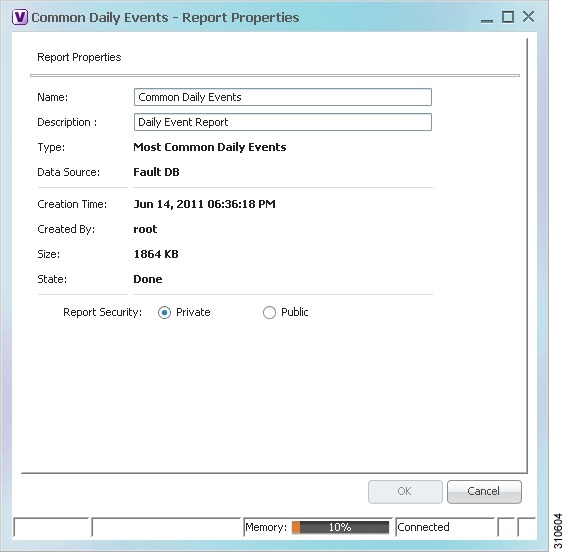
Step 4 ![]() Change the information in the following fields as required:
Change the information in the following fields as required:
•![]() Name
Name
•![]() Description
Description
•![]() Report Security
Report Security
Step 5 ![]() Click OK.
Click OK.
Defining Report Types
You can modify any of the report types provided by Prime Network so that it better suits your needs and environment. This is extremely beneficial if you generate a particular type of report for specific devices or events on a regular basis.
To define a report type:
Step 1 ![]() Choose Reports > Report Manager.
Choose Reports > Report Manager.
Step 2 ![]() In the navigation pane, right-click the existing report type, then choose Define Report of This Type.
In the navigation pane, right-click the existing report type, then choose Define Report of This Type.
Step 3 ![]() In the Define report of type dialog box, specify the options using the information in Generating Reports.
In the Define report of type dialog box, specify the options using the information in Generating Reports.
Step 4 ![]() In the Location field, use the specified reports folder or click Browse to select a different folder.
In the Location field, use the specified reports folder or click Browse to select a different folder.
Step 5 ![]() Click OK.
Click OK.
The newly defined report type appears in the navigation tree in the specified folder.
Managing Report Folders
Prime Network provides the following options for working with report folders:
•![]() Viewing Folder and Report Type Properties
Viewing Folder and Report Type Properties
Creating Folders
Prime Network enables you to create additional report folders in Report Manager.
To create a report folder:
Step 1 ![]() Choose Reports > Report Manager.
Choose Reports > Report Manager.
Step 2 ![]() Select a folder in which to place the new folder.
Select a folder in which to place the new folder.
Step 3 ![]() Right-click the folder, then choose New Folder.
Right-click the folder, then choose New Folder.
Step 4 ![]() In the New Folder dialog box, enter a name for the folder.
In the New Folder dialog box, enter a name for the folder.
Step 5 ![]() Click OK.
Click OK.
The navigation pane is refreshed and the new folder is displayed.
Step 6 ![]() To move the new folder to another folder, or to the top level in the folder hierarchy:
To move the new folder to another folder, or to the top level in the folder hierarchy:
a. ![]() Right-click the folder, then choose Move.
Right-click the folder, then choose Move.
b. ![]() In the Move To dialog box, select the location where you want the folder to reside.
In the Move To dialog box, select the location where you want the folder to reside.
c. ![]() Click OK.
Click OK.
The folder is displayed in the new location.
Moving Folders
Prime Network enables you to move folders that you have created in Report Manager. You cannot move the Events Reports, Inventory Reports, or Network Service Reports folder.
To move a report folder:
Step 1 ![]() Choose Reports > Report Manager.
Choose Reports > Report Manager.
Step 2 ![]() Right-click the folder, then choose Move.
Right-click the folder, then choose Move.
Step 3 ![]() In the Move To dialog box, select the location where you want the folder to reside.
In the Move To dialog box, select the location where you want the folder to reside.
Step 4 ![]() Click OK.
Click OK.
The navigation pane is refreshed and the folder is displayed in the new location.
Renaming Folders
Prime Network enables you to rename folders that you have created in Report Manager. You cannot:
•![]() Rename a folder that resides at the highest level in the hierarchy, such as the Events Reports, Inventory Reports, or Network Service Reports folder.
Rename a folder that resides at the highest level in the hierarchy, such as the Events Reports, Inventory Reports, or Network Service Reports folder.
•![]() Use the same name for different folders that reside at the same level in the hierarchy.
Use the same name for different folders that reside at the same level in the hierarchy.
To rename a report folder:
Step 1 ![]() Choose Reports > Report Manager.
Choose Reports > Report Manager.
Step 2 ![]() Right-click the folder, then choose Rename.
Right-click the folder, then choose Rename.
Step 3 ![]() In the Rename Folder dialog box, enter the new name for the folder.
In the Rename Folder dialog box, enter the new name for the folder.
Step 4 ![]() Click OK.
Click OK.
The navigation pane is refreshed and the folder is displayed with the new name.
Deleting Folders
You can delete folders that you have created in Report Manager if they are empty. You cannot delete the following folders:
•![]() Events Reports
Events Reports
•![]() Detailed Network Events
Detailed Network Events
•![]() Detailed Non-Network Events
Detailed Non-Network Events
•![]() Inventory Reports
Inventory Reports
•![]() Network Service Reports
Network Service Reports
•![]() User-created folders that contain other folders or report types
User-created folders that contain other folders or report types
To delete a report folder:
Step 1 ![]() Choose Reports > Report Manager.
Choose Reports > Report Manager.
Step 2 ![]() Right-click the folder, then choose Delete.
Right-click the folder, then choose Delete.
Step 3 ![]() In the Confirm Folder Delete dialog box, click Yes to confirm the deletion.
In the Confirm Folder Delete dialog box, click Yes to confirm the deletion.
The navigation pane is refreshed and the folder no longer appears.
Viewing Folder and Report Type Properties
Viewing Report Folder Properties
The Report Properties window enables you to view report properties and to add folders.
To view report properties:
Step 1 ![]() Choose Reports > Report Manager.
Choose Reports > Report Manager.
Step 2 ![]() In the navigation pane, right-click the required folder, then choose Properties.
In the navigation pane, right-click the required folder, then choose Properties.
The Folder Properties window is displayed, as shown in Figure 11-9.
Figure 11-9 Folder Properties
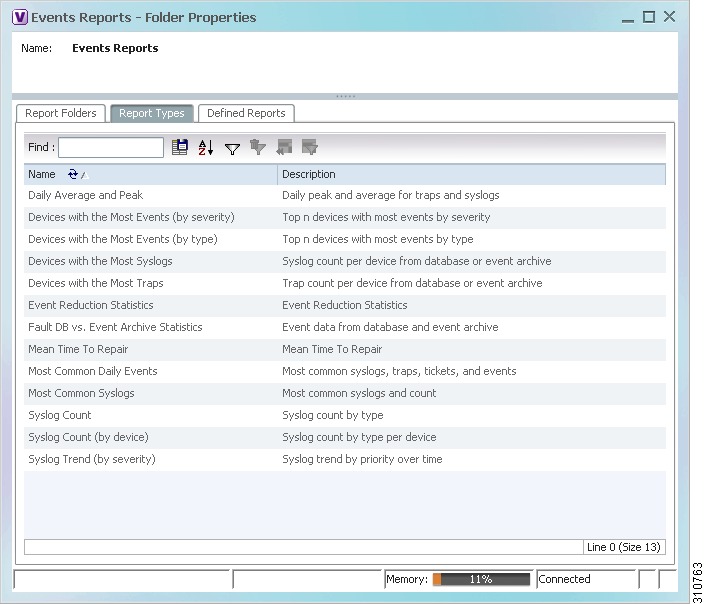
Table 11-22 describes the information that is displayed in each tab, depending on the folder's contents.
Viewing Report Type Properties
To view report type properties:
Step 1 ![]() In the navigation pane, right-click the required report type, then choose Properties.
In the navigation pane, right-click the required report type, then choose Properties.
The information that is displayed depends on whether the report type is one that you defined or one provided by Prime Network:
•![]() Prime Network-provided report type—The Report Type Properties window is displayed with the report name and description. Click Run to generate the report.
Prime Network-provided report type—The Report Type Properties window is displayed with the report name and description. Click Run to generate the report.
•![]() User-defined report type—The Edit dialog box is displayed with all settings specified for the report type. You can modify the settings or leave them as they are.
User-defined report type—The Edit dialog box is displayed with all settings specified for the report type. You can modify the settings or leave them as they are.
Step 2 ![]() Click Close or the upper right corner to close the window.
Click Close or the upper right corner to close the window.
 Feedback