- Title Page
- Table of Contents
- Preface
- Setting Up Devices and Using the GUI Clients
- Working with the Cisco Prime Network Vision Client
- Viewing and Managing NE Properties
- Device Configurations and Software Images
- Working with Prime Network Vision Maps
- Working with Links
- Labeling NEs Using Business Tags
- Working with the Prime Network Events
- Tracking Faults Using Prime Network Events
- Working with Tickets in Cisco Prime Network Vision
- Working with Reports
- Using Cisco PathTracer to Diagnose Problems
- Monitoring Carrier Ethernet Services
- Monitoring Carrier Grade NAT Properties
- Monitoring DWDM Properties
- Monitoring Ethernet Operations, Administration,and Maintenance Tool Properties
- Monitoring Y.1731 IPSLA Configuration
- IPv6 and IPv6 VPN over MPLS
- Monitoring MPLS Services
- Viewing IP and MPLS Multicast Configurations
- Monitoring MToP Services
- Viewing and Managing SBCs
- Monitoring AAA Configurations
- Monitoring IP Pools
- Monitoring BNG Configurations
- Monitoring Mobile Technologies
- Monitoring Data Center Configurations
- Icon and Button Reference
- Glossary
- Index
Working with Tickets in Cisco Prime Network Vision
These topics describe how to work with tickets in Prime Network Vision:
•![]() User Roles Required to Work with Tickets in Prime Network Vision
User Roles Required to Work with Tickets in Prime Network Vision
•![]() Viewing Tickets and Network Events for Elements in a Map
Viewing Tickets and Network Events for Elements in a Map
•![]() Impact Analysis in Prime Network
Impact Analysis in Prime Network
What are Tickets?
A ticket represents the complete hierarchy of correlated alarms representing a single specific fault scenario. A ticket points to the root cause alarm that is the top-most alarm in the correlation hierarchy. Examples of alarms are Link Down, Device Unreachable, or Module Out. Some event types are capable of creating tickets. When an event is generated, it is correlated to an existing event, which is correlated to a ticket. If there is no existing ticket, a new ticket is created.
Prime Network identifies the relationship between a root cause alarm and its consequent alarms. It automatically correlates the consequent alarms as children of the root alarm. The ticket pane displays the ticket (the root cause alarm), the aggregated severity of the ticket, and the severity of the root cause alarm. The root cause alarm severity is the top-most severity of its contained alarms. In addition, the ticket pane displays the time at which the original event was detected, the ticket creation time, and a description of the event that caused the ticket creation.
User Roles Required to Work with Tickets in Prime Network Vision
This topic identifies the roles that are required to work with tickets in Prime Network Vision. Prime Network determines whether you are authorized to perform a task as follows:
•![]() For GUI-based tasks (tasks that do not affect elements), authorization is based on the default permission that is assigned to your user account.
For GUI-based tasks (tasks that do not affect elements), authorization is based on the default permission that is assigned to your user account.
•![]() For element-based tasks (tasks that do affect elements), authorization is based on the default permission that is assigned to your account. That is, whether the element is in one of your assigned scopes and whether you meet the minimum security level for that scope.
For element-based tasks (tasks that do affect elements), authorization is based on the default permission that is assigned to your account. That is, whether the element is in one of your assigned scopes and whether you meet the minimum security level for that scope.
For more information on user authorization, see the topic on device scopes in the Cisco Prime Network 3.10 Administrator Guide.
The following conditions apply when working with tickets in Prime Network Vision:
•![]() If an element that is outside of your scope is the root cause of a ticket that affects an element in your scope, you can view the ticket in Prime Network Vision, but you will not be able to:
If an element that is outside of your scope is the root cause of a ticket that affects an element in your scope, you can view the ticket in Prime Network Vision, but you will not be able to:
–![]() View inventory by clicking the Location hyperlink.
View inventory by clicking the Location hyperlink.
–![]() Acknowledge, clear, or remove the ticket.
Acknowledge, clear, or remove the ticket.
•![]() You can acknowledge, clear, remove, or add notes for a ticket only if you have OperatorPlus or higher permission for the element that holds the root alarm for that ticket.
You can acknowledge, clear, remove, or add notes for a ticket only if you have OperatorPlus or higher permission for the element that holds the root alarm for that ticket.
•![]() If the source or contained sources of the ticket are not in your scope, you cannot view the ticket in the ticket table, view ticket properties, or perform actions on the ticket.
If the source or contained sources of the ticket are not in your scope, you cannot view the ticket in the ticket table, view ticket properties, or perform actions on the ticket.
•![]() If the ticket contains a source that is in your scope, but the source is not the root cause, you can view the ticket in the ticket table and view ticket properties, but you cannot perform actions on the ticket.
If the ticket contains a source that is in your scope, but the source is not the root cause, you can view the ticket in the ticket table and view ticket properties, but you cannot perform actions on the ticket.
•![]() If the source of the ticket is in your scope, you can view the ticket in the ticket table, view ticket properties, filter tickets, and perform actions on the ticket.
If the source of the ticket is in your scope, you can view the ticket in the ticket table, view ticket properties, filter tickets, and perform actions on the ticket.
•![]() By default, users with the Administrator role have access to all managed elements and can perform any action on tickets. To change the Administrator user scope, see the topic on device scopes in the Cisco Prime Network 3.10 Administrator Guide.
By default, users with the Administrator role have access to all managed elements and can perform any action on tickets. To change the Administrator user scope, see the topic on device scopes in the Cisco Prime Network 3.10 Administrator Guide.
Table 10-1 identifies the roles required to perform the high level tasks:
|
|
|
|
|
|
|
|---|---|---|---|---|---|
Acknowledge tickets |
— |
— |
X1 |
X |
X |
Add notes to a ticket |
— |
— |
X1 |
X |
X |
Clear and remove tickets |
— |
— |
X1 |
X |
X |
Clear tickets |
— |
— |
X1 |
X |
X |
Filter tickets |
X |
X |
X |
X |
X |
Find affected elements |
X |
X |
X |
X |
X |
Remove tickets |
— |
— |
X1 |
X |
X |
View ticket properties |
X |
X |
X |
X |
X |
View tickets |
X |
X |
X |
X |
X |
1 In addition, the security level for the device scope must be OperatorPlus or higher for the device that holds the root alarm for a ticket. |
Viewing Tickets and Network Events for Elements in a Map
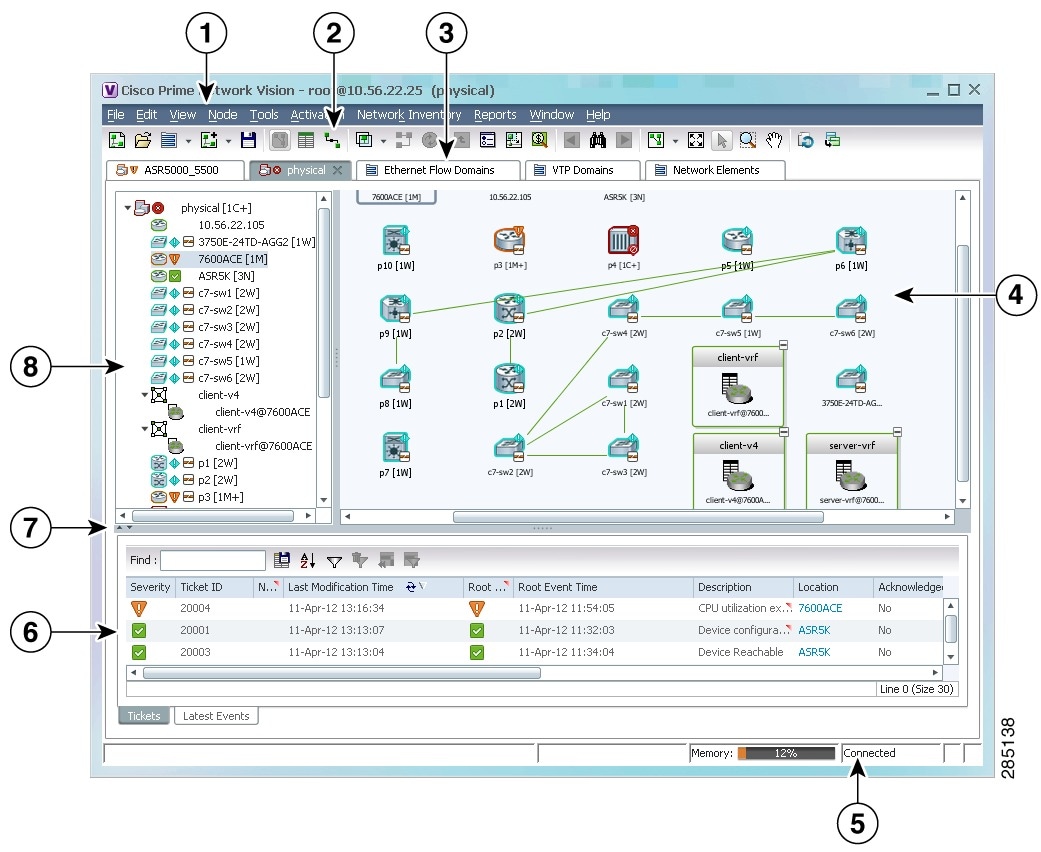
The ticket pane, located below the navigation and content panes in the Prime Network Vision window, displays tickets and network events specific to the elements in the currently displayed map (see Figure 10-1). You can view or hide the ticket pane by clicking the arrows displayed below the navigation pane.
The ticket pane contains two tabs:
•![]() Tickets tab—Lists all the tickets relevant to the elements in the map and allows you to manage them. See Managing Tickets in the Tickets Tab for details of the information displayed and the actions available from the Tickets tab.
Tickets tab—Lists all the tickets relevant to the elements in the map and allows you to manage them. See Managing Tickets in the Tickets Tab for details of the information displayed and the actions available from the Tickets tab.
•![]() Latest Events tab:
Latest Events tab:
–![]() Lists network events that were created for the elements in the map from the time the map was opened.
Lists network events that were created for the elements in the map from the time the map was opened.
–![]() Shows network events that Prime Network recognizes and is able to process (actionable events). Some of these events might be correlated into tickets.
Shows network events that Prime Network recognizes and is able to process (actionable events). Some of these events might be correlated into tickets.
–![]() An hourglass in the Status column indicates that processing of the event is in progress. A check mark indicates that the event has been processed.
An hourglass in the Status column indicates that processing of the event is in progress. A check mark indicates that the event has been processed.
–![]() If an event has been correlated into a ticket, the ticket ID will appear in the table and you can click the link to access the ticket properties.
If an event has been correlated into a ticket, the ticket ID will appear in the table and you can click the link to access the ticket properties.
–![]() Events are removed from the Latest Events tab after 6 hours or when a maximum of 15000 events is reached, in which case the oldest events are removed first.
Events are removed from the Latest Events tab after 6 hours or when a maximum of 15000 events is reached, in which case the oldest events are removed first.
Figure 10-1 Prime Network Vision Window
|
|
Menu bar |
|
Status bar |
|
|
Toolbar |
|
Ticket pane |
|
|
Inventory and map tabs |
|
Hide/Display ticket pane |
|
|
Content pane |
|
Navigation pane |
Managing Tickets in the Tickets Tab
Table 10-2 describes the functions that are available from the Tickets tab in the ticket pane.
Table 10-3 describes the information displayed in the ticket pane.
|
|
|
|---|---|
Severity |
Severity of alarm, represented by an icon. The icon and its color indicate the alarm severity and thereby the impact of the alarm on the network. For more information about severity, see Map View. • • • • • • • |
Ticket ID |
Ticket identifier, assigned sequentially. Click the hyperlinked entry to view ticket properties, and to acknowledge, clear, or refresh the ticket. For more information, see Chapter 10 "Working with Tickets in Cisco Prime Network Vision." |
Notes |
An icon in this column indicates that a note has been added for the ticket. Click on the icon to read the note and add your own note, if necessary. |
Last Modification Time |
Date and time (per the database) that the ticket was last updated. Updates can result from either manual or automatic operations. |
Root Cause |
Severity of the root cause alarm, represented by a bell icon. The color indicates the severity of the root cause alarm, as described in the Severity field. |
Root Event Time |
Date and time that the event that created the root cause alarm of the ticket was detected. |
Description |
Description of the event that caused the ticket creation. |
Location |
Entity that triggered the ticket, as a hyperlink that displays the relevant location in the inventory. |
Acknowledged |
Whether the ticket is acknowledged or has been modified: Yes, No, or Modified. If the ticket is acknowledged, this field also displays the user who acknowledged the ticket; for example, Yes(root). |
Creation Time |
Date and time (per the database) that the ticket was created. |
Event Count |
Number of events associated with the ticket. |
Affected Devices Count |
Number of devices affected by the ticket, including the sources of the alarm and their subsequent alarms. |
Duplication Count |
For network events, the duplication count is calculated by the VNE and pertains only to flapping events. The duplication count represents the number of noncleared events aggregated by the flapping event. For tickets, the duplication count is the sum of the duplication counts of all events that are associated with the root alarm. |
Reduction Count |
For network events, the reduction count is calculated by the VNE and pertains only to flapping events. The reduction count represents the number of events that are aggregated by the flapping event. Ticket reduction count is the sum of reduction counts of all the events that are associated to the ticket. The History tab in the Windows Properties window displays one reduction count for each event listed. |
Alarm Count |
Total number of alarms associated with the ticket, including the root alarm. |
The ticket details in the ticket pane change automatically as new information arrives. For example, Port Down is updated to Port Up.
By default, the tickets in the ticket pane are sorted according to the last modification time.
The Find field enables you to search for information in the ticket pane table according to the selected column. For more information about the buttons displayed in Prime Network Vision tables and table functionality, see Filtering and Sorting Tabular Content.
Understanding Ticket Status
The appearance of a ticket displayed in the ticket pane depends on the severity of the ticket and the operations that have been performed on the ticket. Tickets detailed in the ticket pane change when:
•![]() A ticket is generated.
A ticket is generated.
•![]() A ticket is cleared.
A ticket is cleared.
•![]() A ticket is acknowledged.
A ticket is acknowledged.
•![]() An Up ticket is generated.
An Up ticket is generated.
•![]() A ticket is cleared and removed.
A ticket is cleared and removed.
•![]() A ticket is removed.
A ticket is removed.
•![]() Other properties are updated, such as severity, description, or counters.
Other properties are updated, such as severity, description, or counters.
Generated Ticket
Table 10-4 shows an example of the appearance of the ticket pane when a ticket is generated.
|
|
|
|
|
|
|---|---|---|---|---|

|
Major |
27 |
Port down |
Yes |
Cleared Ticket
Table 10-5 shows an example of the appearance of the ticket pane when a ticket is cleared.
|
|
|
|
|
|
|---|---|---|---|---|

|
Normal |
27 |
Cleared due to Force Clear |
Yes |
A ticket that has been cleared can be removed from the ticket pane.
When a ticket is cleared, its definition automatically changes to acknowledged in the ticket pane and its definition in the Acknowledged column is Acknowledged.
Acknowledged Ticket
Table 10-6 shows an example of the appearance of the ticket pane when a ticket is acknowledged. When a ticket is acknowledged it can then be cleared and the severity changes to Normal.
|
|
|
|
|
|
|---|---|---|---|---|
|
Major |
27 |
Port up |
Yes |

Note ![]() When a ticket with an Information severity is acknowledged, the ticket is automatically removed from the Prime Network gateway and from the ticket pane.
When a ticket with an Information severity is acknowledged, the ticket is automatically removed from the Prime Network gateway and from the ticket pane.
Generated Up Ticket
The cause of the alarm is fixed; therefore an Up ticket is automatically generated with a Normal severity. Table 10-7 shows an example of the appearance of the ticket pane when an Up ticket is generated.
|
|
|
|
|
|
|---|---|---|---|---|
|
Normal |
27 |
Port up |
Yes |
Filtering Tickets by Network Element
Prime Network Vision enables you to filter the tickets that are shown in the ticket pane so that you see only the tickets that have the selected network element as the root cause.
If the selected network element is alarmed due to an operation that occurred on a different VNE, element, or link, no tickets are displayed.
To view tickets that have a specific network element as the root cause, do either of the following:
•![]() If the network element icon is at the largest size, click the Filter Tickets button.
If the network element icon is at the largest size, click the Filter Tickets button.
•![]() Right-click the required network element in the navigation pane or a map and choose Filter Tickets.
Right-click the required network element in the navigation pane or a map and choose Filter Tickets.
In response:
•![]() The ticket pane displays only the tickets that have the selected network element as the root cause.
The ticket pane displays only the tickets that have the selected network element as the root cause.
•![]() The Filter button in the ticket pane toggles to indicate that a filter has been applied.
The Filter button in the ticket pane toggles to indicate that a filter has been applied.
Click Clear Filter in the ticket pane to view all tickets.
Filtering Tickets by Criteria
Prime Network Vision enables you to define a filter for the tickets displayed in the ticket pane according to various criteria. For example, tickets can be filtered according to the number of affected parties or acknowledged tickets.
To define a ticket filter:
Step 1 ![]() Click Ticket Filter in the ticket pane toolbar. The Ticket Filter dialog box is displayed (Figure 10-2).
Click Ticket Filter in the ticket pane toolbar. The Ticket Filter dialog box is displayed (Figure 10-2).
Figure 10-2 Ticket Filter Dialog Box
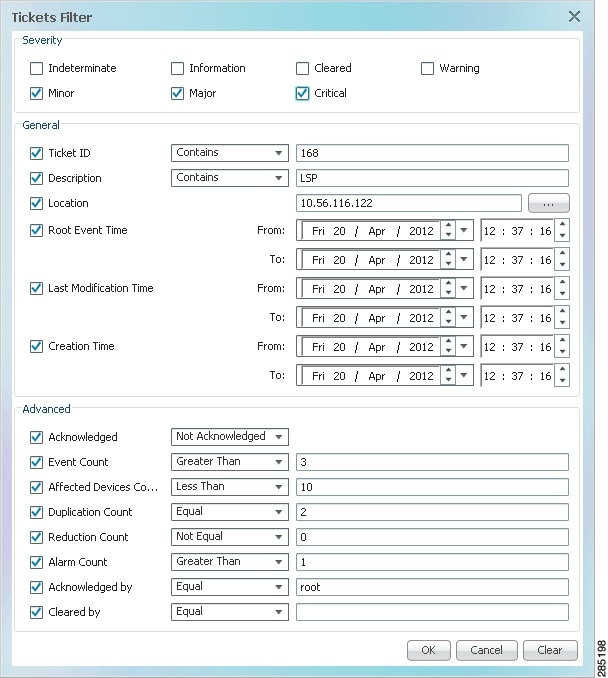
Step 2 ![]() Specify the filter criteria by using the following steps and the information in Table 10-8:
Specify the filter criteria by using the following steps and the information in Table 10-8:
a. ![]() Check the check box for each criterion to use for filtering.
Check the check box for each criterion to use for filtering.
b. ![]() As needed, choose the operator for the filter, such as Contains or Does Not Contain.
As needed, choose the operator for the filter, such as Contains or Does Not Contain.
c. ![]() Supply the specific information to apply to the filter, such as the time, a string, or one or more IP addresses.
Supply the specific information to apply to the filter, such as the time, a string, or one or more IP addresses.
Step 3 ![]() Click OK. The tickets are displayed in the ticket pane according to the defined criteria.
Click OK. The tickets are displayed in the ticket pane according to the defined criteria.
Note ![]() The Ticket Filter button in the ticket pane toggles to indicate that a filter has been applied.
The Ticket Filter button in the ticket pane toggles to indicate that a filter has been applied.
To remove a ticket filter:
Step 1 ![]() Click Ticket Filter in the ticket pane toolbar. The Ticket Filter dialog box is displayed.
Click Ticket Filter in the ticket pane toolbar. The Ticket Filter dialog box is displayed.
Step 2 ![]() Click Clear. The selected options in the Ticket Filter dialog box are cleared.
Click Clear. The selected options in the Ticket Filter dialog box are cleared.
Step 3 ![]() Click OK. All the tickets are displayed in the ticket pane.
Click OK. All the tickets are displayed in the ticket pane.
Viewing Ticket Properties
The properties of a selected ticket can be viewed by displaying the Ticket Properties window. For example, you can view alarm severity, correlated alarms, active alarms, alarm history, or the source of the alarm.
In Prime Network Vision, open the Ticket Properties window in one of the following ways:
•![]() Open the required map and then double-click the required ticket identifier in the ticket pane.
Open the required map and then double-click the required ticket identifier in the ticket pane.
•![]() Open the required map, right-click a ticket in the ticket pane, and choose Properties.
Open the required map, right-click a ticket in the ticket pane, and choose Properties.
Figure 10-3 shows the Ticket Properties window.
Figure 10-3 Ticket Properties Window
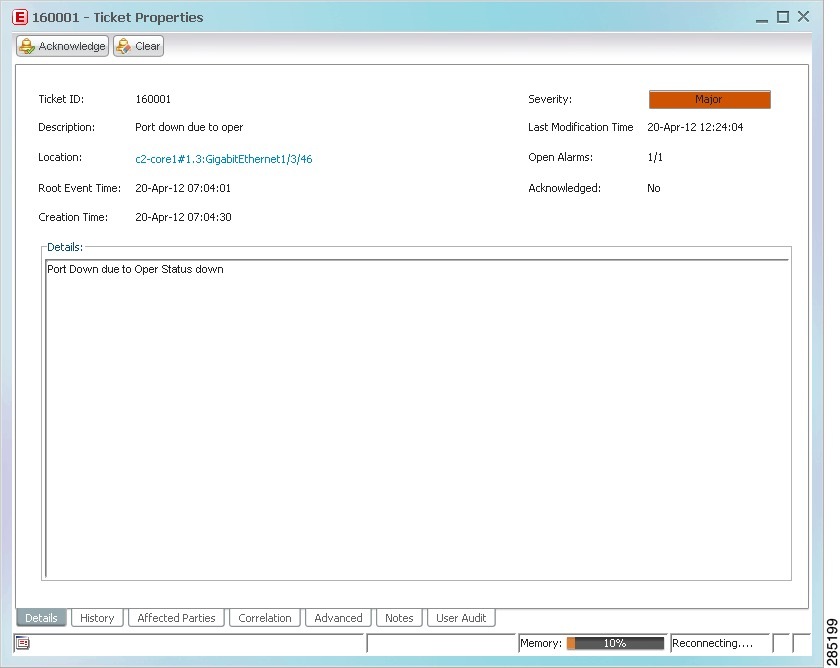
The information displayed in the Ticket Properties window corresponds with the information displayed in the Prime Network Vision ticket pane or the Prime Network Vision window. The ID number displayed in the header corresponds to the ID number of the ticket selected in the ticket pane.
The Ticket Properties window contains the following components:
Ticket Properties Toolbar
The Ticket Properties window contains the tools described in Table 10-9.
|
|
|
|---|---|

|
Acknowledges that the ticket is being handled. The status of the ticket is displayed as true in the ticket pane and in the Ticket Properties dialog box. For more information, see Acknowledged Ticket. If a ticket was acknowledged, and some events were correlated to it afterward, then the ticket is considered to have not been acknowledged. This button is enabled only if the ticket is not acknowledged. |

|
Requests the relevant Prime Network system to remove the faulty network element from the Prime Network networking inventory. In addition, it sets the ticket to Cleared severity or status (the icon is displayed in green) and automatically changes the acknowledged status of the ticket to true. For more information, see Cleared Ticket. This button is enabled only if the severity of the alarm is higher than Cleared or Normal. |

|
Saves the notes for the selected ticket. This button is enabled only when text is entered in the Notes field of the Notes tab. |
Details Tab
Table 10-10 describes the information that is displayed in the Details tab about the compiled alarm.
History Tab
The History tab enables you to display the history of the ticket, including all the events. Figure 10-4 shows the History tab.
Figure 10-4 History Tab
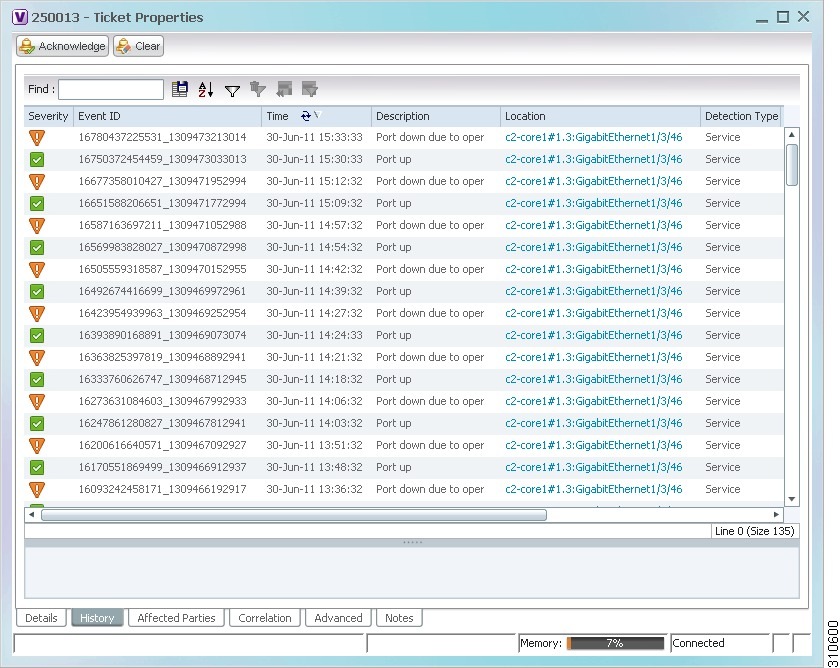
Table 10-11 describes the information that is displayed in the History tab.
Affected Parties Tab
The Affected Parties tab displays the service resources (pairs) that are affected by an event, an alarm, or a ticket. When a fault occurs, Prime Network automatically calculates the affected parties and embeds this information in the ticket along with all the correlated faults. You can view a list of all the endpoints that are affected.
The Affected Parties tab displays the service resources (affected pairs) that are affected by the ticket.
Figure 10-5 Affected Parties Tab
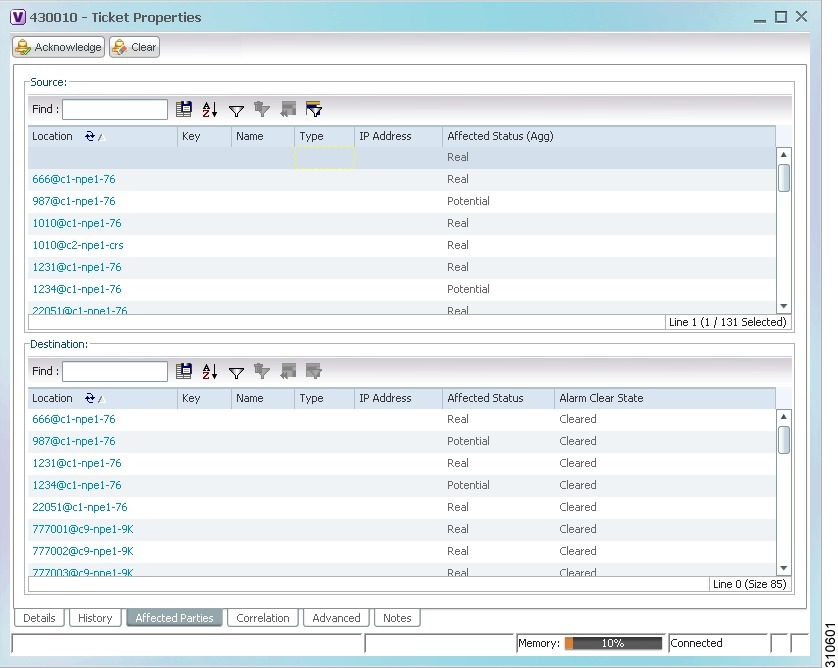
The Affected Parties tab contains two tables: Source and Destination. Table 10-12 describes the information that is displayed in the Affected Properties tab.
|
|
|
|---|---|
|
|
|
Location |
Hyperlinked entry to the port with the affected parties. |
Key |
Unique value taken from the affected element's business tag key, if it exists. |
Name |
Subinterface (site) name or business tag name of the affected element, if it exists. |
Type |
Business tag type. |
IP Address |
If the affected element is an IP interface, the IP address of the subinterface site. |
Affected Status (Agg) |
Status for the affected pair (destination). The same source can be part of multiple pairs, and therefore each pair can have a different affected status. The highest affected status reflects the highest among these. The affected status can be one of the following: • • • • |
|
|
|
Location |
Hyperlinked entry to the port with the affected parties. |
Key |
Unique value taken from the affected element's business tag key, if it exists. |
Name |
Subinterface name or business tag name of the affected element, if it exists. |
Type |
Business tag type. |
IP Address |
If the affected element is an IP interface, the IP address of the subinterface site. |
Affected Status |
Status of the affected pair as calculated by the client according to the rules defined in Status Values for Affected Parties. |
Alarm Clear State |
For each pair, an indication of the clear state of the alarm: • • |
When an affected side is selected in the Source table, the Destination table lists all endpoints with services that have been affected between them and the entry selected in the Source table.
Note ![]() The Affected Parties dialog box occasionally displays entries that start with the word Misconfigured. Entries that start with Misconfigured indicate that the flow has stopped unexpectedly between the source and destination points. An unexpected termination point can be a routing entity, bridge, or VC switching entity. The significant aspects of Misconfigured entries are:
The Affected Parties dialog box occasionally displays entries that start with the word Misconfigured. Entries that start with Misconfigured indicate that the flow has stopped unexpectedly between the source and destination points. An unexpected termination point can be a routing entity, bridge, or VC switching entity. The significant aspects of Misconfigured entries are:
- Because the link does not terminate as expected, the link is not actually impacted.
- An error might exist in the configuration or status of the termination points. We recommend that you check the configuration and status of the affected termination points.
Correlation Tab
The Correlation tab displays all the alarms that are correlated to the selected ticket.
Figure 10-6 Correlation Tab
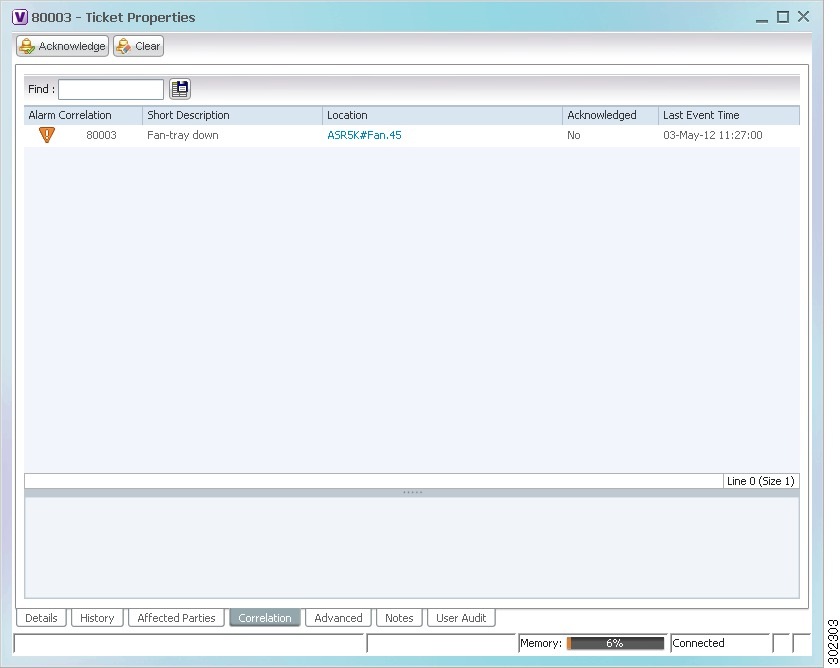
Table 10-13 describes the information that is displayed in the Correlation tab.
Advanced Tab
The Advanced tab displays the following values for the selected ticket:
•![]() Duplication Count:
Duplication Count:
–![]() For network events, the duplication count is calculated by the VNE and pertains only to flapping events. The duplication count represents the number of noncleared events aggregated by the flapping event.
For network events, the duplication count is calculated by the VNE and pertains only to flapping events. The duplication count represents the number of noncleared events aggregated by the flapping event.
–![]() For tickets, the duplication count is the sum of the duplication counts of all events that are associated with the root alarm.
For tickets, the duplication count is the sum of the duplication counts of all events that are associated with the root alarm.
•![]() Reduction Count:
Reduction Count:
–![]() For network events, the reduction count is calculated by the VNE and pertains only to flapping events. The reduction count represents the number of events that are aggregated by the flapping event.
For network events, the reduction count is calculated by the VNE and pertains only to flapping events. The reduction count represents the number of events that are aggregated by the flapping event.
–![]() For tickets, reduction count is the sum of reduction counts of all the events that are associated to the ticket. The History tab in the Ticket Properties window displays one reduction count for each event listed.
For tickets, reduction count is the sum of reduction counts of all the events that are associated to the ticket. The History tab in the Ticket Properties window displays one reduction count for each event listed.
•![]() Affected Devices—The number of devices affected by the ticket.
Affected Devices—The number of devices affected by the ticket.
•![]() Alarm Count—The total number of alarms associated with the ticket, including the root alarm.
Alarm Count—The total number of alarms associated with the ticket, including the root alarm.
Notes Tab
The Notes tab enables you to add and save notes for the selected ticket. To add text, enter text in the Notes field and click Save Notes. The new text is added to any previously existing text.
After you save a note, it appears in the Previous Notes section of the Notes tab, with the name of the user who added the note and the time it was added. If the user is an external user (for example, a Netcool user), the username will be displayed in the following format:
"Added by prime-networkUserName (as externalUserName)"
The following restrictions apply to the Notes tab:
•![]() You can add notes for a ticket only if both of the following conditions are true:
You can add notes for a ticket only if both of the following conditions are true:
–![]() The default permission for your account is OperatorPlus or higher.
The default permission for your account is OperatorPlus or higher.
–![]() The security level for the device scope is OperatorPlus or higher for the device that holds the root alarm for that ticket.
The security level for the device scope is OperatorPlus or higher for the device that holds the root alarm for that ticket.
•![]() The Notes tab is not available for archived tickets.
The Notes tab is not available for archived tickets.
•![]() The Save Notes button is enabled only when text is entered in the Notes field.
The Save Notes button is enabled only when text is entered in the Notes field.
•![]() The text cannot be edited or removed once you have saved the notes.
The text cannot be edited or removed once you have saved the notes.
User Audit Tab
The User Audit tab enables you to see which ticket-related actions were carried out by which users, and when the action took place.
If the user is an external user (for example, a Netcool user), the username will be displayed in the following format in the User Name column:
"Added by prime-networkUserName (as externalUserName)"
The following actions are reported in the User Audit tab:
•![]() Acknowledge ticket
Acknowledge ticket
•![]() Remove ticket (archive)
Remove ticket (archive)
•![]() Clear ticket
Clear ticket
Managing Tickets
The following topics describe how to manage tickets:
•![]() Clearing and Removing Tickets
Clearing and Removing Tickets
You can acknowledge, clear, remove, or clear and remove a ticket only if both of the following conditions are true:
•![]() The default permission for your account is OperatorPlus or higher.
The default permission for your account is OperatorPlus or higher.
•![]() The security level for the device scope is OperatorPlus or higher for the device that holds the root alarm for that ticket.
The security level for the device scope is OperatorPlus or higher for the device that holds the root alarm for that ticket.
Prime Network automatically clears and removes (archives) tickets with more than 150 associated events, and generates a system notification event regarding the actions taken. For more information about this feature, see the Cisco Prime Network 3.10 Administrator Guide.
Finding Affected Elements
To locate elements affected by a ticket in Prime Network Vision, right-click the desired ticket in the ticket pane and then choose Find Affected Elements.
Depending on the number of affected elements, the results are displayed in one of the following ways:
•![]() If only one element is affected, it is highlighted in the navigation pane and the content area.
If only one element is affected, it is highlighted in the navigation pane and the content area.
•![]() If multiple elements are affected, they are displayed in the Affected Events window.
If multiple elements are affected, they are displayed in the Affected Events window.
Acknowledging a Ticket
When an alarm occurs, a warning or ticket is displayed in the ticket pane. Prime Network Vision enables you to handle the status of a ticket by acknowledging it. This acknowledges the fault.
The change is reported to the Prime Network gateway and all open Prime Network applications. You can acknowledge multiple tickets at the same time.
An acknowledged ticket returns to a status of Not Acknowledged when a new event is correlated to it.
Note ![]() You cannot undo this operation.
You cannot undo this operation.
To acknowledge one or more tickets, select one or more tickets in the ticket pane, and then right-click and choose Acknowledge. For more information, see Understanding Ticket Status.
Clearing a Ticket
When an alarm occurs, a warning or ticket is displayed in the ticket pane. Prime Network Vision enables you to handle the reported ticket by verifying the report of what is faulty and clearing the faulty network element. The change is reported to the Prime Network gateway and all open Prime Network applications. This operation cannot be reversed.
You can clear multiple tickets at the same time.
Note ![]() Before using Clear and Remove (which might also be available when you right-click a ticket), be sure you understand the results of removing a ticket. Like clearing a ticket, removing a ticket cannot be reversed. See Removing a Ticket.
Before using Clear and Remove (which might also be available when you right-click a ticket), be sure you understand the results of removing a ticket. Like clearing a ticket, removing a ticket cannot be reversed. See Removing a Ticket.
Clearing an open ticket performs the following operations:
•![]() For tickets relating to physical network elements (e.g., link down, card out), the faulty network element is removed from the Prime Network inventory.
For tickets relating to physical network elements (e.g., link down, card out), the faulty network element is removed from the Prime Network inventory.
•![]() Sets the alarm to Cleared or Normal severity or status by issuing a corresponding Clear alarm.
Sets the alarm to Cleared or Normal severity or status by issuing a corresponding Clear alarm.
•![]() Automatically sets the alarm severity or status to acknowledged (true).
Automatically sets the alarm severity or status to acknowledged (true).
To clear one or more tickets, do one of the following:
•![]() Select one or more tickets in the ticket pane, and then right-click and choose Clear.
Select one or more tickets in the ticket pane, and then right-click and choose Clear.
•![]() Double-click a ticket in the ticket pane and click Clear in the Ticket Properties window.
Double-click a ticket in the ticket pane and click Clear in the Ticket Properties window.
For more information, see Understanding Ticket Status.
Removing a Ticket
When an alarm occurs, a warning or ticket is displayed in the ticket pane. Prime Network Vision enables you to completely remove the ticket and all of its active alarms and business tags. The change is reported to the Prime Network gateway and all instances of Prime Network that are open. In addition, several tickets can be removed at the same time. After a ticket is cleared or an Up alarm occurs, the ticket can be removed.
You can remove multiple tickets at the same time.
Note ![]() This operation cannot be reversed. A ticket that has been removed can be viewed only by using Prime Network Events.
This operation cannot be reversed. A ticket that has been removed can be viewed only by using Prime Network Events.
Removing a ticket performs the following operations:
•![]() For certain network elements, such as cards or links, sends a request to the Prime Network system to remove the faulty network element from the Prime Network networking inventory.
For certain network elements, such as cards or links, sends a request to the Prime Network system to remove the faulty network element from the Prime Network networking inventory.
•![]() Archives the ticket and active alarms.
Archives the ticket and active alarms.
•![]() Notifies all open instances of Prime Network clients (Prime Network Vision or BQL) that are registered on the ticket that the ticket has been removed and deletes the ticket from the ticket pane.
Notifies all open instances of Prime Network clients (Prime Network Vision or BQL) that are registered on the ticket that the ticket has been removed and deletes the ticket from the ticket pane.
Removing a ticket within seven minutes of its creation results in the following behavior:
•![]() New alarms that might be related to the ticket, and should therefore be correlated to it, are not correlated to the original ticket because the ticket has been removed from Prime Network Vision.
New alarms that might be related to the ticket, and should therefore be correlated to it, are not correlated to the original ticket because the ticket has been removed from Prime Network Vision.
•![]() Flagging events that are ticketable open new tickets. These new tickets might be delayed and might not be visible in Prime Network Vision for up to seven minutes after the event was created.
Flagging events that are ticketable open new tickets. These new tickets might be delayed and might not be visible in Prime Network Vision for up to seven minutes after the event was created.
•![]() Flagging events that are not ticketable are archived.
Flagging events that are not ticketable are archived.
•![]() Clearing events are archived.
Clearing events are archived.
Note ![]() Only tickets with a severity of Cleared, Normal, or Information can be removed.
Only tickets with a severity of Cleared, Normal, or Information can be removed.
To remove one or more tickets, select the required tickets in the ticket pane, and then right-click and choose Remove.
For more information, see Understanding Ticket Status.
In addition, an uncleared ticket (which has a severity higher than Cleared or Normal) can be cleared and removed by right-clicking in the ticket pane and choosing Clear and Remove. For more information about the Ticket right-click menu, see Ticket Right-Click Menu.
Clearing and Removing Tickets
Clearing and removing a ticket:
•![]() Approves the reported faulty ticket.
Approves the reported faulty ticket.
•![]() Clears the faulty networking entity from Prime Network Vision.
Clears the faulty networking entity from Prime Network Vision.
•![]() Archives the ticket.
Archives the ticket.
You can clear and remove multiple tickets at the same time. This operation will attempt to modify any ticket which is not being used by other processes, such as a ticket that is being updated with new network events. In order to clear and remove a highly active ticket, you should select only that ticket. That way, the system will wait until it becomes available for an update before removing it.
To clear and remove one or more tickets, select the required tickets in the ticket pane, and then right-click and choose Clear and Remove.
Impact Analysis in Prime Network
Impact analysis enables you to identify the network elements and services that are impacted by a network fault or outage.
Prime Network offers two modes of impact analysis:
•![]() Automatic impact analysis—When a fault occurs that has been identified as potentially service affecting, Prime Network automatically generates the list of potential and actual service resources that were affected by the fault, and embeds this information in the ticket along with all the correlated faults.
Automatic impact analysis—When a fault occurs that has been identified as potentially service affecting, Prime Network automatically generates the list of potential and actual service resources that were affected by the fault, and embeds this information in the ticket along with all the correlated faults.
Note ![]() This applies only to specific alarms. Not every alarm initiates automatic impact analysis.
This applies only to specific alarms. Not every alarm initiates automatic impact analysis.
•![]() Proactive impact analysis—Prime Network provides what-if scenarios for determining the possible effect of network failures. This enables on-demand calculation of affected service resources for every link in the network, thus enabling an immediate service availability check and analysis for potential impact and identification of critical network links. Upon execution of the what-if scenario, Prime Network initiates an end-to-end flow that determines all the potentially affected edges.
Proactive impact analysis—Prime Network provides what-if scenarios for determining the possible effect of network failures. This enables on-demand calculation of affected service resources for every link in the network, thus enabling an immediate service availability check and analysis for potential impact and identification of critical network links. Upon execution of the what-if scenario, Prime Network initiates an end-to-end flow that determines all the potentially affected edges.
Note ![]() Each fault that has been identified as potentially service affecting triggers an impact analysis calculation, even if the fault recurs in the network.
Each fault that has been identified as potentially service affecting triggers an impact analysis calculation, even if the fault recurs in the network.
Status Values for Affected Parties
In automatic mode, the affected parties can be marked with one of the following status values:
•![]() Potential—The service might be affected but its actual state is not yet known.
Potential—The service might be affected but its actual state is not yet known.
•![]() Real—The service is affected.
Real—The service is affected.
•![]() Recovered—The service has recovered. This state applies only to entries that were marked previously as potentially affected. It indicates only the fact that there is an alternate route to the service, regardless of the service quality level.
Recovered—The service has recovered. This state applies only to entries that were marked previously as potentially affected. It indicates only the fact that there is an alternate route to the service, regardless of the service quality level.
Initially, Prime Network might identify the services as either potentially or real affected. As time progresses and more information is accumulated from the network, Prime Network updates the information to indicate which of the potentially affected parties are real or recovered.
The indications for these states are available through both the API and in the GUI.
Note ![]() There is no clear state for the affected services when the alarm is cleared.
There is no clear state for the affected services when the alarm is cleared.
Accumulating Affected Parties
During automatic impact analysis, Prime Network automatically calculates the accumulation of affected parties. This information is embedded in the ticket along with all of the correlated faults.
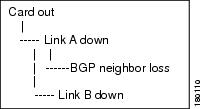
In the following example, these alarm types exist in the correlation tree:
•![]() Ticket root-cause alarm (Card Out).
Ticket root-cause alarm (Card Out).
•![]() An alarm which is correlated to the root cause and has other alarms correlated to it (Link A Down).
An alarm which is correlated to the root cause and has other alarms correlated to it (Link A Down).
•![]() An alarm with no other alarms correlated to it (Link B Down and BGP Neighbor Loss).
An alarm with no other alarms correlated to it (Link B Down and BGP Neighbor Loss).
An event sequence is correlated to each of these alarms.
Figure 10-7 Correlation Tree Example
Prime Network identifies the affected parties for each type of alarm and accumulates the following information:
•![]() The affected parties reported on all the events in the alarm event sequence, including flapping alarms.
The affected parties reported on all the events in the alarm event sequence, including flapping alarms.
•![]() The affected parties reported on the alarms that are correlated to it.
The affected parties reported on the alarms that are correlated to it.
The gathered information includes the accumulation of the affected report of all the events in its own correlation tree.
For example, in Figure 10-7:
•![]() BGP neighbor loss includes the affected parties of all events in its own event sequence.
BGP neighbor loss includes the affected parties of all events in its own event sequence.
•![]() Link A Down includes the affected parties of its own event sequence and the accumulated information of the BGP Neighbor Loss event.
Link A Down includes the affected parties of its own event sequence and the accumulated information of the BGP Neighbor Loss event.
Accumulating the Affected Parties in an Alarm
If two events form part of the same event sequence in a specific alarm, the recurring affected pairs are displayed only once in the Affected Parties tab. If different affected severities are reported for the same pair, the pair is marked with the severity that was reported by the latest event, according to the time stamp.
Accumulating the Affected Parties in the Correlation Tree
If two or more alarms that are part of the same correlation tree report on the same affected pair of edgepoints and have different affected severities, the recurring affected pairs are displayed only once in the Affected Parties tab. If different affected severities are reported for the same pair, the pair is marked with the highest severity.
For example, assume that X and Y are the OIDs of edgepoints in the network, and a service is running between them. Both alarms, Link B Down and BGP Neighbor Loss, report on the pair X < > Y as affected:
•![]() Link B Down reports on X < > Y as potentially affected.
Link B Down reports on X < > Y as potentially affected.
•![]() BGP Neighbor Loss reports on X < > Y as real affected.
BGP Neighbor Loss reports on X < > Y as real affected.
The affected severity priorities are:
•![]() Real—Priority 1
Real—Priority 1
•![]() Recovered—Priority 2
Recovered—Priority 2
•![]() Potential—Priority 3
Potential—Priority 3
Card Out reports on X < > Y as real, affected only once.
Updating Affected Severity over Time
In some cases, Prime Network updates the affected severity of the same alarm over time because the effect of the fault on the network cannot be determined until the network has converged.
For example, a Link Down alarm creates a series of affected severity updates over time. These updates are added to the previous updates in the system database. In this case, the system provides the following reports:
•![]() The first report of a link down reports on X < > Y as potentially affected.
The first report of a link down reports on X < > Y as potentially affected.
•![]() Over time, the VNE identifies that this service is real affected or recovered, and generates an updated report.
Over time, the VNE identifies that this service is real affected or recovered, and generates an updated report.
•![]() The Affected Parties tab of the Ticket Properties dialog box displays the latest severity as real affected.
The Affected Parties tab of the Ticket Properties dialog box displays the latest severity as real affected.
•![]() The Affected Parties Destination Properties dialog box displays both reported severities.
The Affected Parties Destination Properties dialog box displays both reported severities.
This functionality is available only in the link-down scenario in MPLS networks.
 Feedback