- Title Page
- Table of Contents
- Preface
- Setting Up Devices and Using the GUI Clients
- Working with the Cisco Prime Network Vision Client
- Viewing and Managing NE Properties
- Device Configurations and Software Images
- Working with Prime Network Vision Maps
- Working with Links
- Labeling NEs Using Business Tags
- Working with the Prime Network Events
- Tracking Faults Using Prime Network Events
- Working with Tickets in Cisco Prime Network Vision
- Working with Reports
- Using Cisco PathTracer to Diagnose Problems
- Monitoring Carrier Ethernet Services
- Monitoring Carrier Grade NAT Properties
- Monitoring DWDM Properties
- Monitoring Ethernet Operations, Administration,and Maintenance Tool Properties
- Monitoring Y.1731 IPSLA Configuration
- IPv6 and IPv6 VPN over MPLS
- Monitoring MPLS Services
- Viewing IP and MPLS Multicast Configurations
- Monitoring MToP Services
- Viewing and Managing SBCs
- Monitoring AAA Configurations
- Monitoring IP Pools
- Monitoring BNG Configurations
- Monitoring Mobile Technologies
- Monitoring Data Center Configurations
- Icon and Button Reference
- Glossary
- Index
- User Roles Required to Work with Carrier Ethernet Services
- Viewing CDP Properties
- Viewing Link Layer Discovery Protocol Properties
- Viewing Spanning Tree Protocol Properties
- Viewing Resilient Ethernet Protocol Properties
- Viewing HSRP Properties
- Viewing Access Gateway Properties
- Working with Ethernet Link Aggregation Groups
- Viewing mLACP Properties
- Viewing Provider Backbone Bridge Properties
- Viewing EFP Properties
- Connecting a Network Element to an EFP
- Understanding EFP Severity and Ticket Badges
- Viewing EVC Service Properties
- Viewing and Renaming Ethernet Flow Domains
- Working with VLANs and VLAN Overlays
- Understanding VLAN and EFD Discovery
- Understanding VLAN Elements
- Switching Entities Containing Termination Points
- Adding VLANs to a Map
- Removing VLANs from a Map
- Viewing VLAN Mappings
- Working with Associated VLANs
- Viewing VLAN Links Between VLAN Elements and Devices
- Applying VLAN Overlays
- Displaying or Hiding VLAN Overlays
- Removing a VLAN Overlay
- Viewing VLAN Service Link Properties
- Viewing REP Information in VLAN Domain Views and VLAN Overlays
- Viewing REP Properties for VLAN Service Links
- Viewing STP Information in VLAN Domain Views and VLAN Overlays
- Viewing STP Properties for VLAN Service Links
- Viewing VLAN Trunk Group Properties
- Viewing VLAN Bridge Properties
- Using Commands to Work With VLANs
- Understanding Unassociated Bridges
- Working with Ethernet Flow Point Cross-Connects
- Working with VPLS and H-VPLS Instances
Monitoring Carrier Ethernet Services
The following topics describe how you can use Cisco Prime Network Vision (Prime Network Vision) to monitor Carrier Ethernet services:
•![]() User Roles Required to Work with Carrier Ethernet Services
User Roles Required to Work with Carrier Ethernet Services
•![]() Viewing Link Layer Discovery Protocol Properties
Viewing Link Layer Discovery Protocol Properties
•![]() Viewing Spanning Tree Protocol Properties
Viewing Spanning Tree Protocol Properties
•![]() Viewing Resilient Ethernet Protocol Properties
Viewing Resilient Ethernet Protocol Properties
•![]() Viewing Access Gateway Properties
Viewing Access Gateway Properties
•![]() Working with Ethernet Link Aggregation Groups
Working with Ethernet Link Aggregation Groups
•![]() Viewing Provider Backbone Bridge Properties
Viewing Provider Backbone Bridge Properties
•![]() Connecting a Network Element to an EFP
Connecting a Network Element to an EFP
•![]() Understanding EFP Severity and Ticket Badges
Understanding EFP Severity and Ticket Badges
•![]() Viewing EVC Service Properties
Viewing EVC Service Properties
•![]() Viewing and Renaming Ethernet Flow Domains
Viewing and Renaming Ethernet Flow Domains
•![]() Working with VLANs and VLAN Overlays
Working with VLANs and VLAN Overlays
•![]() Understanding Unassociated Bridges
Understanding Unassociated Bridges
•![]() Working with Ethernet Flow Point Cross-Connects
Working with Ethernet Flow Point Cross-Connects
•![]() Working with VPLS and H-VPLS Instances
Working with VPLS and H-VPLS Instances
•![]() Working with Ethernet Services
Working with Ethernet Services
•![]() Viewing IP SLA Responder Service Properties
Viewing IP SLA Responder Service Properties
•![]() Using Pseudowire Ping and Show Commands
Using Pseudowire Ping and Show Commands
User Roles Required to Work with Carrier Ethernet Services
This topic identifies the roles that are required to work with to Carrier Ethernet services in Prime Network Vision. Prime Network determines whether you are authorized to perform a task as follows:
•![]() For GUI-based tasks (tasks that do not affect elements), authorization is based on the default permission that is assigned to your user account.
For GUI-based tasks (tasks that do not affect elements), authorization is based on the default permission that is assigned to your user account.
•![]() For element-based tasks (tasks that do affect elements), authorization is based on the default permission that is assigned to your account. That is, whether the element is in one of your assigned scopes and whether you meet the minimum security level for that scope.
For element-based tasks (tasks that do affect elements), authorization is based on the default permission that is assigned to your account. That is, whether the element is in one of your assigned scopes and whether you meet the minimum security level for that scope.
For more information on user authorization, see the Cisco Prime Network 3.10 Administrator Guide.
The following tables identify the tasks that you can perform:
•![]() Table 13-1 identifies the tasks that you can perform if a selected element is not in one of your assigned scopes.
Table 13-1 identifies the tasks that you can perform if a selected element is not in one of your assigned scopes.
•![]() Table 13-2 identifies the tasks that you can perform if a selected element is in one of your assigned scopes.
Table 13-2 identifies the tasks that you can perform if a selected element is in one of your assigned scopes.
By default, users with the Administrator role have access to all managed elements. To change the Administrator user scope, see the topic on device scopes in the Cisco Prime Network 3.10 Administrator Guide.
|
|
|
|
|
|
|
|---|---|---|---|---|---|
|
|
|||||
Add associated VLANs to a map |
— |
— |
X |
X |
X |
Add EFP cross-connects |
— |
— |
X |
X |
X |
Add Ethernet services to a map |
— |
— |
X |
X |
X |
Add pseudowires to a map |
— |
— |
X |
X |
X |
Add unassociated bridges |
— |
— |
X |
X |
X |
Add VLANs to a map |
— |
— |
X |
X |
X |
Add VPLS instances to a map |
— |
— |
X |
X |
X |
|
|
|||||
View access gateway properties |
— |
— |
— |
— |
X |
View associated network VLAN service links and VLAN mapping properties |
— |
— |
— |
— |
X |
View CDP properties |
— |
— |
— |
— |
X |
View EFD properties |
— |
— |
— |
— |
X |
View EFP cross-connect properties |
Partial1 |
Partial1 |
Partial1 |
Partial1 |
X |
View EFP properties |
Partial1 |
Partial1 |
Partial1 |
Partial1 |
X |
View Ethernet flow domains |
X |
X |
X |
X |
X |
View Ethernet LAG properties |
— |
— |
— |
— |
X |
View Ethernet service properties |
X |
X |
X |
X |
X |
View EVC service properties |
— |
— |
— |
— |
X |
View IP SLA responder service properties |
— |
— |
— |
— |
X |
View IS-IS properties |
— |
— |
— |
— |
X |
View Link Layer Discovery Protocol (LLDP) properties |
— |
— |
— |
— |
X |
View mLACP properties |
— |
— |
— |
— |
X |
View OSPF properties |
— |
— |
— |
— |
X |
View Provider Backbone Bridge (PBB) properties |
— |
— |
— |
— |
X |
View pseudowire properties |
Partial1 |
Partial1 |
Partial1 |
Partial1 |
X |
View pseudowire redundancy service properties |
Partial2 |
Partial2 |
Partial2 |
Partial2 |
|
Viewing the PW-HE configuration |
— |
— |
— |
— |
X |
View REP properties |
— |
— |
— |
— |
X |
View REP properties for VLAN service links |
— |
— |
— |
— |
X |
View STP properties |
— |
— |
— |
— |
X |
View STP properties for VLAN service links |
— |
— |
— |
— |
X |
View HSRP properties |
— |
— |
— |
— |
X |
View virtual service instance properties |
— |
— |
— |
— |
X |
View VLAN bridge properties |
— |
— |
— |
— |
X |
View VLAN links between VLAN elements and devices |
Partial3 |
Partial3 |
Partial3 |
Partial3 |
X |
View VLAN mappings |
— |
— |
— |
— |
X |
View VLAN service link properties |
— |
— |
— |
— |
X |
View VLAN trunk group properties |
— |
— |
— |
— |
X |
View VPLS access EFP properties |
— |
— |
— |
— |
X |
View VPLS core or access pseudowire endpoint properties |
— |
— |
— |
— |
X |
View VPLS instance properties |
X |
X |
X |
X |
X |
|
|
|||||
Apply overlays |
X |
X |
X |
X |
X |
Display or hide overlays |
X |
X |
X |
X |
X |
Remove overlays |
X |
X |
X |
X |
X |
View pseudowire tunnel links in VPLS overlays |
— |
— |
— |
— |
X |
View REP information in VLAN domain views and VLAN overlays |
— |
— |
— |
— |
X |
View STP information in VLAN domain views and VLAN overlays |
— |
— |
— |
— |
X |
|
|
|||||
Display pseudowire information |
— |
— |
— |
— |
X |
Ping a pseudowire |
— |
— |
— |
— |
X |
Remove VLANs from a map |
— |
— |
X |
X |
X |
Rename Ethernet flow domains |
X |
X |
X |
X |
X |
Using REP and mLACP Show Commands |
— |
— |
— |
X |
X |
Using Pseudowire Ping and Show Commands |
— |
— |
— |
X |
X |
1 The user can view properties available via Node > Properties but not those available via the right-click Properties option or in logical inventory. 2 The user can view the pseudowire redundancy icon in the navigation and map panes, but not the inventory or properties window. 3 The user can view links, but the links are dimmed and do not indicate their status. |
Viewing CDP Properties
Cisco Discovery Protocol (CDP) is primarily used to obtain protocol addresses of neighboring devices and discover the platform of those devices.
In Logical Inventory
To view CDP properties:
Step 1 ![]() In Prime Network Vision, double-click the device whose CDP properties you want to view.
In Prime Network Vision, double-click the device whose CDP properties you want to view.
Step 2 ![]() In the inventory window, click Logical Inventory > Cisco Discovery Protocol.
In the inventory window, click Logical Inventory > Cisco Discovery Protocol.
The CDP properties are displayed in logical inventory as shown in Figure 13-1.
Figure 13-1 CDP in Logical Inventory
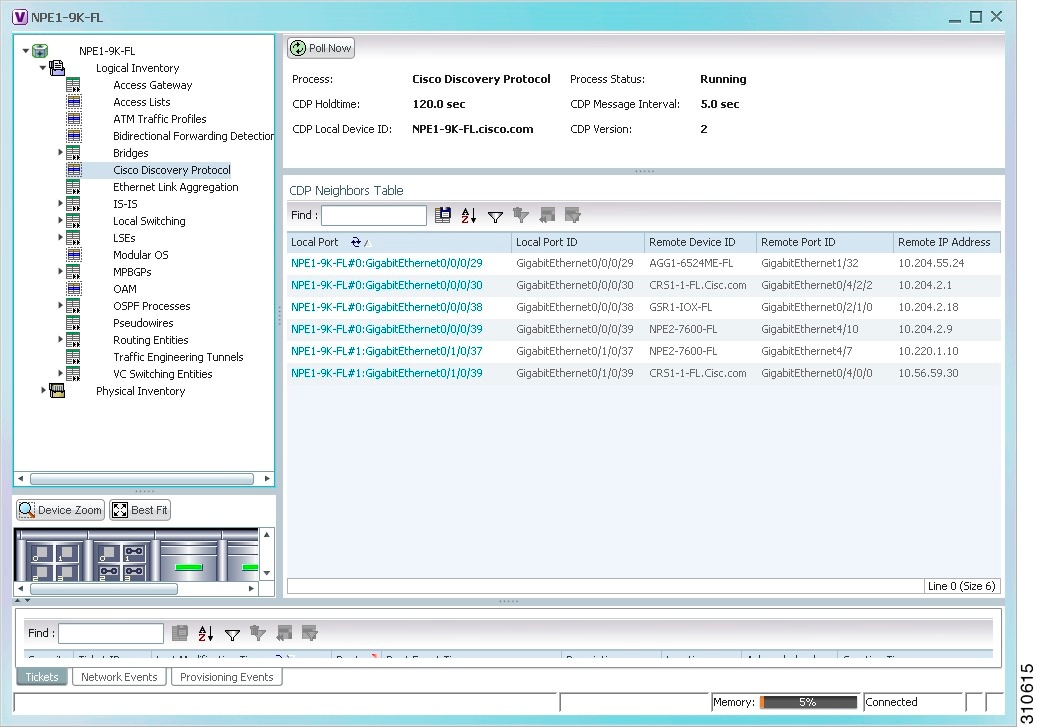
Table 13-3 describes the CDP instance properties that are displayed.
In Physical Inventory
To view CDP on a Layer 2 port:
Step 1 ![]() In Prime Network Vision, double-click the device with the Layer 2 port with the CDP information you want to view.
In Prime Network Vision, double-click the device with the Layer 2 port with the CDP information you want to view.
Step 2 ![]() In the inventory window, select the required port under Physical Inventory.
In the inventory window, select the required port under Physical Inventory.
The CDP information is displayed in the Discovery Protocols area in the Prime Network Vision content pane:
•![]() Discovery Protocol Type—CDP
Discovery Protocol Type—CDP
•![]() Info—Up or Down
Info—Up or Down
Viewing Link Layer Discovery Protocol Properties
Link Layer Discovery Protocol (LLDP) stores and maintains the local device information, including a list of devices directly connected to the device.
In Logical Inventory
To view LLDP properties:
Step 1 ![]() In Prime Network Vision, double-click the device with the LLDP information you want to view.
In Prime Network Vision, double-click the device with the LLDP information you want to view.
Step 2 ![]() In the inventory window, choose Logical Inventory > Link Layer Discovery Protocol.
In the inventory window, choose Logical Inventory > Link Layer Discovery Protocol.
The LLDP properties are displayed in logical inventory as shown in Figure 13-2.
Figure 13-2 LLDP in Logical Inventory
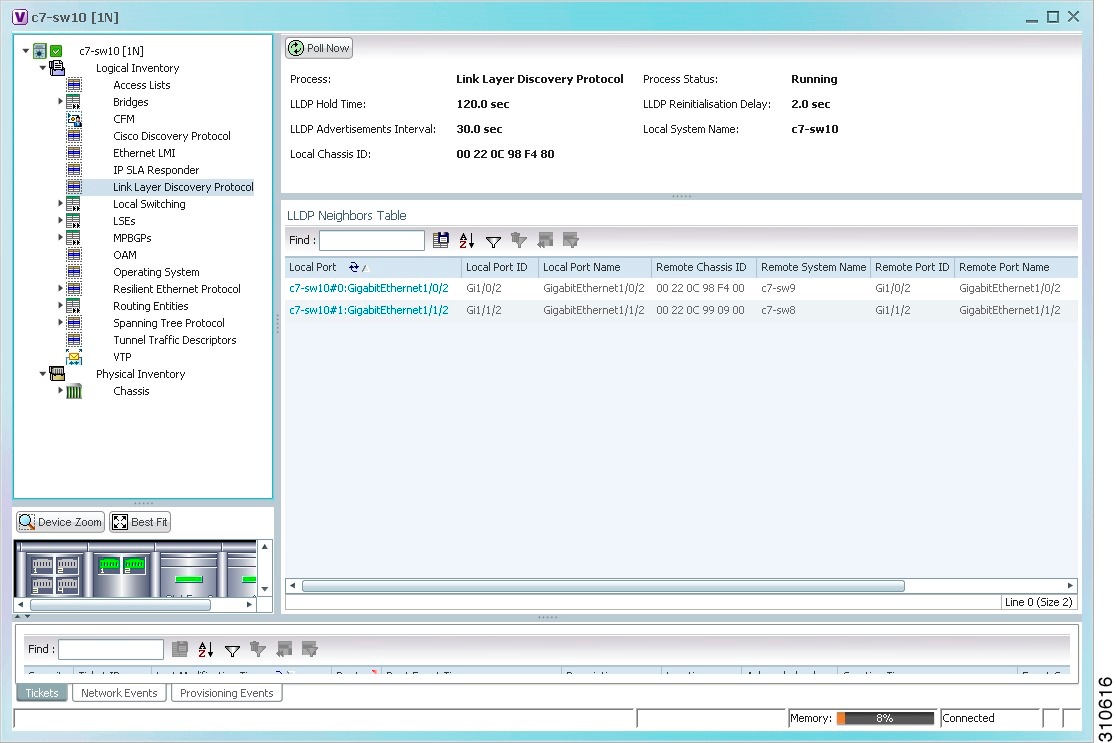
Table 13-4 describes the properties that are displayed for LLDP.
In Physical Inventory
To view LLDP on a Layer 2 port:
Step 1 ![]() In Prime Network Vision, double-click the device with the Layer 2 port with LLDP information you want to view.
In Prime Network Vision, double-click the device with the Layer 2 port with LLDP information you want to view.
Step 2 ![]() In the inventory window, select the required port under Physical Inventory.
In the inventory window, select the required port under Physical Inventory.
The LLDP information is displayed in the Discovery Protocols area in the Prime Network Vision content pane:
•![]() Discovery Protocol Type—LLDP
Discovery Protocol Type—LLDP
•![]() Info—Tx (Enabled or Disabled), Rx (Enabled or Disabled).
Info—Tx (Enabled or Disabled), Rx (Enabled or Disabled).
Viewing Spanning Tree Protocol Properties
Spanning Tree Protocol (STP) is a link management protocol that provides path redundancy while preventing undesirable loops in the network.
To view Spanning Tree properties:
Step 1 ![]() In Prime Network Vision, double-click the element whose STP properties you want to view.
In Prime Network Vision, double-click the element whose STP properties you want to view.
Step 2 ![]() In the inventory window, choose Logical Inventory > Spanning Tree Protocol.
In the inventory window, choose Logical Inventory > Spanning Tree Protocol.
Step 3 ![]() STP properties are displayed in logical inventory as shown in Figure 13-3.
STP properties are displayed in logical inventory as shown in Figure 13-3.
Figure 13-3 STP in Logical Inventory
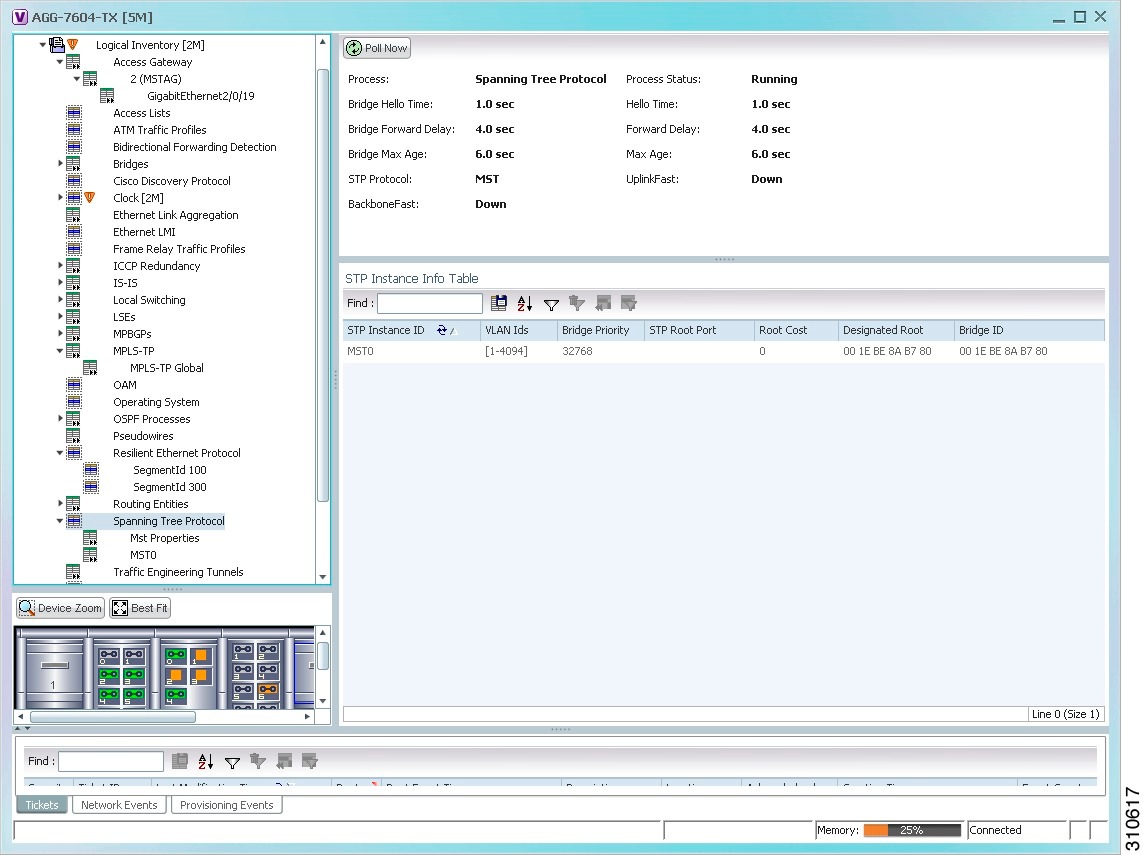
Table 13-5 describes the properties that are displayed for STP.
Step 4 ![]() To view the properties of an STP instance, do one of the following:
To view the properties of an STP instance, do one of the following:
•![]() Double-click the required instance.
Double-click the required instance.
•![]() Click the required entry in logical inventory under the Spanning Tree Protocol branch.
Click the required entry in logical inventory under the Spanning Tree Protocol branch.
Table 13-6 describes the information that is displayed in the STP Instance Information Properties window.
Step 5 ![]() To view MSTP properties, choose the required MSTP entry in logical inventory under Spanning Tree Protocol.
To view MSTP properties, choose the required MSTP entry in logical inventory under Spanning Tree Protocol.
Table 13-7 describes the information that is displayed for MSTP.
The following topics describe how to view STP properties related to:
•![]() VLAN domain views and overlays—See Viewing STP Information in VLAN Domain Views and VLAN Overlays.
VLAN domain views and overlays—See Viewing STP Information in VLAN Domain Views and VLAN Overlays.
•![]() VLAN service link properties—See Viewing STP Properties for VLAN Service Links.
VLAN service link properties—See Viewing STP Properties for VLAN Service Links.
Viewing Resilient Ethernet Protocol Properties
Cisco Resilient Ethernet Protocol (REP) technology is implemented on Cisco Carrier Ethernet switches and intelligent service edge routers. REP is a segment protocol, and a REP segment is a chain of ports connected to each other and configured with the same segment identifier. Each end of a segment terminates on an edge switch. The port where the segment terminates is called the edge port.
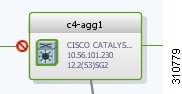
Cisco Prime Network discovers and displays REP Segments (identified by a REP segment identifier that is locally configured on the network element) along with Global REP configuration details.
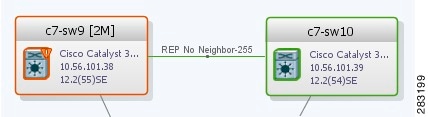
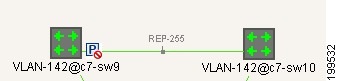
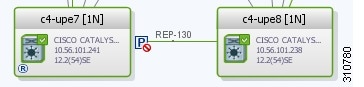
You can also view the REP port roles (open, alternate, and failed) in the Cisco Prime Network Vision map. The REP port role is displayed as a tool-tip between the REP enabled trunk ports in the Ethernet links. Using the Cisco Prime Network Vision map, you can identify if the segment is open or closed.
The map displays the forwarding direction (REP port roles) along the Physical links within VLAN overlays. It also displays the forwarding direction along the VLAN links among the switching elements within the VLAN logical domain topology.
REP implementation supports the following faults:
•![]() A REP Port Role change to Failed service event will be generated when a REP port role is change from Alternate or Open to Failed.
A REP Port Role change to Failed service event will be generated when a REP port role is change from Alternate or Open to Failed.
•![]() A REP Port Role change to OK clearing service event will be generated when a REP port role is change from Failed to Alternate or Open.
A REP Port Role change to OK clearing service event will be generated when a REP port role is change from Failed to Alternate or Open.
Correlation to these service events to physical layer events (for example Link down or Port down) is also performed.
You can view REP properties in logical inventory.
Step 1 ![]() In Prime Network Vision, double-click the device configured for REP.
In Prime Network Vision, double-click the device configured for REP.
Step 2 ![]() In the inventory window, choose Logical Inventory > Resilient Ethernet Protocol.
In the inventory window, choose Logical Inventory > Resilient Ethernet Protocol.
Figure 13-4 shows an example of REP in logical inventory.
Figure 13-4 REP in Logical Inventory
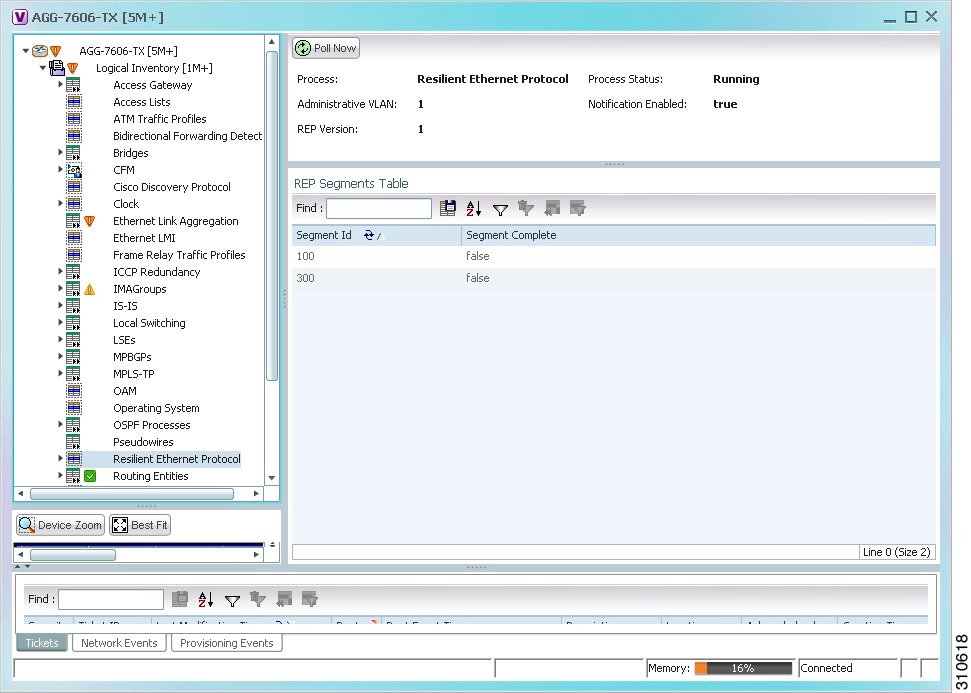
Table 13-8 describes the information that is displayed for REP.
Step 3 ![]() To view REP segment properties, double-click the required entry in the REP Segments table.
To view REP segment properties, double-click the required entry in the REP Segments table.
Figure 13-5 shows an example of REP segment properties in logical inventory.
Figure 13-5 REP Segment Properties
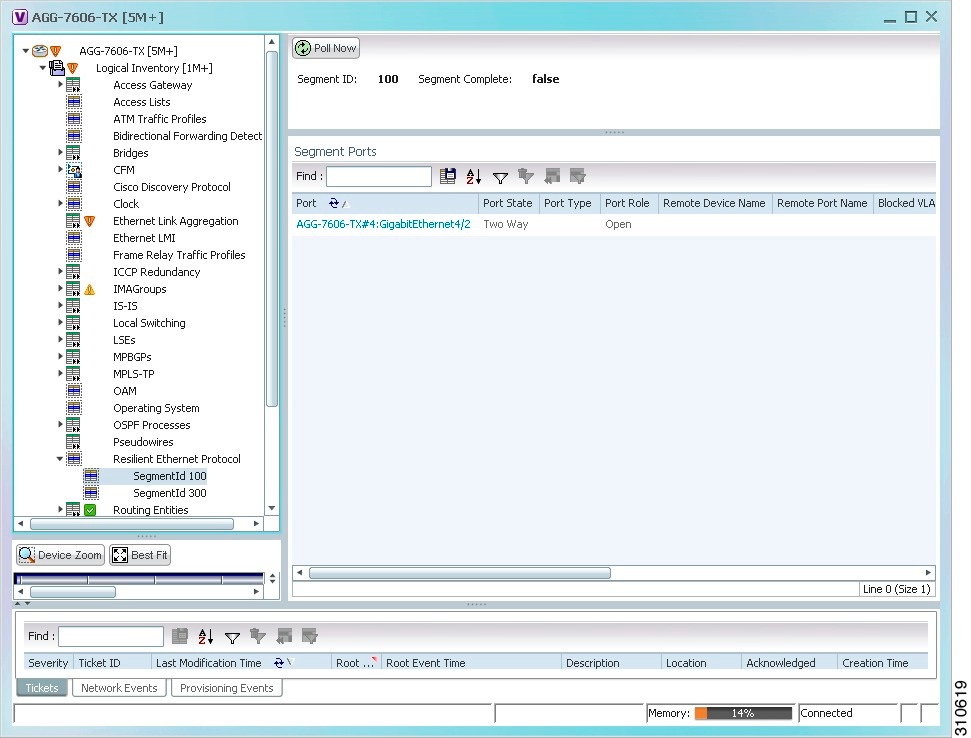
Table 13-9 describes the information that is displayed for REP segments.
The following topics describe how to view REP properties related to VLANs:
•![]() VLAN domain views and overlays—See Viewing REP Information in VLAN Domain Views and VLAN Overlays.
VLAN domain views and overlays—See Viewing REP Information in VLAN Domain Views and VLAN Overlays.
•![]() VLAN service link properties—See Viewing REP Properties for VLAN Service Links.
VLAN service link properties—See Viewing REP Properties for VLAN Service Links.
Viewing HSRP Properties
Hot Standby Router Protocol (HSRP) is a protocol that provides backup to a router in case of failure. Using HSRP, several routers are connected to the same Ethernet network segment and work together to present the appearance of a single virtual router. The routers share the same IP and MAC addresses; therefore in the event of failure of one router, the hosts on the LAN will be able to continue forwarding packets to a consistent IP and MAC address.
HSRP groups are configured on IP interfaces. An IP interface is modeled by the VNE through the IPInterface DC. The IPInterface DC maintains the HSRP related information by the use of HSRP group entries. Ethernet DCs, which are used to model Ethernet ports, maintain MAC addresses of the HSRP groups.
To view HSRP properties:
Step 1 ![]() Double-click the required element in Prime Network Vision.
Double-click the required element in Prime Network Vision.
Step 2 ![]() In logical inventory, choose Logical Inventory > Routing Entities > Routing Entity.
In logical inventory, choose Logical Inventory > Routing Entities > Routing Entity.
Step 3 ![]() In the IP Interfaces tab, double-click the required interface to view the IP interface properties. If HSRP is configured on the IP interface, the HSRP Group tab is displayed as shown in Figure 13-6.
In the IP Interfaces tab, double-click the required interface to view the IP interface properties. If HSRP is configured on the IP interface, the HSRP Group tab is displayed as shown in Figure 13-6.
Figure 13-6 HSRP Group Information
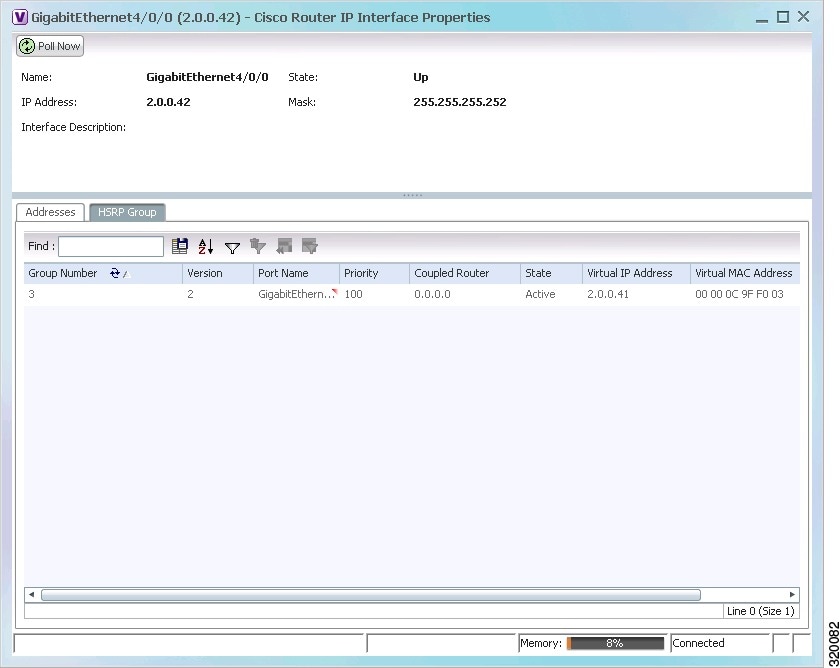
Table 13-10 describes the information in the HSRP Group tab.
Viewing Access Gateway Properties
In an access network, an access gateway configuration ensures loop-free connectivity in the event of various failures by sending statically configured bridge protocol data units (BPDUs) toward the access network. Using statically configured BPDUs enables the gateway device to act appropriately when notified of the following topology changes:
•![]() Failure of a link in the access network.
Failure of a link in the access network.
•![]() Failure of a link between the access network and the gateway device.
Failure of a link between the access network and the gateway device.
•![]() Failure of an access device.
Failure of an access device.
•![]() Failure of a gateway device.
Failure of a gateway device.
To view access gateway properties:
Step 1 ![]() Double-click the element configured for access gateway.
Double-click the element configured for access gateway.
Step 2 ![]() In the inventory window, choose Logical Inventory > Access Gateway > access-gateway. The group name is appended by either MSTAG or REPAG, indicating the group type Multiple Spanning Tree Access Gateway or Resilient Ethernet Protocol Access Gateway.
In the inventory window, choose Logical Inventory > Access Gateway > access-gateway. The group name is appended by either MSTAG or REPAG, indicating the group type Multiple Spanning Tree Access Gateway or Resilient Ethernet Protocol Access Gateway.
Figure 13-7 shows an example of an access gateway entry in logical inventory.
Figure 13-7 Access Gateway in Logical Inventory
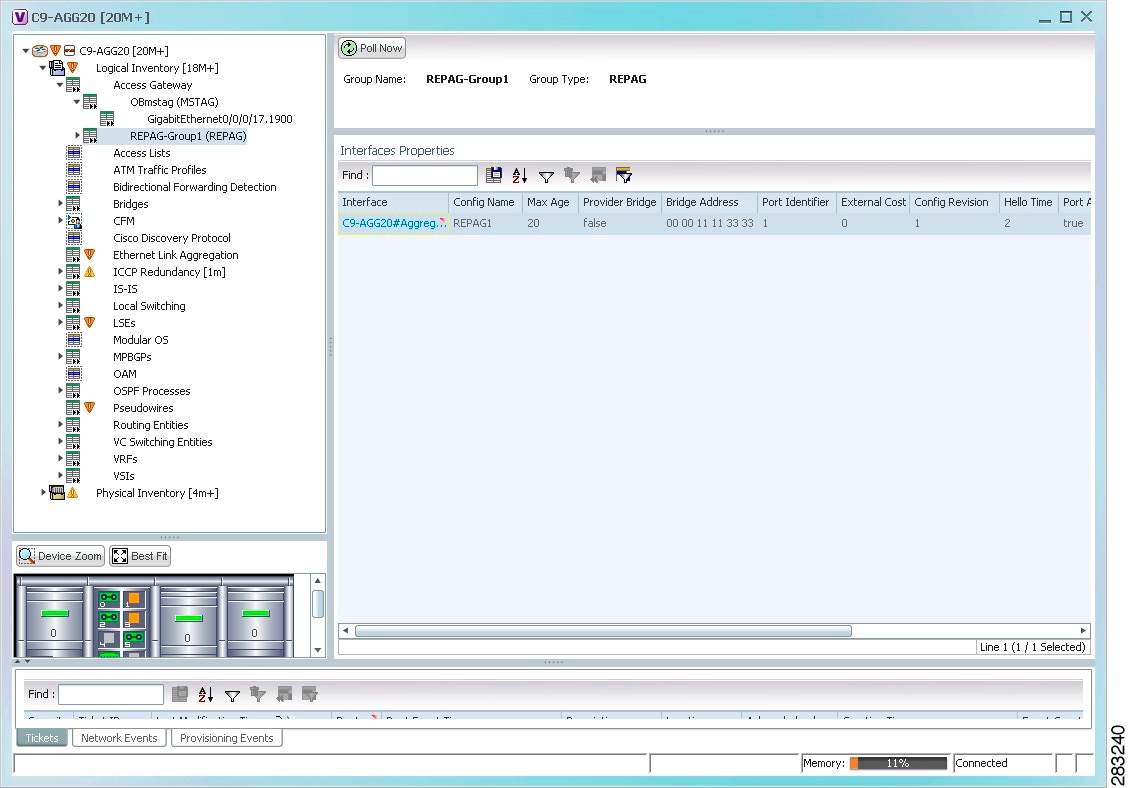
Table 13-11 describes the information that is displayed for an access gateway.
Step 3 ![]() Choose an access gateway instance to view instance properties.
Choose an access gateway instance to view instance properties.
Figure 13-8 shows an example of the information displayed for an access gateway instance.
Figure 13-8 Access Gateway Instance in Logical Inventory
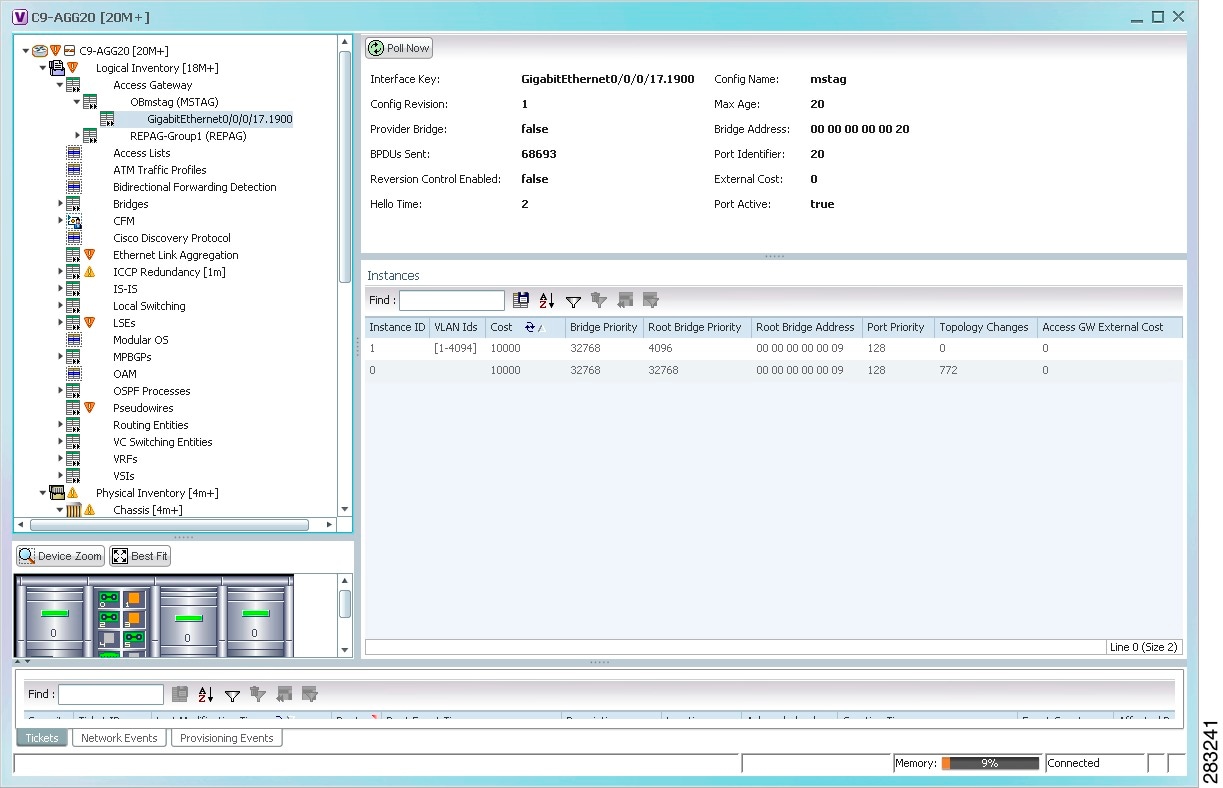
Table 13-12 describes the information that is displayed for an access gateway instance.
Working with Ethernet Link Aggregation Groups
Ethernet link aggregation groups (LAGs) provide the ability to treat multiple switch ports as one switch port. The port groups act as a single logical port for high-bandwidth connections between two network elements. A single link aggregation group balances the traffic load across the links in the channel.
LAG links are discovered automatically for devices that support LAG technology and use VNEs that model Link Aggregation Control Protocol (LACP) attributes.
You can create static links between Ethernet LAGs by choosing a LAG and the desired port channel for the A or Z side as described in Adding Static Links.
If a physical link within the link aggregation group fails, the following actions occur:
•![]() Traffic that was previously carried over the failed link is moved to the remaining links.
Traffic that was previously carried over the failed link is moved to the remaining links.
Most protocols operate over single ports or aggregated switch ports and do not recognize the physical ports within the port group.
•![]() An aggregation service alarm is generated.
An aggregation service alarm is generated.
The aggregation service alarm indicates the percentage of links within the aggregation that have failed. For example, if an Ethernet link aggregation group contains four Ethernet links and one fails, the aggregation service alarm indicates that 25% of the links are down.
Viewing Ethernet LAG Properties

Note ![]() Cisco CRS devices must be configured to receive SNMP traps in order to view Ethernet LAG properties. For more information on required SNMP settings, see the Cisco Prime Network 3.10 Administrator Guide.
Cisco CRS devices must be configured to receive SNMP traps in order to view Ethernet LAG properties. For more information on required SNMP settings, see the Cisco Prime Network 3.10 Administrator Guide.
To view properties for Ethernet link aggregation groups:
Step 1 ![]() In Prime Network Vision, double-click the device with the link aggregation group you want to view.
In Prime Network Vision, double-click the device with the link aggregation group you want to view.
Step 2 ![]() In the inventory window, choose Logical Inventory > Ethernet Link Aggregation.
In the inventory window, choose Logical Inventory > Ethernet Link Aggregation.
The link aggregation properties are displayed as shown in Figure 13-9.
Figure 13-9 Ethernet Link Aggregation in Logical Inventory
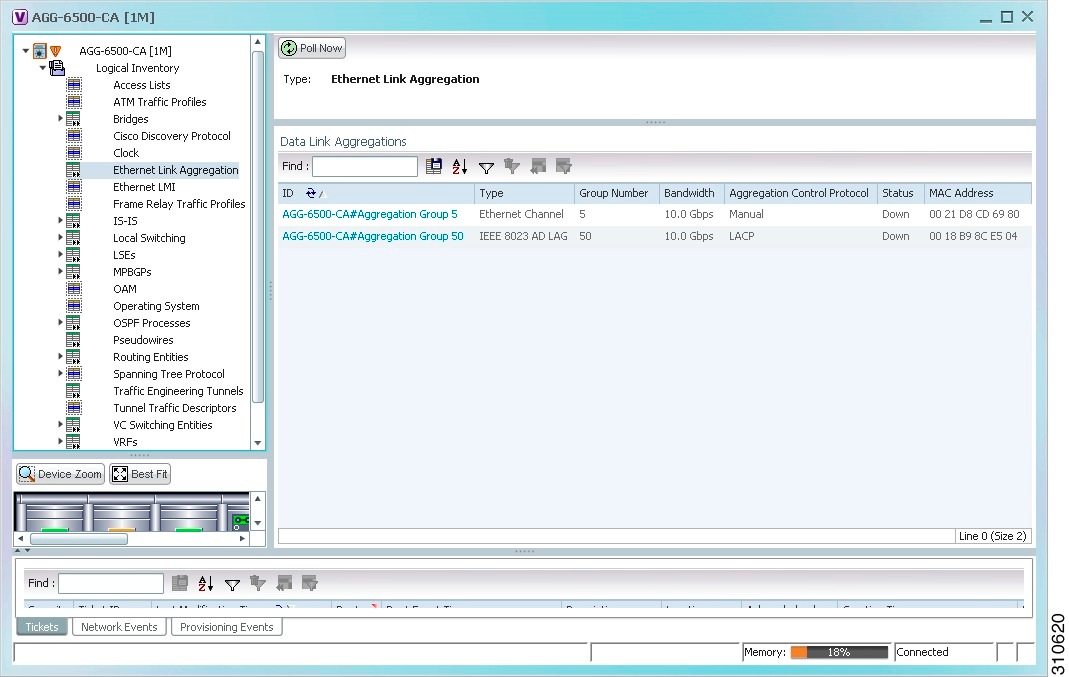
Table 13-13 describes the aggregation group properties that are displayed in the Data Link Aggregations table.
Step 3 ![]() To view properties for a specific aggregation, double-click the group identifier.
To view properties for a specific aggregation, double-click the group identifier.
The information that is displayed depends on the type of aggregation:
•![]() For Ethernet Channel aggregations, see Table 13-14.
For Ethernet Channel aggregations, see Table 13-14.
•![]() For IEEE 802.3 AD aggregations, see Table 13-15.
For IEEE 802.3 AD aggregations, see Table 13-15.
Viewing mLACP Properties
Prime Network Vision supports the discovery of Multichassis LACP (mLACP) configurations on devices configured for them, and displays mLACP configuration information, such as redundancy groups and properties, in inventory.
To view mLACP properties:
Step 1 ![]() In Prime Network Vision, double-click the element configured for mLACP.
In Prime Network Vision, double-click the element configured for mLACP.
Step 2 ![]() In the inventory window, choose Logical Inventory > ICCP Redundancy.
In the inventory window, choose Logical Inventory > ICCP Redundancy.
In response, Prime Network Vision lists the Inter-Chassis Communication Protocol (ICCP) redundancy groups configured on the device as shown in Figure 13-10.
Figure 13-10 ICCP Redundancy in Logical Inventory
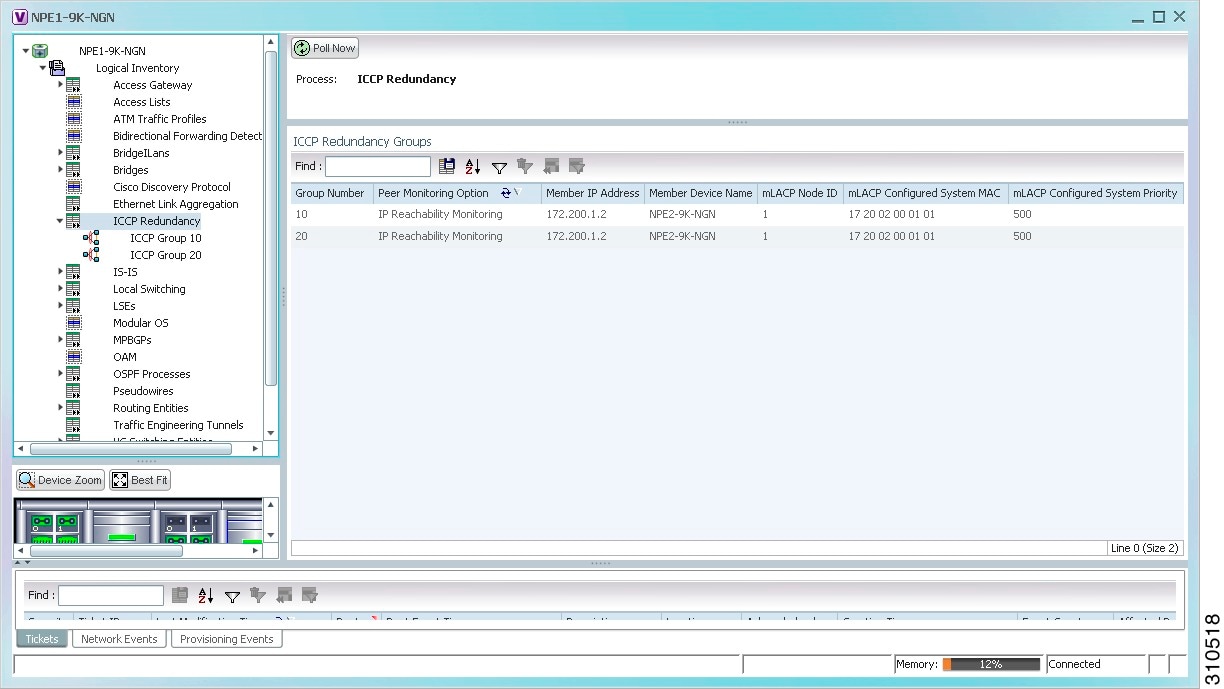
Table 13-16 describes the information displayed in the ICCP Redundancy Groups table.
Step 3 ![]() To view additional information about an ICCP redundancy group, do either of the following:
To view additional information about an ICCP redundancy group, do either of the following:
•![]() In the logical inventory window navigation pane, choose Logical Inventory ICCP Redundancy > ICCP-group.
In the logical inventory window navigation pane, choose Logical Inventory ICCP Redundancy > ICCP-group.
•![]() In the logical inventory content pane, right-click the required group in the ICCP Redundancy Groups table and choose Properties.
In the logical inventory content pane, right-click the required group in the ICCP Redundancy Groups table and choose Properties.
The ICCP Redundancy Group Properties window is displayed with the Backbone Interfaces and Data Link Aggregations tabs as shown in Figure 13-11.
Figure 13-11 ICCP Redundancy Group Properties Window
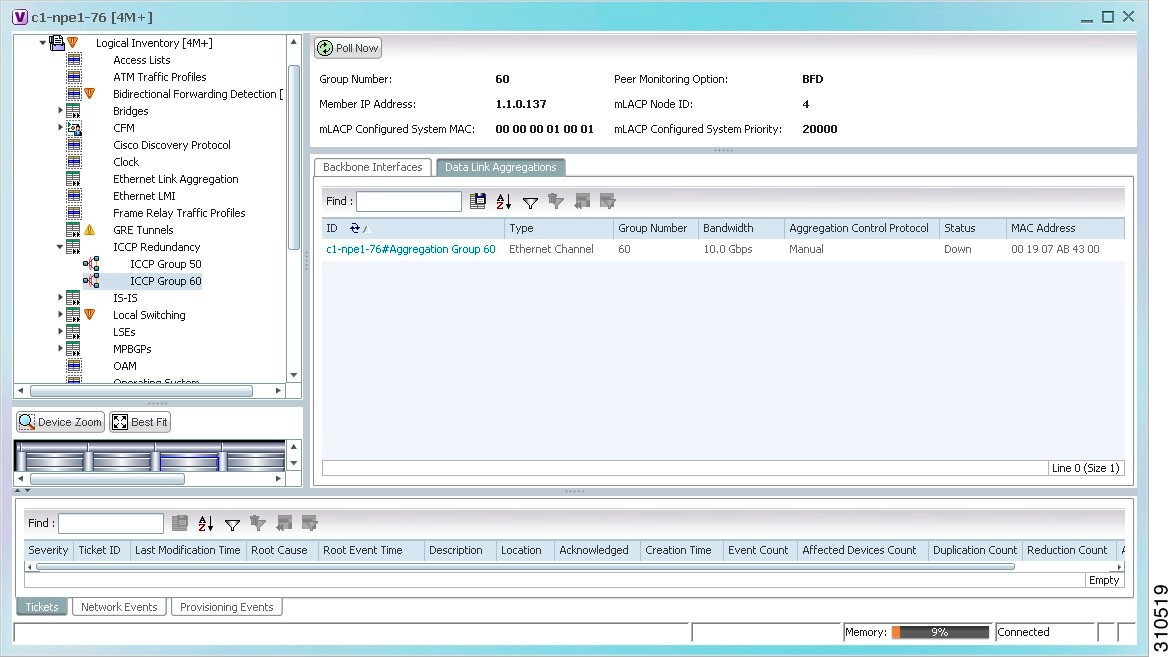
Table 13-17 describes the information available in the ICCP Redundancy Group Properties window.
Step 4 ![]() To view additional mLACP properties, double-click the entry for the required link aggregation group in the Data Link Aggregations tab.
To view additional mLACP properties, double-click the entry for the required link aggregation group in the Data Link Aggregations tab.
mLACP information is displayed in the Link Aggregation Group Properties window, as described in the following tables:
•![]() Table 13-14—LAG Ethernet Channel Properties
Table 13-14—LAG Ethernet Channel Properties
•![]() Table 13-15—LAG IEEE 802.3 AD Properties
Table 13-15—LAG IEEE 802.3 AD Properties
Viewing Provider Backbone Bridge Properties
Provider backbone bridges (PBBs), specified by IEEE 802.1ah-2008, provide a way to increase the number of service provider supported Layer 2 service instances beyond the number supported by QinQ and VPLS. PBB adds a backbone VLAN tag and backbone destination and source MAC addresses to encapsulate customer Ethernet frames and create a MAC tunnel across core switches.
Prime Network supports PBB inventory discovery and modeling for the following devices:
•![]() Cisco 7600-series devices running Cisco IOS version 12.2(33)SRE1
Cisco 7600-series devices running Cisco IOS version 12.2(33)SRE1
•![]() Cisco ASR 9000-series devices running Cisco IOS XR version 3.9.1
Cisco ASR 9000-series devices running Cisco IOS XR version 3.9.1
Prime Network models the IB type of Backbone edge bridges which includes both I-type and B-type components.
To view PBB properties:
Step 1 ![]() In Prime Network Vision, double-click the element configured for PBB.
In Prime Network Vision, double-click the element configured for PBB.
Step 2 ![]() In the inventory window, choose Logical Inventory > BridgeILans > PBB-bridge.
In the inventory window, choose Logical Inventory > BridgeILans > PBB-bridge.
Figure 13-12 shows an example of PBB properties in logical inventory.
Figure 13-12 PBB Properties in Logical Inventory
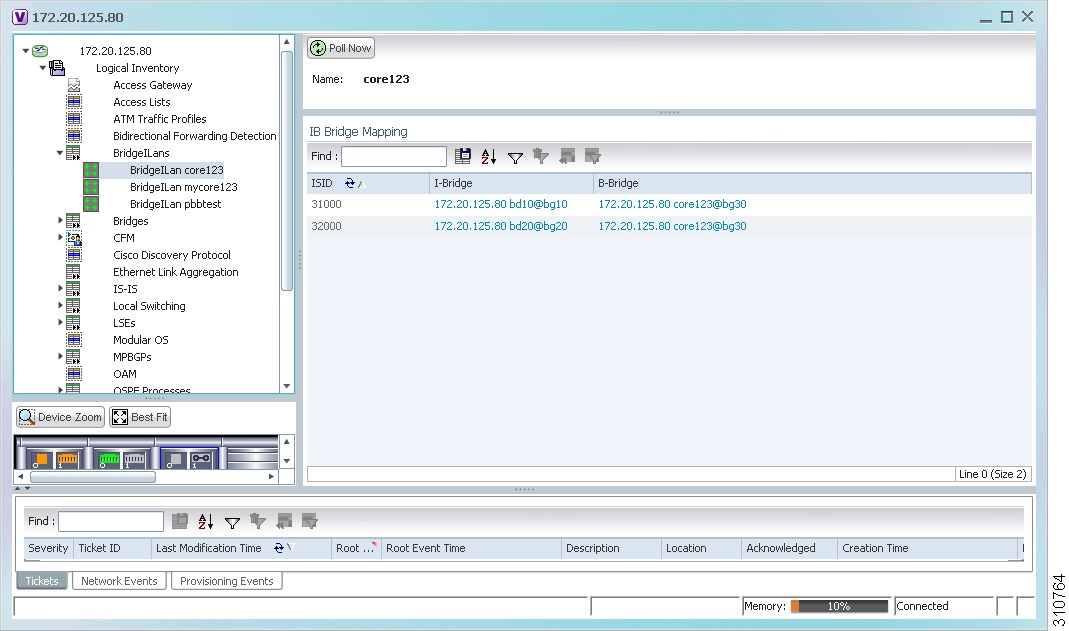
Table 13-18 describes the information displayed for PBB.
Viewing EFP Properties
Prime Network Vision provides information about EFPs in a number of ways. For example:
•![]() EFP names displayed in Prime Network Vision maps add EFP and the managed element name to the interface name, such as GigabitEthernet4/0/1 EFP: 123@c4-npe5-67.
EFP names displayed in Prime Network Vision maps add EFP and the managed element name to the interface name, such as GigabitEthernet4/0/1 EFP: 123@c4-npe5-67.
•![]() If you select an EFP in the navigation pane in Prime Network Vision and then click Show List View, an Ethernet Flow Points table lists the network element, port, and network VLAN associated with the EFP.
If you select an EFP in the navigation pane in Prime Network Vision and then click Show List View, an Ethernet Flow Points table lists the network element, port, and network VLAN associated with the EFP.
To view additional EFP properties:
Step 1 ![]() In the Prime Network Vision map view, select the required EFP in the navigation pane or in the map pane and then do either of the following:
In the Prime Network Vision map view, select the required EFP in the navigation pane or in the map pane and then do either of the following:
•![]() Right-click the EFP and choose Properties.
Right-click the EFP and choose Properties.
•![]() Choose Node > Properties.
Choose Node > Properties.
Figure 13-13 shows an example of the EFP Properties window.
Figure 13-13 EFP Properties Window
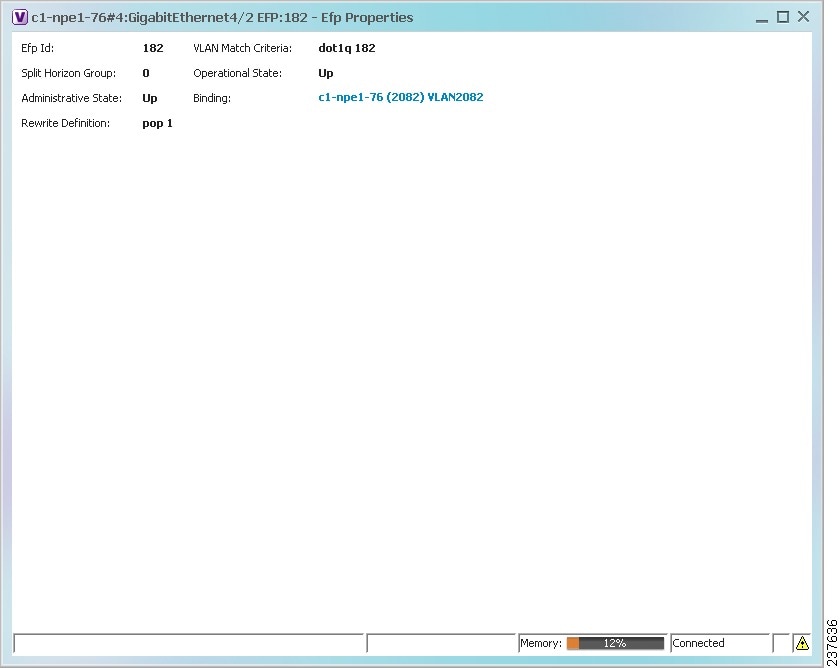
Table 13-19 describes the information displayed in the EFP Properties window.
Step 2 ![]() Click the hyperlink entry in the Binding field to view the related properties in logical inventory.
Click the hyperlink entry in the Binding field to view the related properties in logical inventory.
In this example, clicking the hyperlink displays the relevant bridge in logical inventory, as shown in Figure 13-14.
Figure 13-14 Bridge Associated with EFP in Logical Inventory
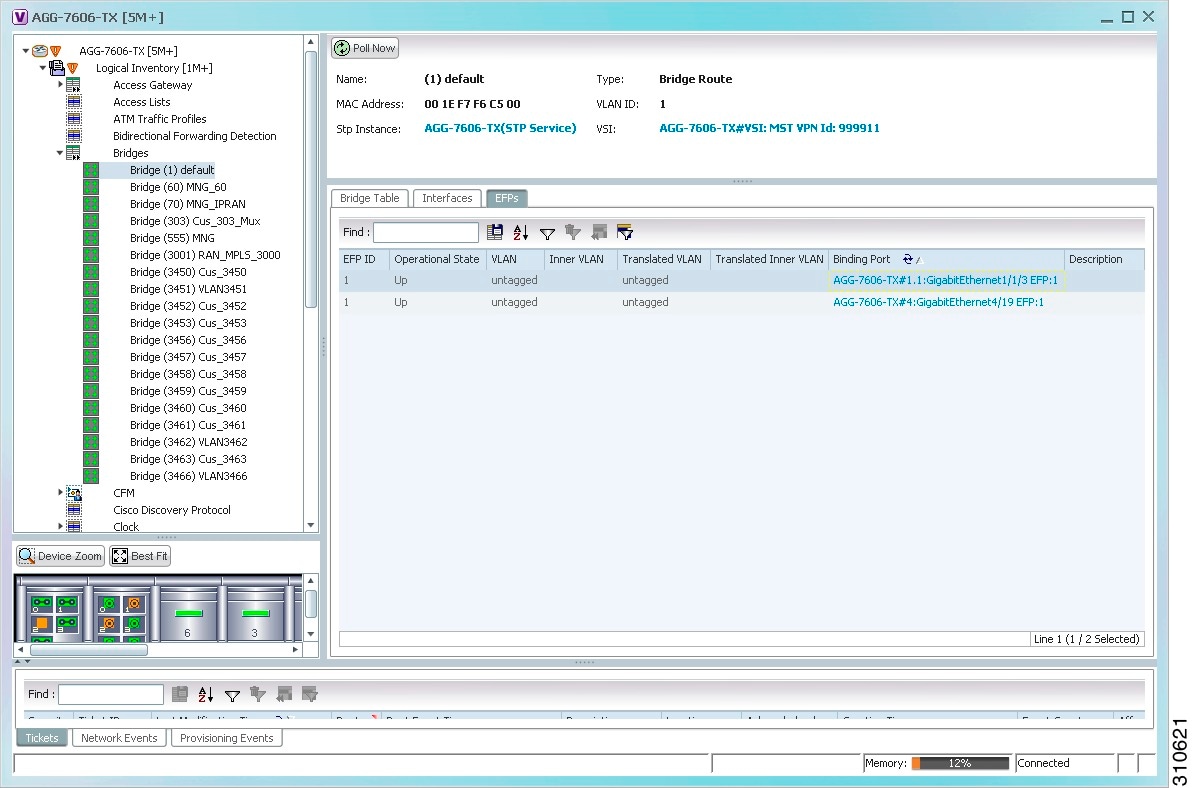
Table 13-20 describes the information displayed for an EFP associated with a bridge.
Step 3 ![]() To view EFP properties in physical inventory, navigate to the required interface in one of the following ways:
To view EFP properties in physical inventory, navigate to the required interface in one of the following ways:
•![]() In the bridge entry in logical inventory, click the hyperlinked entry in the Binding field.
In the bridge entry in logical inventory, click the hyperlinked entry in the Binding field.
•![]() Use the procedure described in Viewing and Renaming Ethernet Flow Domains to navigate to the individual interface.
Use the procedure described in Viewing and Renaming Ethernet Flow Domains to navigate to the individual interface.
•![]() In physical inventory, navigate to and then select the required interface.
In physical inventory, navigate to and then select the required interface.
The EFPs tab is displayed in the content pane next to the Subinterfaces tab as shown in Figure 13-15.
Figure 13-15 EFPs Tab in Physical Inventory
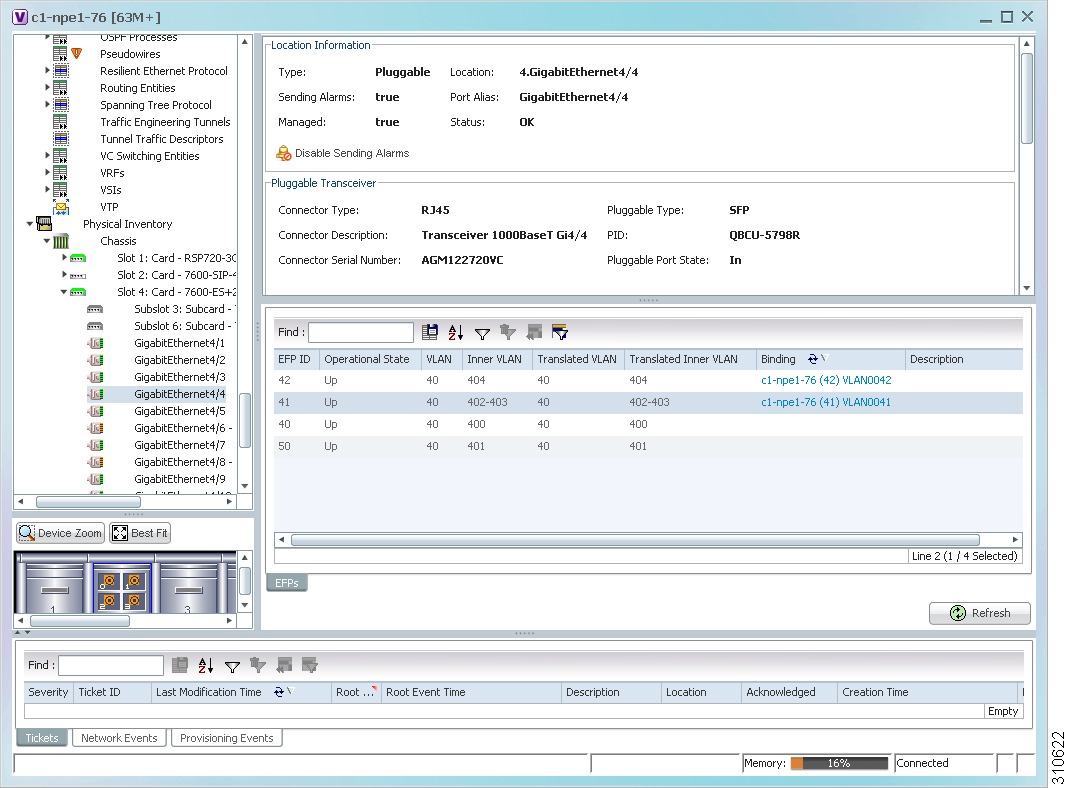
Table 13-21 describes the information displayed in the EFPs tab.
Connecting a Network Element to an EFP
You can add and connect network elements to an EFP under an existing aggregation for VLAN, VPLS, Pseudowire, and Ethernet Service.
To connect network elements to an EFP:
Step 1 ![]() Select an EFP node under the VLAN/VPLS/Pseudowire/Ethernet Service aggregation node and choose File > Add to Map > Network Element.
Select an EFP node under the VLAN/VPLS/Pseudowire/Ethernet Service aggregation node and choose File > Add to Map > Network Element.
Step 2 ![]() In the Add Network Element dialog box, search for the desired network elements and choose the network element that you want to add.
In the Add Network Element dialog box, search for the desired network elements and choose the network element that you want to add.
The selected network element appears under the aggregation node in the navigation pane.
Step 3 ![]() Right-click the EFP node and choose Topology > Connect CE Device.
Right-click the EFP node and choose Topology > Connect CE Device.
Step 4 ![]() Right-click the network element that you added and choose Topology > Connect to EFP.
Right-click the network element that you added and choose Topology > Connect to EFP.
The map view displays a link between the EFP and the added network element. If required, you can remove the link, by right-clicking the link and choosing Remove Link.
Step 5 ![]() To hide or show the connected network elements, right-click the EFP node and choose Hide Connected Devices or Show CE device.
To hide or show the connected network elements, right-click the EFP node and choose Hide Connected Devices or Show CE device.
Understanding EFP Severity and Ticket Badges
Severity and ticket badges are displayed on EFP icons as follows:
•![]() If the VLAN EFP element represents a configuration, such as a service instance on a Cisco 7600 device or an enhanced port on a Cisco ASR 9000 device, and is associated directly with a network VLAN or a bridge domain switching entity, the severity and ticket badges are based on the underlying service instance or enhanced port configuration.
If the VLAN EFP element represents a configuration, such as a service instance on a Cisco 7600 device or an enhanced port on a Cisco ASR 9000 device, and is associated directly with a network VLAN or a bridge domain switching entity, the severity and ticket badges are based on the underlying service instance or enhanced port configuration.
Figure 13-16 shows an example of a ticket badge based on a service instance.
Figure 13-16 EFP Severity and Ticket Badges Based on Underlying Service Instance
•![]() If the Ethernet flow point element represents a VLAN interface for a regular switch port, the severity and ticket badges are based on the corresponding port, as shown in Figure 13-17.
If the Ethernet flow point element represents a VLAN interface for a regular switch port, the severity and ticket badges are based on the corresponding port, as shown in Figure 13-17.
Figure 13-17 EFP Severity and Ticket Badges Based on Corresponding Port
Viewing EVC Service Properties
Certain EVC service properties are configured as port attributes. These attributes determine the degree of service transparency and protect the service provider's network from protocol control traffic. Prime Network Vision discovers these key EVC service properties and displays this information in physical inventory for the following devices:
•![]() Cisco ME3400- and Cisco ME3400E-series devices running Cisco IOS versions 12.2(52)SE to 12.2(54)SE.
Cisco ME3400- and Cisco ME3400E-series devices running Cisco IOS versions 12.2(52)SE to 12.2(54)SE.
•![]() Cisco 3750 Metro devices running Cisco IOS versions 12.2(52)SE to 12.2(54)SE.
Cisco 3750 Metro devices running Cisco IOS versions 12.2(52)SE to 12.2(54)SE.
Shared Switching Entities and EVC Service View
Some switching entities that Prime Network Vision discovers are concurrently part of a network VLAN and VPLS/EoMPLS instance. These switching entities are referred to as shared switching entities.
Prime Network Vision displays the switching entity information for shared switching entities only under the VPLS instances in the EVC service view.
To view EVC port-related properties for the supported devices and software versions:
Step 1 ![]() In Prime Network Vision, double-click the required device.
In Prime Network Vision, double-click the required device.
Step 2 ![]() In the inventory window, choose Physical Inventory > Chassis > module > port.
In the inventory window, choose Physical Inventory > Chassis > module > port.
Figure 13-18 shows an example of a port in physical inventory configured with these EVC properties.
Figure 13-18 EVC Port Properties in Physical Inventory
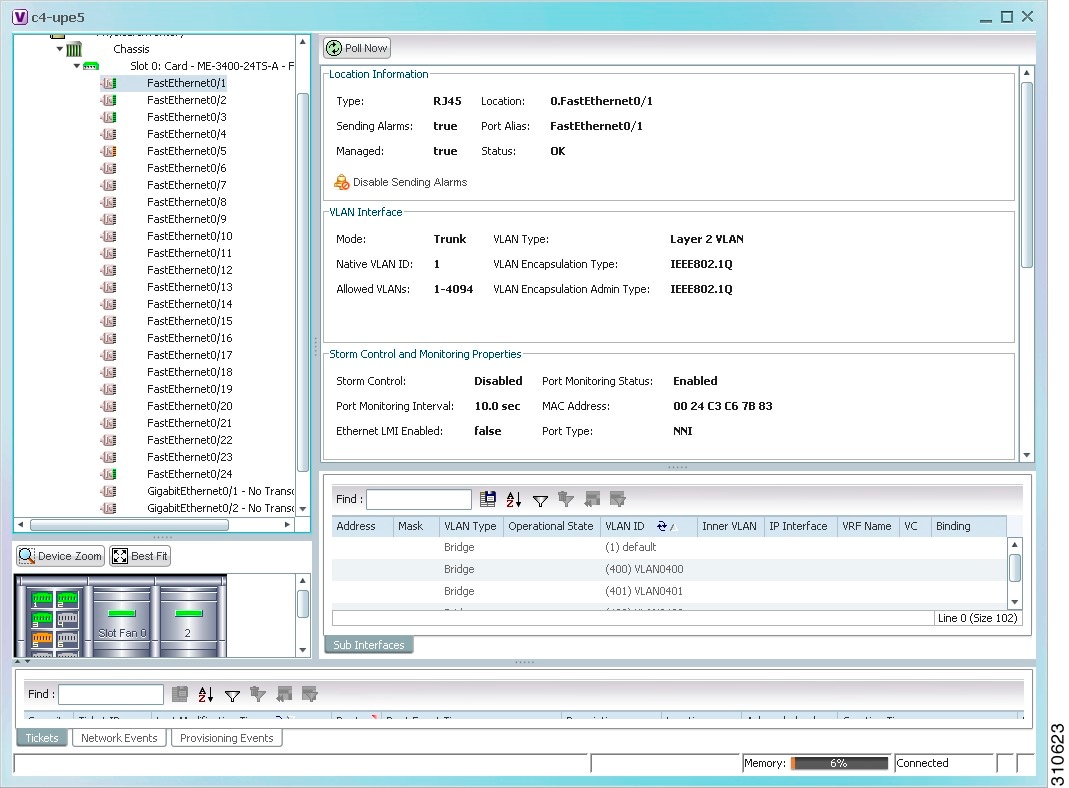
Table 13-22 describes the information displayed for these properties.
Viewing and Renaming Ethernet Flow Domains
An Ethernet flow domain represents an Ethernet access domain. The Ethernet flow domain holds all network elements between the CE (inclusive, if managed by the SP), up to the SP core (exclusive). This includes CE, access, aggregation, and distribution network elements.
An Ethernet flow domain can have no N-PEs (flat VLAN) or one or more N-PEs (N-PE redundancy configuration). The Ethernet flow domain is defined using physical connectivity at the port level, and not at the network element level. STP is used to mark the root bridge, root or blocked ports, and blocked VLAN links.
To view Ethernet flow domains:
Step 1 ![]() In Prime Network Vision, choose Network Inventory > Ethernet Flow Domains.
In Prime Network Vision, choose Network Inventory > Ethernet Flow Domains.
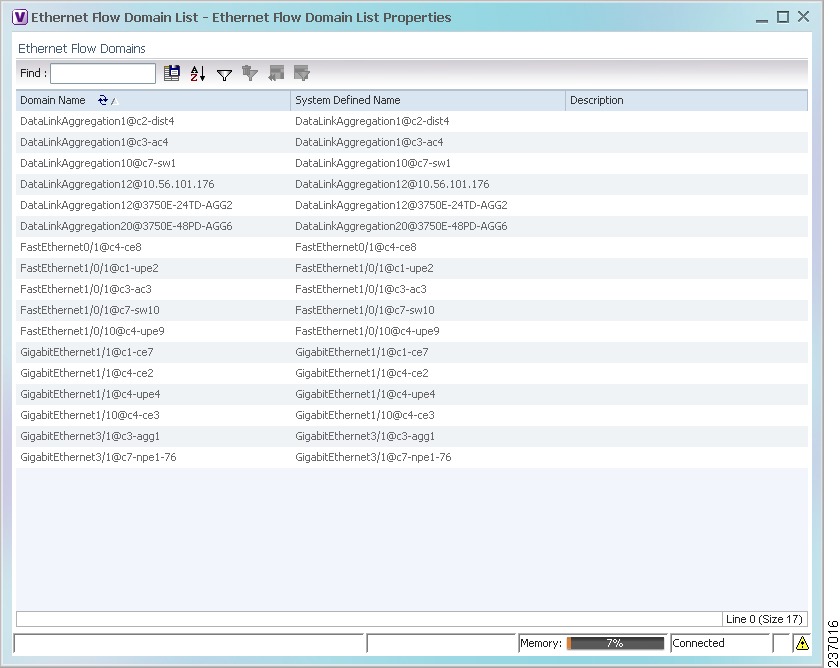
The Ethernet Flow Domain List window is displayed with the domain name, the system-defined domain name, and a brief description for each Ethernet flow domain as shown in Figure 13-19.
Figure 13-19 Ethernet Flow Domain List Properties Window
Step 2 ![]() To rename an Ethernet flow domain:
To rename an Ethernet flow domain:
a. ![]() Right-click the required domain, then choose Rename.
Right-click the required domain, then choose Rename.
b. ![]() In the Rename Node dialog box, enter a new name for the domain.
In the Rename Node dialog box, enter a new name for the domain.
c. ![]() Click OK.
Click OK.
The window is refreshed, and the new name is displayed.
Step 3 ![]() To view Ethernet flow domain properties, do either of the following:
To view Ethernet flow domain properties, do either of the following:
•![]() Right-click the required domain, then choose Properties.
Right-click the required domain, then choose Properties.
•![]() Double-click the required domain.
Double-click the required domain.
The Ethernet Flow Domain Properties window is displayed as shown in Figure 13-20.
Figure 13-20 Ethernet Flow Domain Properties Window
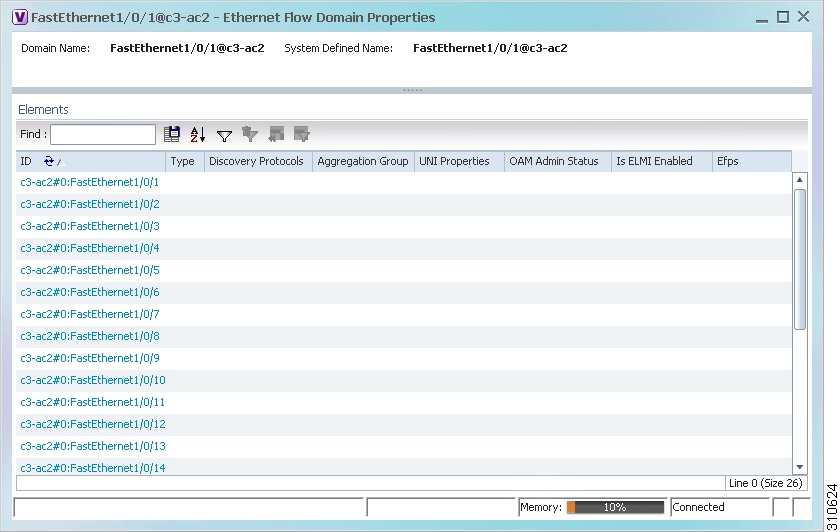
Table 13-23 describes the information displayed in the Ethernet Flow Domain Properties window.
Note ![]() Not all fields are available in all tables. The table contents depend on the domain type, such as FastEthernet.
Not all fields are available in all tables. The table contents depend on the domain type, such as FastEthernet.
Step 4 ![]() To navigate to the individual interface or link aggregation group, click an interface identifier or group.
To navigate to the individual interface or link aggregation group, click an interface identifier or group.
The interface or link aggregation group properties are displayed in the inventory window.
Working with VLANs and VLAN Overlays
The following topics provide information and procedures for working with VLANs and VLAN overlays:
•![]() Understanding VLAN and EFD Discovery
Understanding VLAN and EFD Discovery
•![]() Switching Entities Containing Termination Points
Switching Entities Containing Termination Points
•![]() Working with Associated VLANs
Working with Associated VLANs
•![]() Viewing VLAN Links Between VLAN Elements and Devices
Viewing VLAN Links Between VLAN Elements and Devices
•![]() Displaying or Hiding VLAN Overlays
Displaying or Hiding VLAN Overlays
•![]() Viewing VLAN Service Link Properties
Viewing VLAN Service Link Properties
•![]() Viewing REP Information in VLAN Domain Views and VLAN Overlays
Viewing REP Information in VLAN Domain Views and VLAN Overlays
•![]() Viewing REP Properties for VLAN Service Links
Viewing REP Properties for VLAN Service Links
•![]() Viewing STP Information in VLAN Domain Views and VLAN Overlays
Viewing STP Information in VLAN Domain Views and VLAN Overlays
•![]() Viewing STP Properties for VLAN Service Links
Viewing STP Properties for VLAN Service Links
•![]() Viewing VLAN Trunk Group Properties
Viewing VLAN Trunk Group Properties
•![]() Viewing VLAN Bridge Properties
Viewing VLAN Bridge Properties
Understanding VLAN and EFD Discovery
When you start the Prime Network gateway the first time, Prime Network Vision waits for two topology cycles to complete before discovering new VLANs, VLAN associations, and EFDs. The default configured time for two topology cycles to complete is one hour, but might be configured for longer periods of time on large setups. This delay allows the system to stabilize, and provides the time needed to model devices and discover links.
During this delay, Prime Network Vision does not add VNEs or apply updates to existing VLANs or EFDs.
After the initial delay has passed, Prime Network Vision discovers new VLANs, VLAN associations, and EFDs, applies updates to existing VLANs, VLAN associations, and EFDs, and updates the database accordingly.
When you restart the gateway, Prime Network Vision uses the persisted topology information instead of waiting two topology cycles, thus improving the discovery time for new VLANs, VLAN associations, and EFDs.
Understanding VLAN Elements
The following concepts are important to understand when working with the representation of edge EFPs inside VLANs:
•![]() VLAN Elements in Prime Network Vision
VLAN Elements in Prime Network Vision
VLAN Elements in Prime Network Vision
Table 13-24 describes the icons that Prime Network Vision uses to represent VLAN elements.
|
|
|
|
|---|---|---|
Network VLAN |
None |

|
Switching entity |
Bridge |

|
Ethernet Flow Point (EFP) |
Ethernet port |

|
VLANs
Prime Network Vision discovers and allows you to display maps with a network-level view of VLANs.
In Prime Network, a VLAN entity consists of one or more switching entities and the corresponding EFP elements.
A network VLAN represents the virtual LAN. The network VLAN holds its contained switching entities and can be associated to a customer. The network VLAN also holds the Ethernet flow points that are part of the network VLAN but not part of any switching entity. For example, a port that tags ingress flows after which the flow moves to a different VLAN.
Switching Entities
A switching entity represents a device-level Layer 2 forwarding entity (such as a VLAN or bridge domain) that participates in a network VLAN. A switching entity is associated to a network VLAN according to its relationship to the same Ethernet Flow Domain (EFD) and the VLAN identifier.
If you right-click a switching entity in Prime Network Vision and then choose Inventory, the inventory window is displayed with the corresponding bridge selected in Logical Inventory.
A switching entity typically contains EFP elements.
Ethernet Flow Points
An Ethernet flow point (EFP) can represent a port that is configured for participation in a specific VLAN.
If you right-click an EFP in Prime Network Vision and then choose Inventory, the inventory window is displayed with the corresponding port selected in Physical Inventory.
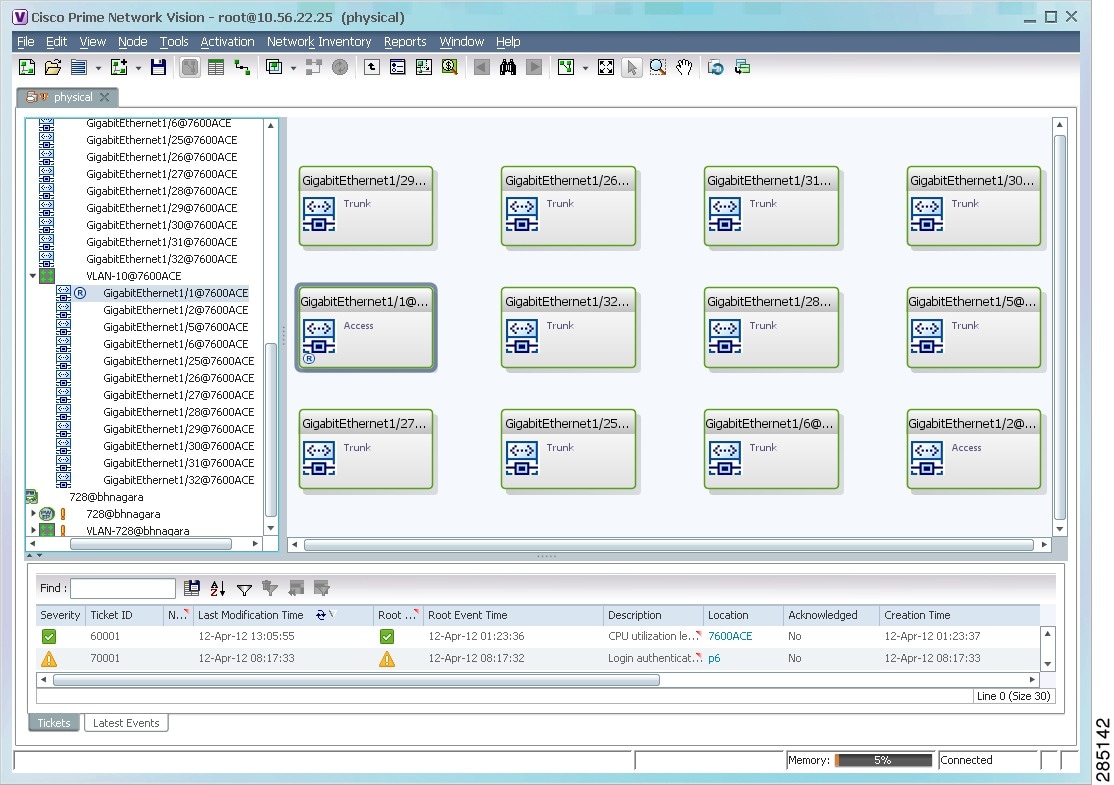
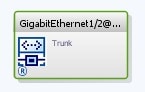
EFPs that are located in a switching entity represent Ethernet ports that are configured as switch ports (in either Access, Trunk, or Dot1Q tunnel mode).
Figure 13-21 shows an example of EFPs configured as switch ports in Prime Network Vision.
Figure 13-21 EFPs Configured as Switch Ports
EFPs that are located directly inside a VLAN represent one of the following:
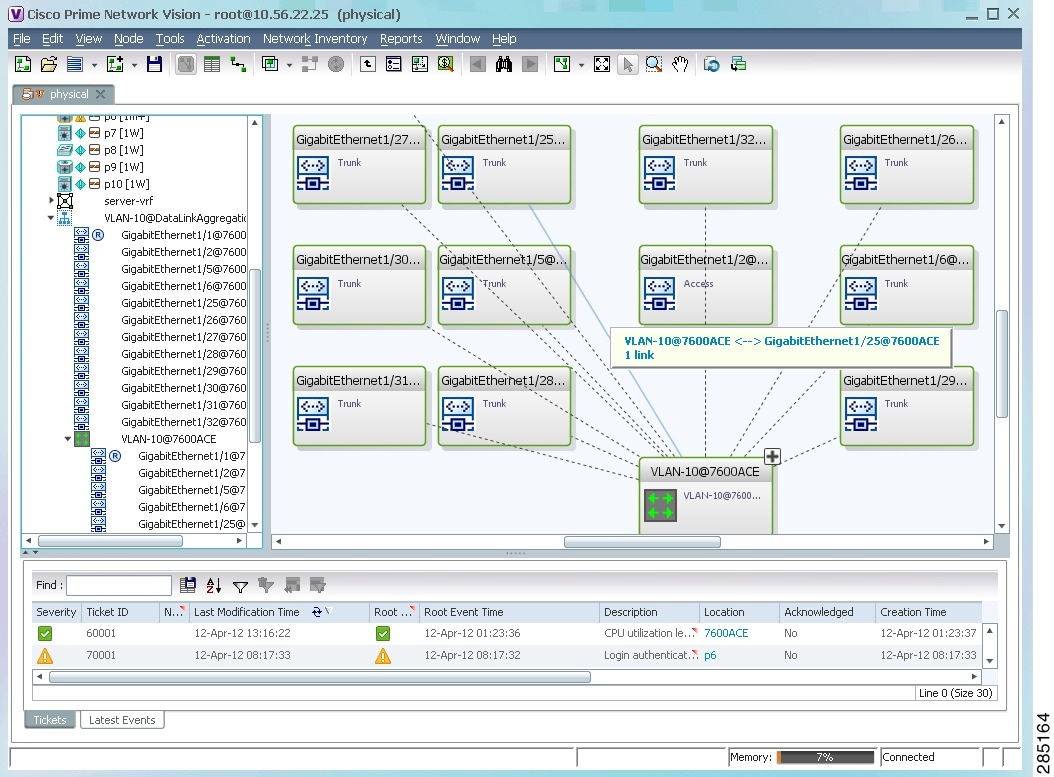
•![]() Termination point EFPs—Ethernet ports that are at the edge of a Layer 2 domain flow, such as a VLAN, on which traffic enters a Layer 3 domain or a different Layer 2 domain, such as EoMPLS. These ports are found on such devices as the Cisco 7600 series, Cisco GSR, and Cisco ASR 9000 series devices.
Termination point EFPs—Ethernet ports that are at the edge of a Layer 2 domain flow, such as a VLAN, on which traffic enters a Layer 3 domain or a different Layer 2 domain, such as EoMPLS. These ports are found on such devices as the Cisco 7600 series, Cisco GSR, and Cisco ASR 9000 series devices.
These EFPs are typically connected to a switching entity inside the VLAN by a VLAN link, as shown in Figure 13-22.
Figure 13-22 Termination Point EFP Inside a VLAN
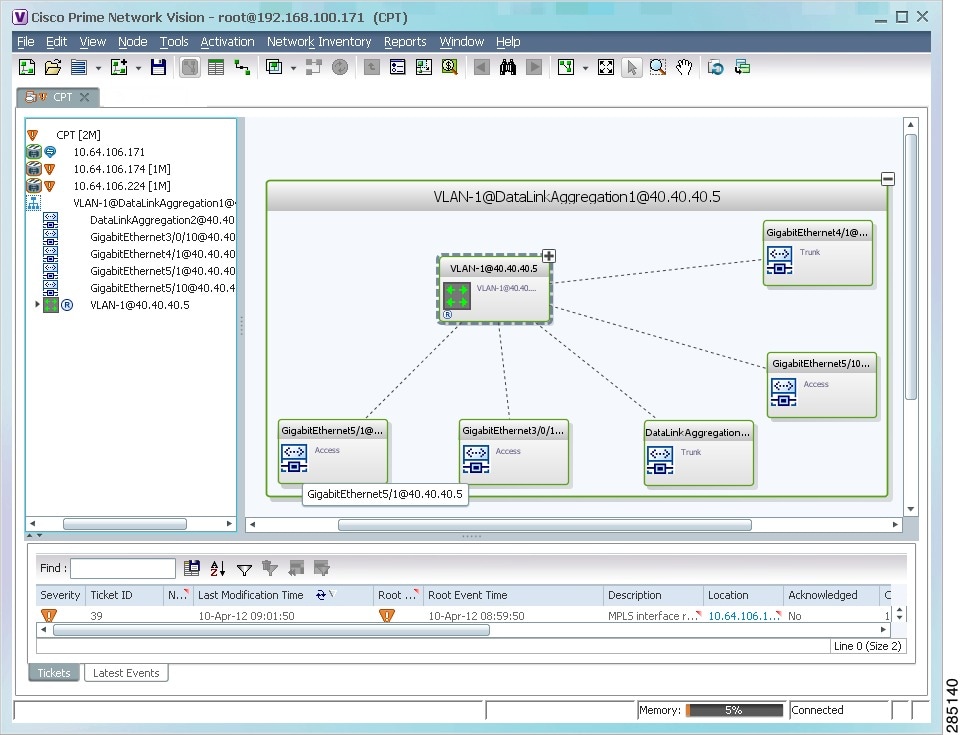
•![]() Edge EFPs—A subset of EFPs that exist inside a switching entity but that are not connected to other EFPs and that represent edge EFPs in the context of the VLAN.
Edge EFPs—A subset of EFPs that exist inside a switching entity but that are not connected to other EFPs and that represent edge EFPs in the context of the VLAN.
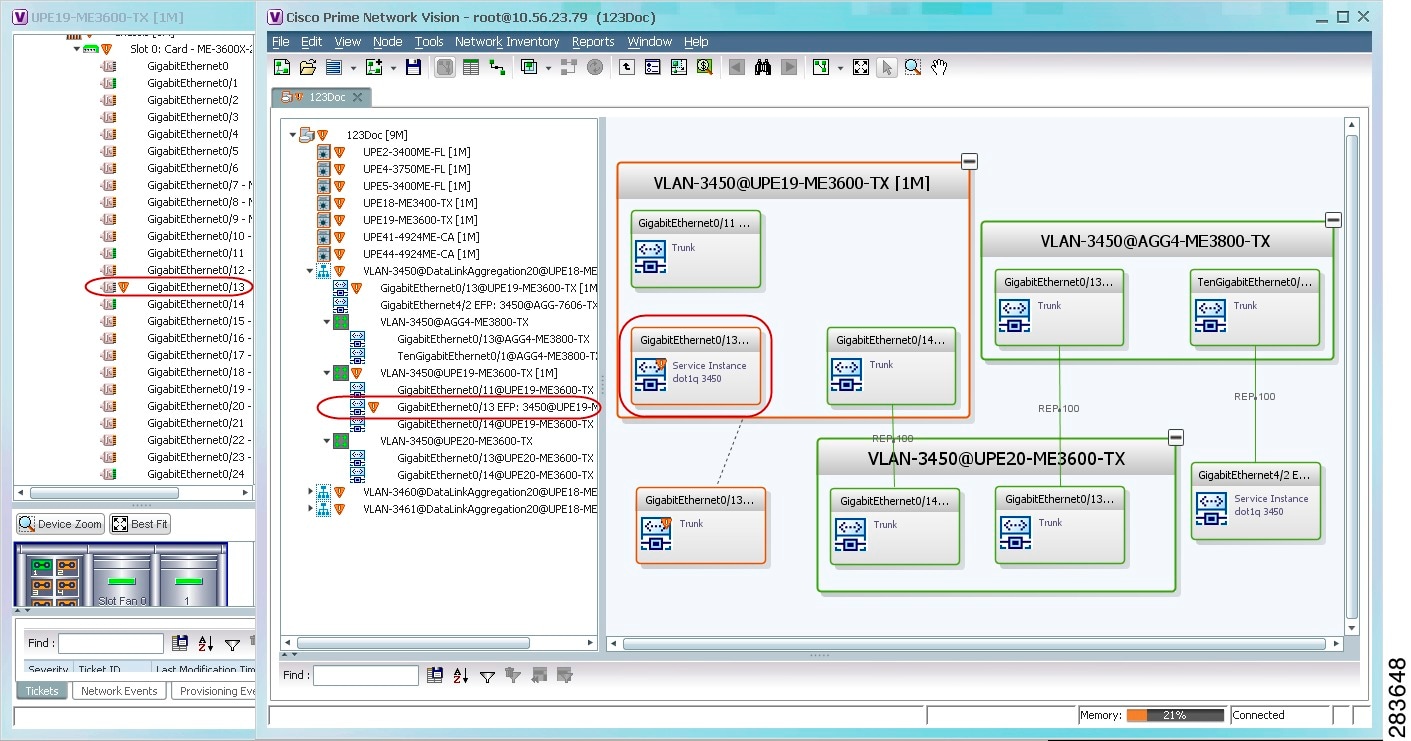
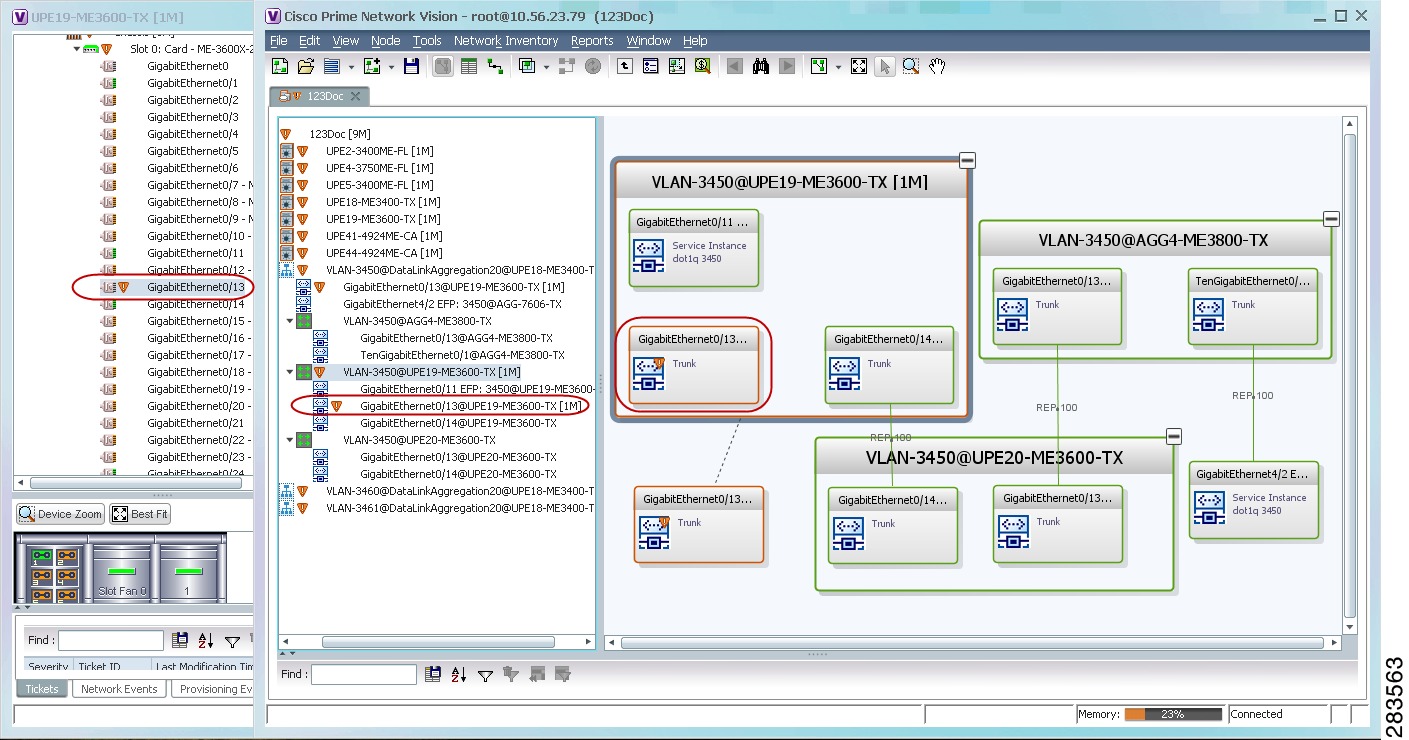
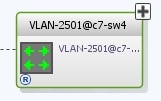
In Prime Network Vision, edge EFPs are displayed directly under the VLAN at the same level as their switching entities and are connected to their corresponding switching entities by a dotted link, as shown in Figure 13-23.
Figure 13-23 Edge EFP Inside a VLAN
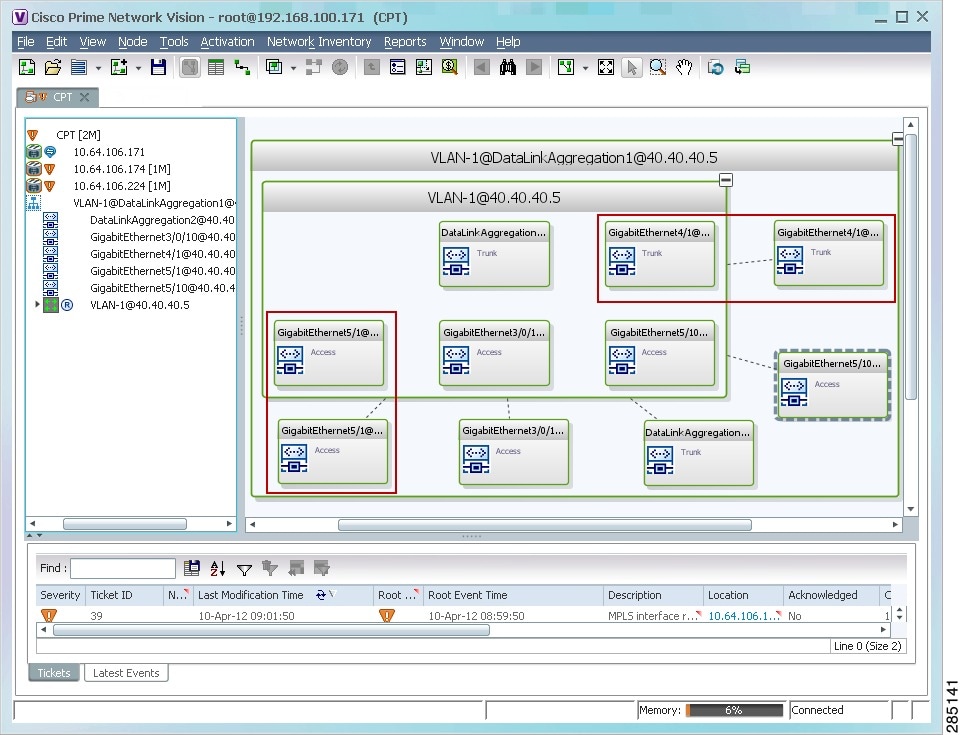
An edge EFP can be displayed both inside and outside of its switching entity, as shown (highlighted with a red outline) in Figure 13-24:
Figure 13-24 Edge EFPs Displayed Inside and Outside of Switching Entities
You can delete EFPs and switching entities that have a reconciliation icon by right-clicking them and choosing Delete. After all switching entities and EFPs are deleted from a network VLAN, the empty network VLAN is automatically deleted from Prime Network Vision after a few minutes.
Switching Entities Containing Termination Points
For some devices, such as Cisco 7600 series, Cisco GSR, and Cisco ASR 9000 series devices, the related switching entities can contain Ethernet flow point elements that serve as termination points on different network VLANs. If a single map contains both the switching entities and the network VLANs, a link is displayed between them.
Adding VLANs to a Map
You can add VLANs to a map if the VLANs were previously discovered by Prime Network Vision and are not currently displayed in the map.
Note ![]() Adding VLANs affects other users if they are working with the same map.
Adding VLANs affects other users if they are working with the same map.
To add VLANs to a map:
Step 1 ![]() In Prime Network Vision, display the map to which you want to add the VLANs.
In Prime Network Vision, display the map to which you want to add the VLANs.
Step 2 ![]() Choose File > Add to Map > VLAN. The Add VLAN to map dialog box is displayed as shown in Figure 13-25.
Choose File > Add to Map > VLAN. The Add VLAN to map dialog box is displayed as shown in Figure 13-25.
Figure 13-25 Add VLAN Dialog Box
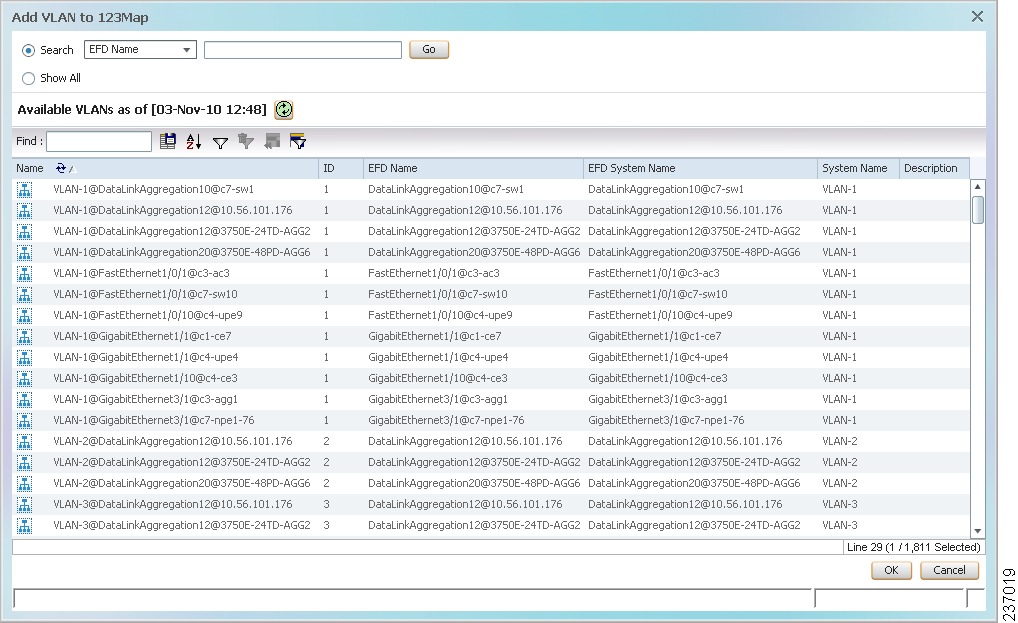
Step 3 ![]() In the Add VLAN dialog box, do either of the following:
In the Add VLAN dialog box, do either of the following:
•![]() Choose a search category, enter a search string, then click Go to narrow the VLAN display to a range of VLANs or a specific VLAN.
Choose a search category, enter a search string, then click Go to narrow the VLAN display to a range of VLANs or a specific VLAN.
The search condition is "contains." Search strings are case-insensitive. For example, if you choose the Name category and enter "net," Prime Network Vision displays VLANs that have "net" anywhere in their names. The string "net" can be at the beginning, the middle, or end of the name, such as Ethernet.
•![]() Choose Show All to display all the VLANs.
Choose Show All to display all the VLANs.
Step 4 ![]() Select the VLANs that you want to add to the map.
Select the VLANs that you want to add to the map.

Tip ![]() Press Shift or Ctrl to choose multiple adjoining or nonconsecutive VLANs.
Press Shift or Ctrl to choose multiple adjoining or nonconsecutive VLANs.
Step 5 ![]() Click OK.
Click OK.
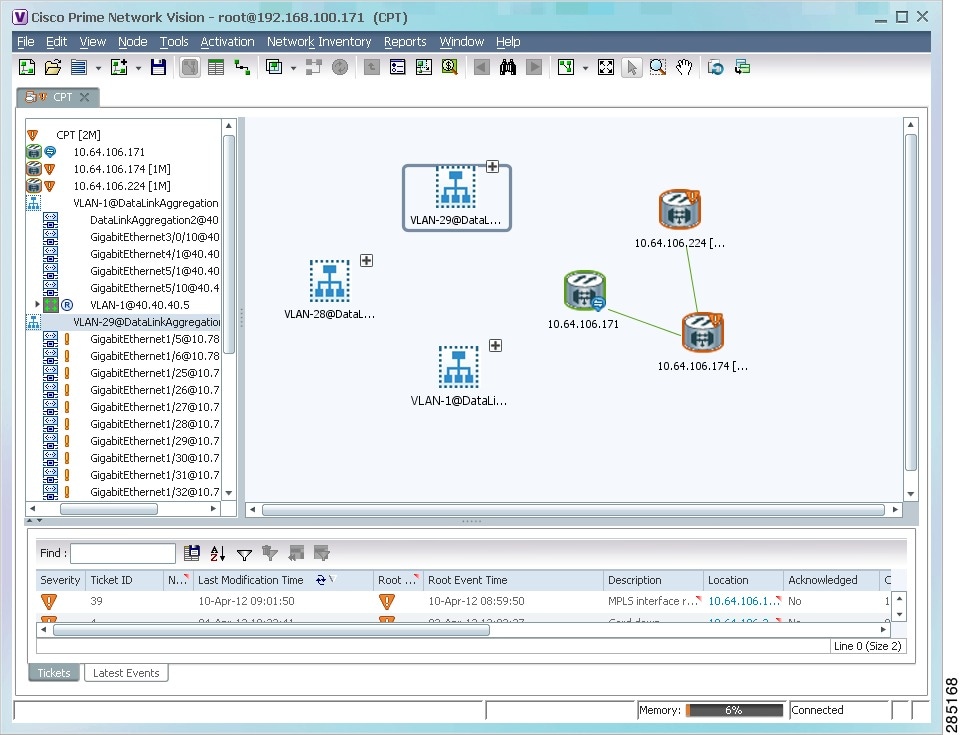
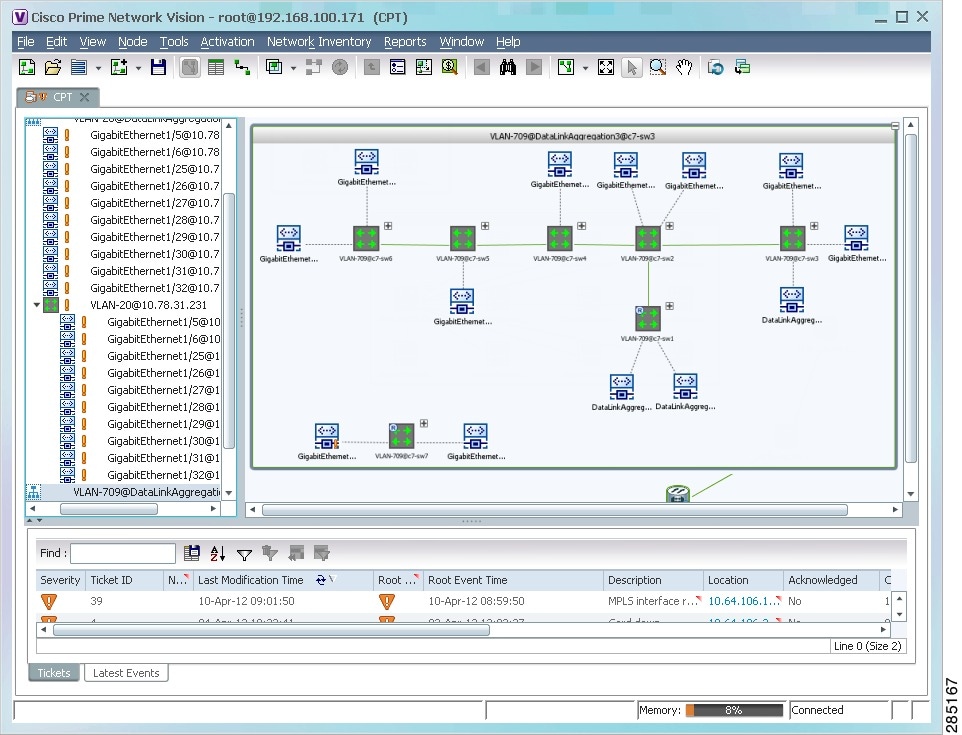
The VLANs are displayed in the Prime Network Vision content pane as shown in Figure 13-26.
Any tickets that apply to the VLANs are displayed in the ticket pane.
Figure 13-26 VLANs in Map View
After you add a VLAN to a map, you can use Prime Network Vision to view its switching entities and Ethernet flow points. For more information, see:
•![]() Viewing and Renaming Ethernet Flow Domains
Viewing and Renaming Ethernet Flow Domains
You can view additional information about REP and STP in logical inventory, VLAN domain views, and VLAN overlays.
For REP, see:
•![]() Viewing Resilient Ethernet Protocol Properties
Viewing Resilient Ethernet Protocol Properties
•![]() Viewing REP Information in VLAN Domain Views and VLAN Overlays
Viewing REP Information in VLAN Domain Views and VLAN Overlays
•![]() Viewing REP Properties for VLAN Service Links
Viewing REP Properties for VLAN Service Links
For STP, see:
•![]() Viewing Spanning Tree Protocol Properties
Viewing Spanning Tree Protocol Properties
•![]() Viewing STP Information in VLAN Domain Views and VLAN Overlays
Viewing STP Information in VLAN Domain Views and VLAN Overlays
•![]() Viewing STP Properties for VLAN Service Links
Viewing STP Properties for VLAN Service Links
Removing VLANs from a Map
You can remove one or more VLANs from the current map. This change does not affect other maps. Removing a VLAN from a map does not remove it from the Prime Network database. You can add the VLAN to the map at any time.
When removing VLANs from maps, keep the following in mind:
•![]() Removing a VLAN affects other users who are working with the same map view.
Removing a VLAN affects other users who are working with the same map view.
•![]() This option does not change the business configuration or database.
This option does not change the business configuration or database.
•![]() You cannot remove virtual routers or sites from the map without removing the VLAN.
You cannot remove virtual routers or sites from the map without removing the VLAN.
To remove a VLAN, in the Prime Network Vision navigation pane or map view, right-click the VLAN and choose Remove from Map.
The VLAN is removed from the navigation pane and map view along with all VLAN elements such as connected CE devices. Remote VLANs (extranets) are not removed.
Viewing VLAN Mappings
VLAN mapping, or VLAN ID translation, is used to map customer VLANs to service provider VLANs. VLAN mapping is configured on the ports that are connected to the service provider network. VLAN mapping acts as a filter on these ports without affecting the internal operation of the switch or the customer VLANs.
If a customer wants to use a VLAN number in a reserved range, VLAN mapping can be used to overlap customer VLANs by encapsulating the customer traffic in IEEE 802.1Q tunnels.
To view VLAN mappings:
Step 1 ![]() In Prime Network Vision, double-click the device with VLAN mappings configured.
In Prime Network Vision, double-click the device with VLAN mappings configured.
Step 2 ![]() In the inventory window, choose Physical Inventory > Chassis > slot > port.
In the inventory window, choose Physical Inventory > Chassis > slot > port.
Step 3 ![]() Click VLAN Mappings next to the Subinterfaces tab in the lower portion of the content pane.
Click VLAN Mappings next to the Subinterfaces tab in the lower portion of the content pane.
The VLAN Mappings tab is displayed as shown in Figure 13-27.
Figure 13-27 VLAN Mappings Tab in Physical Inventory
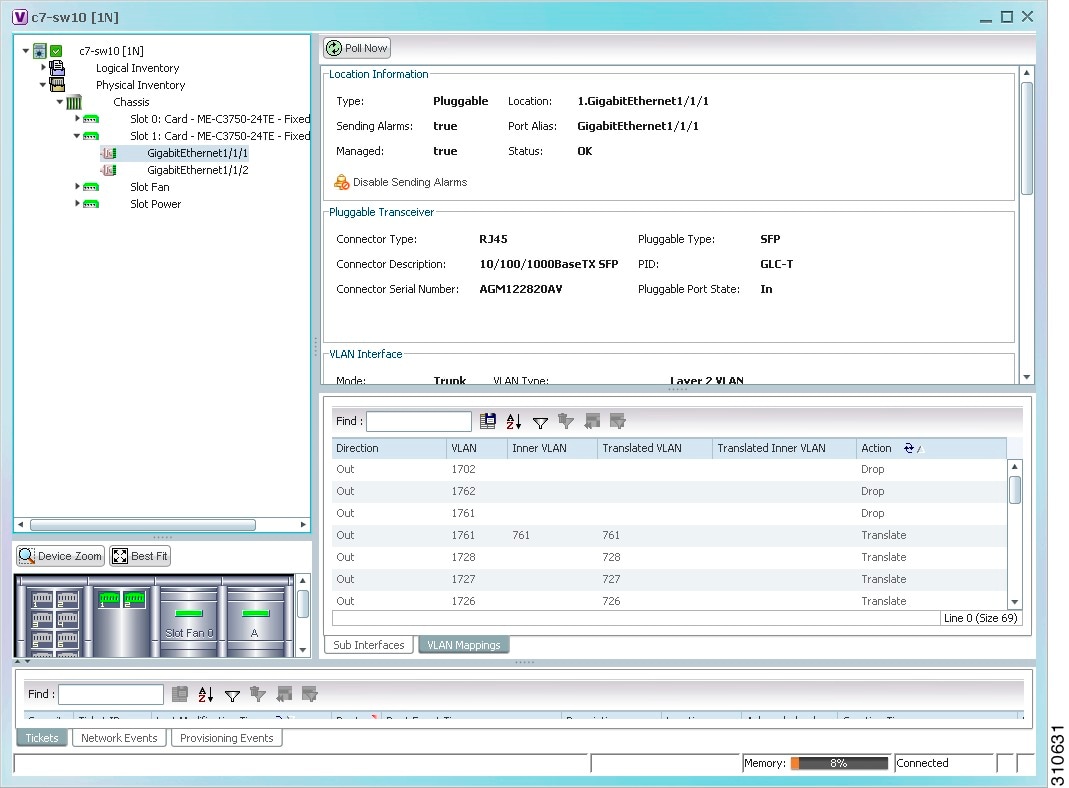
Table 13-25 describes the information that is displayed in the VLAN Mappings table.
Working with Associated VLANs
Prime Network Vision discovers associations between network VLANs and displays the information in Prime Network Vision. Network VLAN associations are represented by VLAN service links, and can be any of the tag manipulation types described in Table 13-26.
When working with VLANs, you can:
•![]() Add an associated VLAN—See Adding an Associated VLAN.
Add an associated VLAN—See Adding an Associated VLAN.
•![]() View properties for associated VLANs—See Viewing Associated Network VLAN Service Links and VLAN Mapping Properties.
View properties for associated VLANs—See Viewing Associated Network VLAN Service Links and VLAN Mapping Properties.
Adding an Associated VLAN
To add an associated VLAN to an existing VLAN in a map:
Step 1 ![]() In Prime Network Vision, select the required VLAN in the map view.
In Prime Network Vision, select the required VLAN in the map view.
Step 2 ![]() Right-click the VLAN and choose Add Associated VLAN.
Right-click the VLAN and choose Add Associated VLAN.
The Add Associated VLAN table is displayed as shown in Figure 13-28.
Figure 13-28 Add Associated VLAN Window
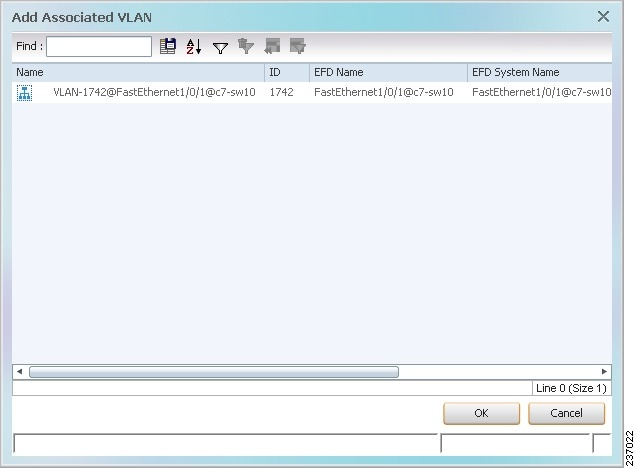
In this example, the selected network VLAN has one associated VLAN: VLAN-1742.
Table 13-27 describes the information displayed in the Add Associated VLAN table.
Step 3 ![]() Select the required VLAN in the Add Associated VLAN table, then click OK.
Select the required VLAN in the Add Associated VLAN table, then click OK.
The associated network VLAN is added to the map in Prime Network Vision.
Viewing Associated Network VLAN Service Links and VLAN Mapping Properties
After you add an associated network VLAN, you can:
•![]() View the associated network VLAN service links in Prime Network Vision in the thumbnail view.
View the associated network VLAN service links in Prime Network Vision in the thumbnail view.
•![]() View VLAN mapping properties in the Link Properties window.
View VLAN mapping properties in the Link Properties window.
To view associated network VLAN service links and VLAN mapping properties:
Step 1 ![]() Select the required network VLAN in the map view.
Select the required network VLAN in the map view.
Step 2 ![]() Right-click the VLAN, then choose Show Thumbnail.
Right-click the VLAN, then choose Show Thumbnail.
Figure 13-29 shows an example of a network VLAN in a thumbnail.
The VLAN service links are displayed as lines between the associated network VLANs. The links represent the connections between the Ethernet flow points that are part of each network VLAN.
Figure 13-29 VLAN Service Links Between Associated Network VLANs
Step 3 ![]() To view additional information, right-click a link, and choose Properties.
To view additional information, right-click a link, and choose Properties.
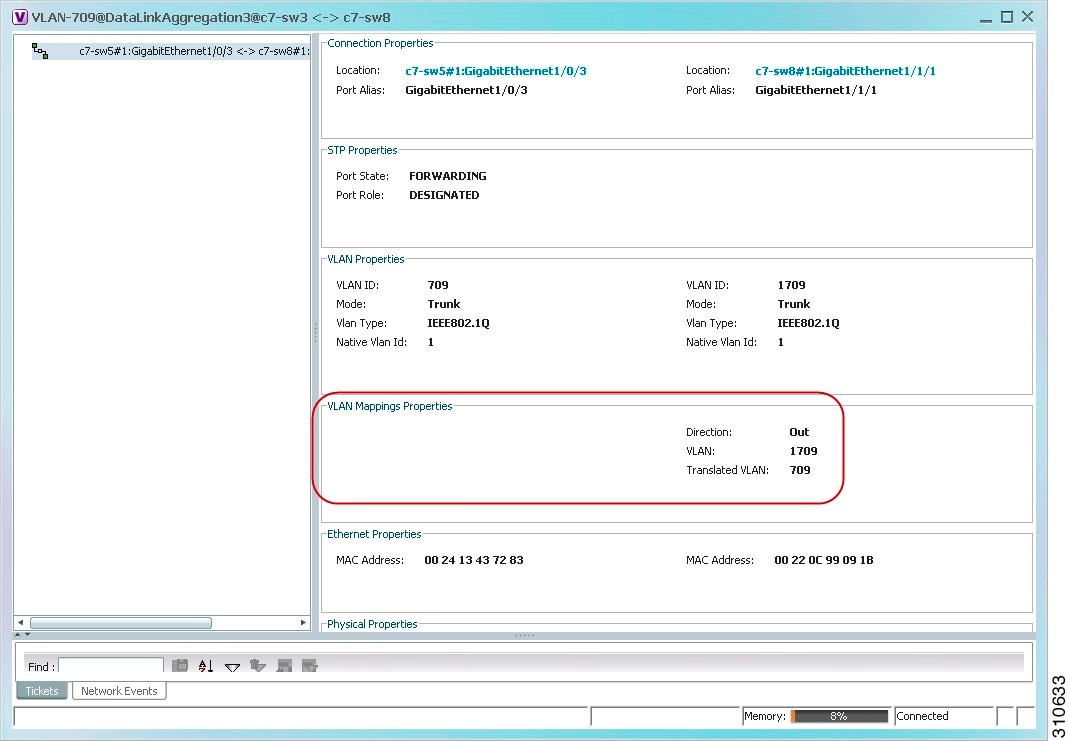
The Link Properties window is displayed as shown in Figure 13-30.
If VLAN tag manipulation is configured on the link, the VLAN Mapping Properties area in the Link Properties window displays the relevant information. For example, in Figure 13-30, the VLAN Mapping Properties area shows that a one-to-one VLAN mapping for VLAN tag 1709 to VLAN tag 709 is configured on GigabitEthernet1/1/1 on c7-sw8 on the egress direction.
Figure 13-30 VLAN Mapping Properties in Link Properties Window
For additional information about viewing network VLAN service link properties, see:
•![]() Viewing REP Properties for VLAN Service Links
Viewing REP Properties for VLAN Service Links
•![]() Viewing STP Properties for VLAN Service Links
Viewing STP Properties for VLAN Service Links
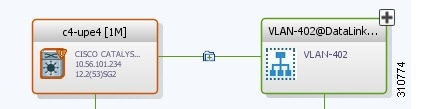
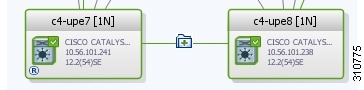
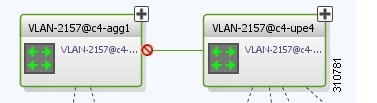
Viewing VLAN Links Between VLAN Elements and Devices
If a Prime Network Vision map contains a VLAN and the network element on which the VLAN is configured, along with EFPs, switching entities, or network VLANs, you might see what appear to be multiple associations between the logical and physical entities. Actually, however, you are seeing other views of the original VLAN link.
For example, assume that you have the following situation, as shown in Figure 13-31 and described in the following paragraphs.
Figure 13-31 VLAN Elements and Devices in Prime Network Vision
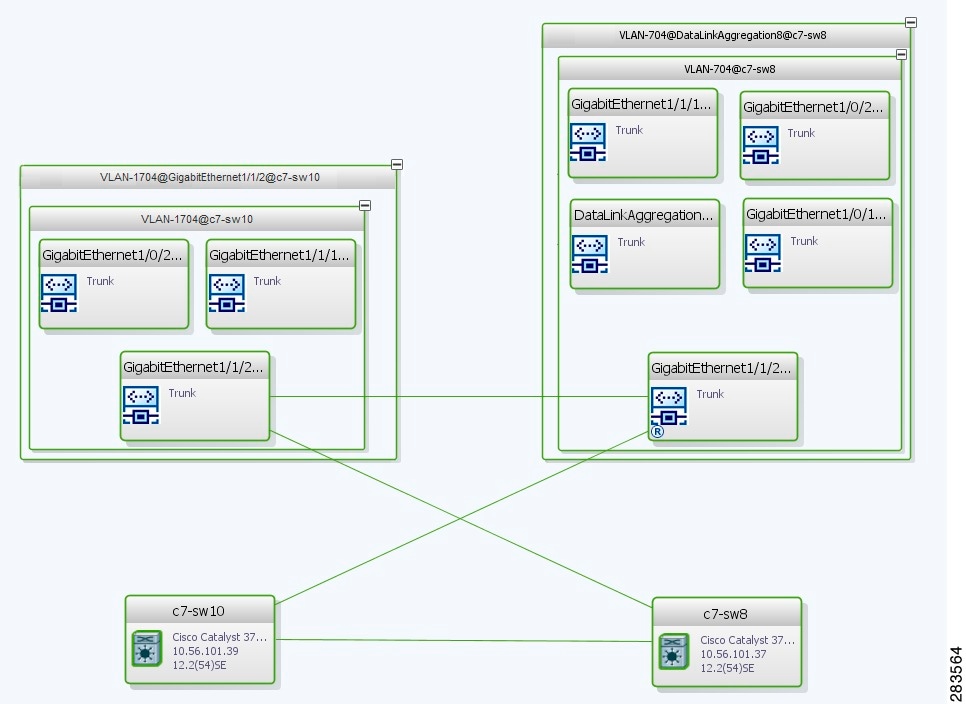
The elements are configured as follows:
•![]() Port GigabitEthernet1/1/2 on element c7-sw10 is connected to port GigabitEthernet1/1/2 on element c7-sw8 by an Ethernet topology link.
Port GigabitEthernet1/1/2 on element c7-sw10 is connected to port GigabitEthernet1/1/2 on element c7-sw8 by an Ethernet topology link.
•![]() Port GigabitEthernet1/1/2 on element c7-sw10 is a trunk port associated with VLAN-1704 which is configured on element c7-sw10.
Port GigabitEthernet1/1/2 on element c7-sw10 is a trunk port associated with VLAN-1704 which is configured on element c7-sw10.
•![]() Port GigabitEthernet1/1/2 on element c7-sw8 is a trunk port associated with VLAN-704 which is configured on element c7-sw8.
Port GigabitEthernet1/1/2 on element c7-sw8 is a trunk port associated with VLAN-704 which is configured on element c7-sw8.
•![]() Port GigabitEthernet1/1/2 on element c7-sw8 has a VLAN mapping to tunnel VLAN-1704 (C-VLAN) in VLAN-704 (SP-VLAN).
Port GigabitEthernet1/1/2 on element c7-sw8 has a VLAN mapping to tunnel VLAN-1704 (C-VLAN) in VLAN-704 (SP-VLAN).
In this example, VLAN discovery identified two network VLANs: VLAN-1704 and VLAN-704. Each of these network VLANs contains a switching entity and an EFP that represent the connected ports, GigabitEthernet1/1/2@c7-sw10 and GigabitEthernet1/1/2@c7-sw8, respectively.
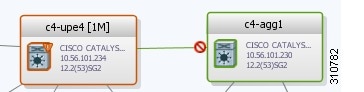
The four links in the map are identified in Figure 13-32 and described in the following table.
Figure 13-32 Links Between VLAN Elements and Devices
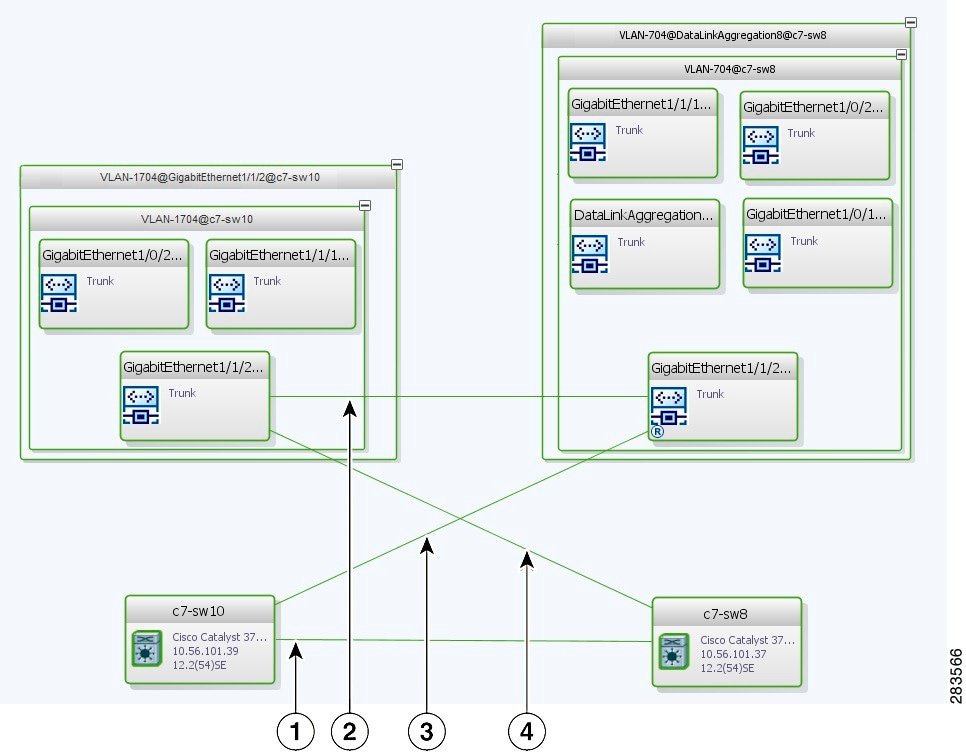
The key point is that a link between a VNE and EFP, switching entity, or network VLAN does not represent an association between the VNE and the logical element. Such a link is simply another view of the VLAN link.
If the thumbnail view is closed, instead of a link between the VNE and EFP, you will see a link between the VNE and the switching entity or network VLAN.
Applying VLAN Overlays
You can create an overlay of a specific VLAN on top of the physical network elements displayed in a map view. The overlay highlights the network elements and links that the selected VLAN and its associated VLANs traverse. Network elements and links that are not part of the VLAN are dimmed in the map view.
The VLAN overlay is a snapshot of the network to help you visualize the network elements and links connected to a VLAN. The overlay displays STP and REP link and port information.
If you select a network VLAN that is associated with other VLANs, the associated VLANs are included in the overlay.
The VLAN service overlay allows you to isolate the parts of a network that are being used by a particular service. This information can then be used for troubleshooting. For example, the overlay can highlight configuration or design problems when bottlenecks occur and all site interconnections use the same link.
To add a VLAN overlay:
Step 1 ![]() Display the network map for which you want to create an overlay in Prime Network Vision.
Display the network map for which you want to create an overlay in Prime Network Vision.
Step 2 ![]() In the toolbar, choose Choose Overlay Type > VLAN.
In the toolbar, choose Choose Overlay Type > VLAN.
Step 3 ![]() In the Select VLAN Overlay dialog box, do either of the following:
In the Select VLAN Overlay dialog box, do either of the following:
•![]() Choose a search category, enter a search string, then click Go to narrow the selection to a set of overlays or a specific overlay.
Choose a search category, enter a search string, then click Go to narrow the selection to a set of overlays or a specific overlay.
The search condition is "contains." Search strings are case-insensitive. For example, if you choose the Name category and enter "net," Prime Network Vision displays overlays that have "net" in their names. The string "net" can be at the beginning, middle, or end of the name, such as Ethernet.
•![]() Choose Show All to view all overlays.
Choose Show All to view all overlays.
Step 4 ![]() Select an overlay, then click OK.
Select an overlay, then click OK.
The network elements and physical links used by the selected VLAN overlay are highlighted in the network map. All other network elements and links are dimmed. The VLAN name is displayed in the title of the window. See Figure 13-33.
Figure 13-33 VLAN Overlay Example
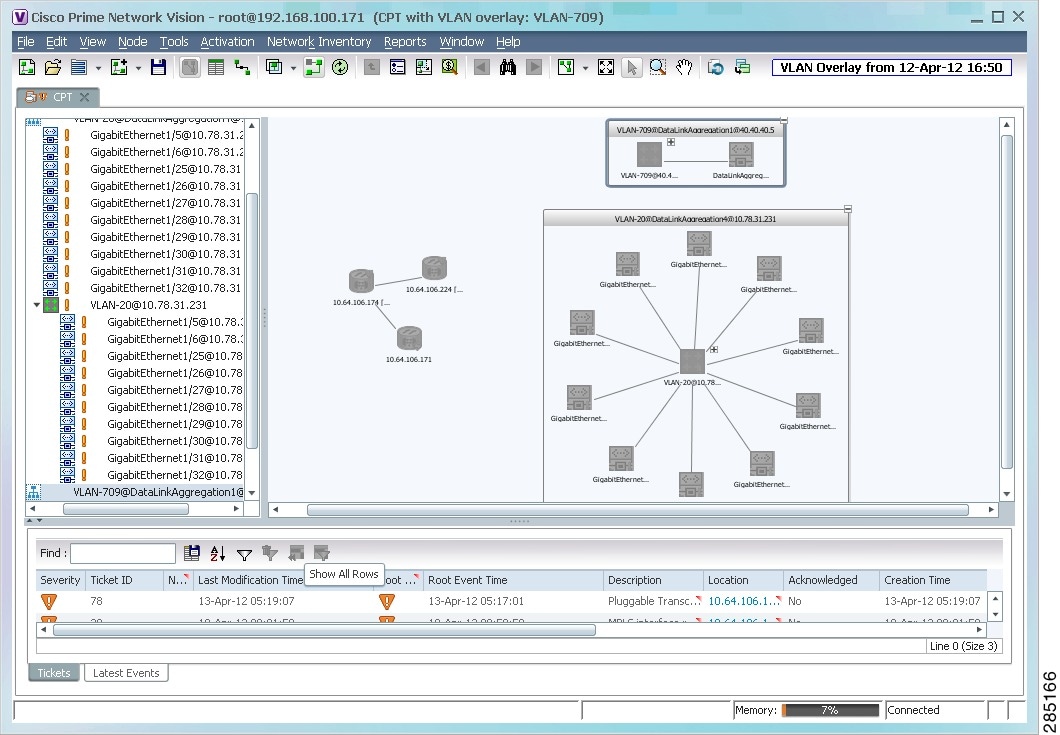
Note ![]() The overlay is a snapshot taken at a specific point in time. As a result, the information in the overlay might become stale. To update the overlay, click Refresh the Last Selected Overlay in the toolbar.
The overlay is a snapshot taken at a specific point in time. As a result, the information in the overlay might become stale. To update the overlay, click Refresh the Last Selected Overlay in the toolbar.
Displaying or Hiding VLAN Overlays
After you create a VLAN overlay, you can hide it by clicking Hide Overlay in the toolbar. All previously dimmed network elements and links are displayed. To display the overlay, click Show Overlay.
Note ![]() The Overlay icon toggles between Show Overlay and Hide Overlay. When selected, the VLAN overlay is displayed and the Hide Overlay tool is active. When deselected, the VLAN overlay is hidden and the Show Overlay tool is active.
The Overlay icon toggles between Show Overlay and Hide Overlay. When selected, the VLAN overlay is displayed and the Hide Overlay tool is active. When deselected, the VLAN overlay is hidden and the Show Overlay tool is active.
Removing a VLAN Overlay
To remove a VLAN overlay from a map, choose Choose Overlay Type > None in the toolbar. The overlay is removed from the map, and the Show Overlay/Hide Overlay icon is dimmed.
Viewing VLAN Service Link Properties
See the following topics for information on viewing VLAN service link properties:
•![]() Viewing REP Properties for VLAN Service Links
Viewing REP Properties for VLAN Service Links
•![]() Viewing STP Properties for VLAN Service Links
Viewing STP Properties for VLAN Service Links
•![]() Viewing Associated Network VLAN Service Links and VLAN Mapping Properties
Viewing Associated Network VLAN Service Links and VLAN Mapping Properties
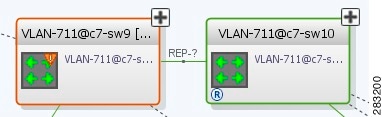
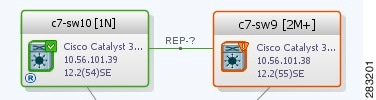
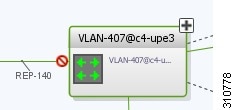
Viewing REP Information in VLAN Domain Views and VLAN Overlays
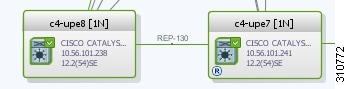
You can view REP segment and port information in Prime Network Vision in the map view. The icons displayed depend on whether you view the REP information in the VLAN domain view or in a VLAN overlay. Table 13-28 describes the icons and badges used to represent REP segment and port information.


Viewing REP Properties for VLAN Service Links
To view REP properties for a VLAN service link, open the Link Properties window in either of the following ways:
•![]() Double-click the VLAN service link.
Double-click the VLAN service link.
•![]() Right-click the VLAN service link, and choose Properties.
Right-click the VLAN service link, and choose Properties.
Figure 13-34 shows an example of the Link Properties window with REP information.
Figure 13-34 VLAN Service Link Properties Window with REP Information
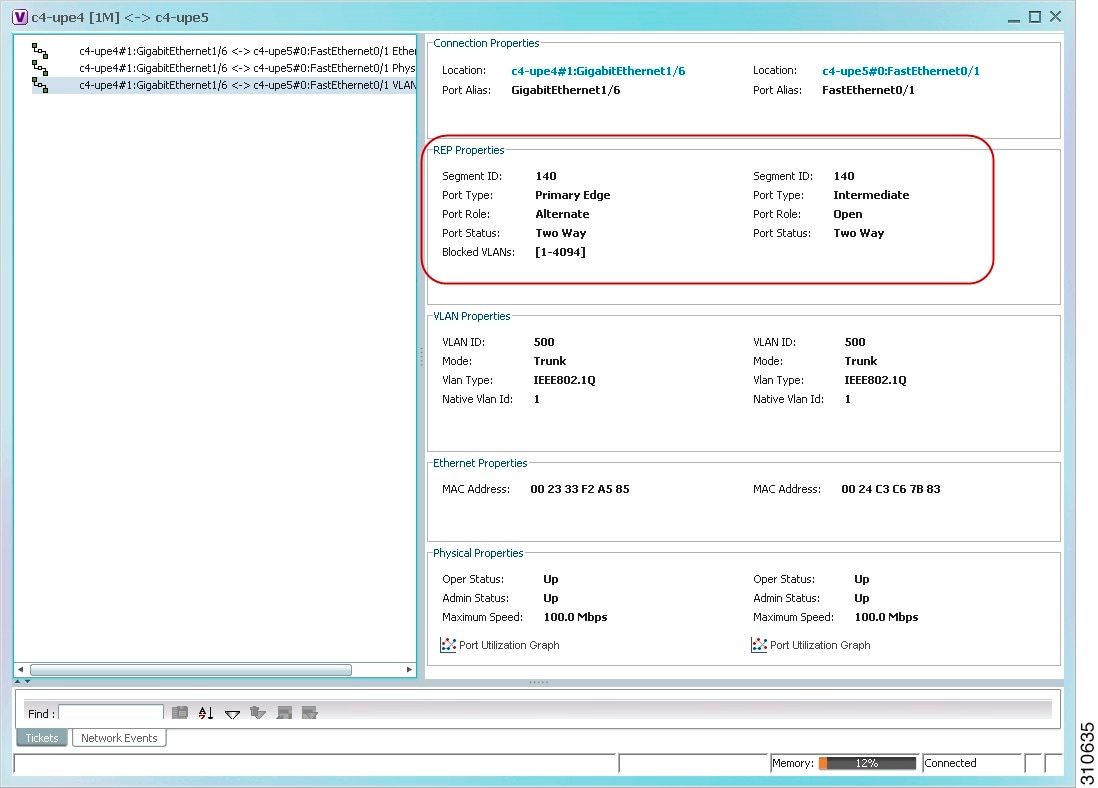
Table 13-29 describes the information that is displayed for REP for each end of the link.
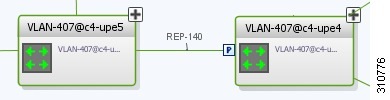
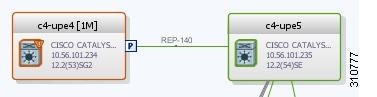
Viewing STP Information in VLAN Domain Views and VLAN Overlays
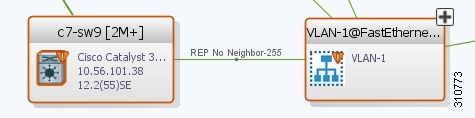
You can view STP segment and port information in Prime Network Vision in the map view. The icons displayed depend on whether you view the STP information in the VLAN domain view or in a VLAN overlay. Table 13-30 describes the icons and badges used to represent STP link and port information.


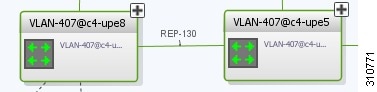
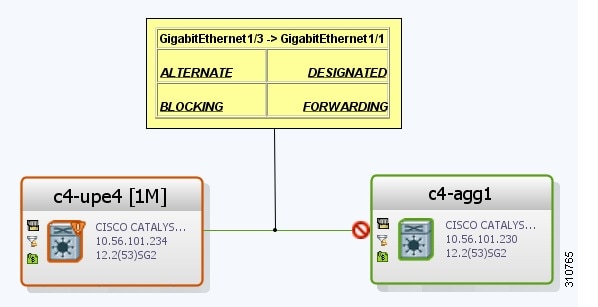
To view additional STP information in a VLAN overlay, right-click an STP link and choose Show Callouts. The following STP port information is displayed as shown in Figure 13-35:
•![]() Port name
Port name
•![]() Port role
Port role
•![]() Port state
Port state
Figure 13-35 STP Link Information in a VLAN Overlay
Viewing STP Properties for VLAN Service Links
To view STP properties for a VLAN service link, open the Link Properties window in one of the following ways:
•![]() Double-click the VLAN service link.
Double-click the VLAN service link.
•![]() Right-click the VLAN service link, and choose Properties.
Right-click the VLAN service link, and choose Properties.
Figure 13-36 shows an example of the Link Properties window with STP information.
Figure 13-36 STP Properties in VLAN Service Link Properties Window
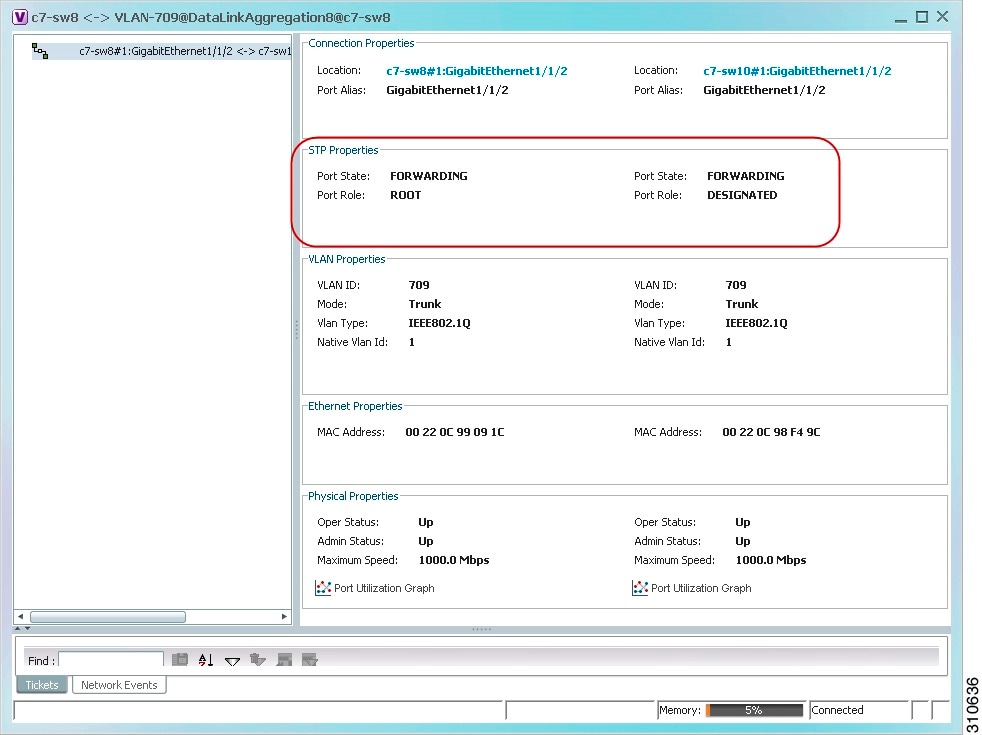
Table 13-31 describes the information that is displayed for STP for the VLAN service link.
Viewing VLAN Trunk Group Properties
VTP is a Layer 2 multicast messaging protocol that manages the addition, deletion, and renaming of VLANs on a switched network-wide basis.
Prime Network Vision displays VTP information in the logical inventory. VTP information is shown only for Cisco devices that support VTP, and support is provided only for VTP Version 1 and 2. Support for Version 3 is limited to the additional attributes that are supported by the version, such as primary and secondary server. No support is provided for the display of VTP information at the port (trunk) level.
Prime Network Vision shows all VTP modes: Server, Client, Transparent, and Off. For each mode, Prime Network Vision displays the relevant mode information such as VTP domain, VTP mode, VTP version, VLAN trunks, and the trunk encapsulation. Prime Network Vision also displays VTP domain information in a view that includes a list of all switches that are related to these domains, their roles (server, client, and so on), and their VTP properties.
To view VTP properties:
Step 1 ![]() In Prime Network Vision, choose Network Inventory > VTP Domains.
In Prime Network Vision, choose Network Inventory > VTP Domains.
Step 2 ![]() Double-click the VTP domain you want to view.
Double-click the VTP domain you want to view.
The VTP Domain Properties window is displayed as shown in Figure 13-37.
Figure 13-37 VTP Domain Properties Window in Logical Inventory
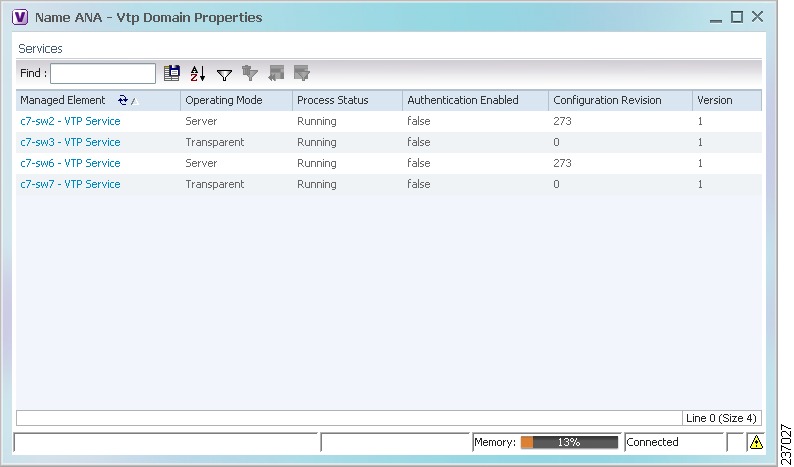
Table 13-32 describes the information that is displayed in the VTP Domain Properties window.
Step 3 ![]() To view the VTP properties at the device, double-click the VTP domain.
To view the VTP properties at the device, double-click the VTP domain.
Table 13-33 describes the VTP information that is displayed in the inventory window content pane.
Step 4 ![]() When finished, press Ctrl + F4 to close each VTP properties window.
When finished, press Ctrl + F4 to close each VTP properties window.
Viewing VLAN Bridge Properties
You can view VLAN bridges provisioned on a device by displaying the device in the Prime Network Vision inventory window and choosing Bridges in logical inventory.
To view VLAN bridge properties:
Step 1 ![]() In Prime Network Vision, double-click the device containing the VLAN bridges you want to view.
In Prime Network Vision, double-click the device containing the VLAN bridges you want to view.
Step 2 ![]() In the inventory window, choose Logical Inventory > Bridges > bridge.
In the inventory window, choose Logical Inventory > Bridges > bridge.
VLAN bridge properties are displayed as shown in Figure 13-38.
Figure 13-38 VLAN Bridge Properties in Logical Inventory
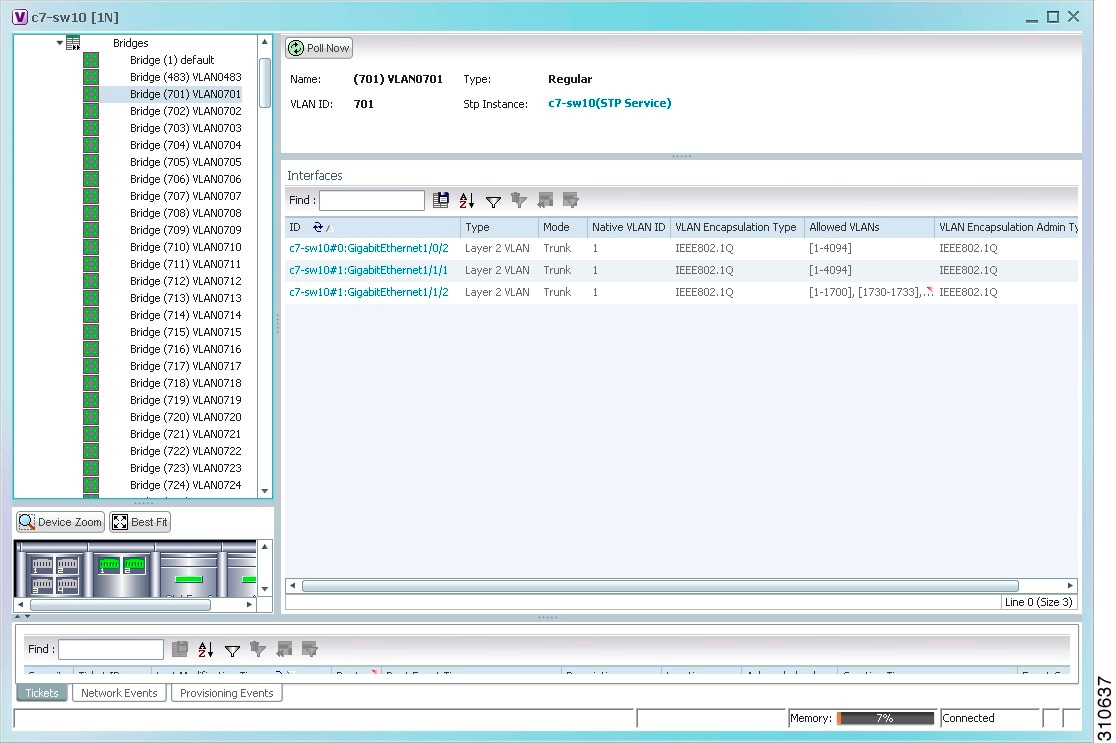
Table 13-34 describes the information that is displayed. Depending on the bridge configuration, any of the tabs might be displayed for the selected bridge.
Step 3 ![]() When finished, press Ctrl + F4 to close each VLAN Bridge properties window.
When finished, press Ctrl + F4 to close each VLAN Bridge properties window.
Using Commands to Work With VLANs
The following commands can be launched from the physical inventory by right-clicking an Ethernet slot and choosing Commands > Configuration. Before executing any commands, you can preview them and view the results. If desired, you can also schedule the commands. To find out if a device supports these commands, see the Cisco Prime Network 3.10 Supported Cisco VNEs.
These commands are applicable only for Cisco ASR 5000 series network elements.
Note ![]() You might be prompted to enter your device access credentials while executing a command. Once you have entered them, these credentials will be used for every subsequent execution of a command in the same GUI client session. If you want to change the credentials, click Edit Credentials. The Edit Credentials button will not be available for SNMP commands or if the command is scheduled for a later time.
You might be prompted to enter your device access credentials while executing a command. Once you have entered them, these credentials will be used for every subsequent execution of a command in the same GUI client session. If you want to change the credentials, click Edit Credentials. The Edit Credentials button will not be available for SNMP commands or if the command is scheduled for a later time.
Understanding Unassociated Bridges
Some switching entities might not belong to a flow domain, such as a network VLAN, a VPLS instance, or a network pseudowire. These switching entities are referred to as unassociated bridges.
In addition, a switching entity that belongs to a network VLAN is considered an unassociated bridge if it meets both of the following criteria:
•![]() The network VLAN contains a null Ethernet flow domain (EFD).
The network VLAN contains a null Ethernet flow domain (EFD).
•![]() The switching entity contains no switch ports.
The switching entity contains no switch ports.
Unassociated bridge switching entities can hold Ethernet flow points that serve as termination points on different network VLANs. If these switching entities are added to a map with the relevant VLANs, the links are displayed in the Prime Network Vision map.
Adding Unassociated Bridges
Prime Network Vision enables you to add unassociated bridges to maps and to view their properties.
To add an unassociated bridge to a map:
Step 1 ![]() In Prime Network Vision, select the required map or domain.
In Prime Network Vision, select the required map or domain.
Step 2 ![]() Open the Add Unassociated Bridge dialog box in one of the following ways:
Open the Add Unassociated Bridge dialog box in one of the following ways:
•![]() Choose File Add to Map > Unassociated Bridge.
Choose File Add to Map > Unassociated Bridge.
•![]() In the toolbar, click Add to Map and choose Unassociated Bridge.
In the toolbar, click Add to Map and choose Unassociated Bridge.
Figure 13-39 shows an example of the Add Unassociated Bridge dialog box.
Figure 13-39 Add Unassociated Bridge Dialog Box
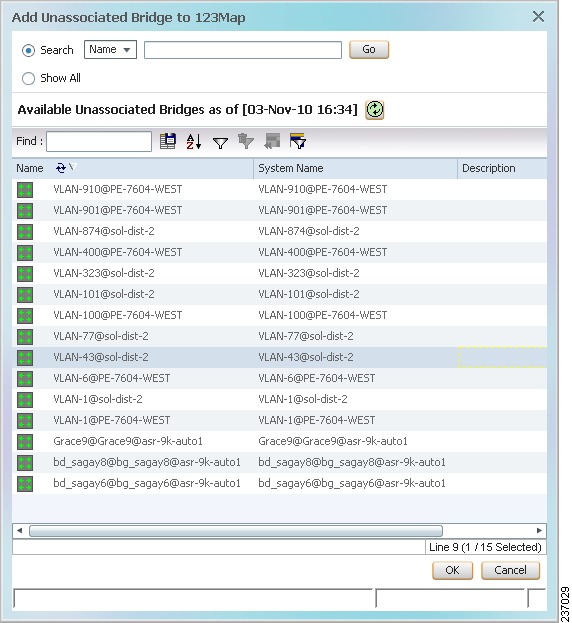
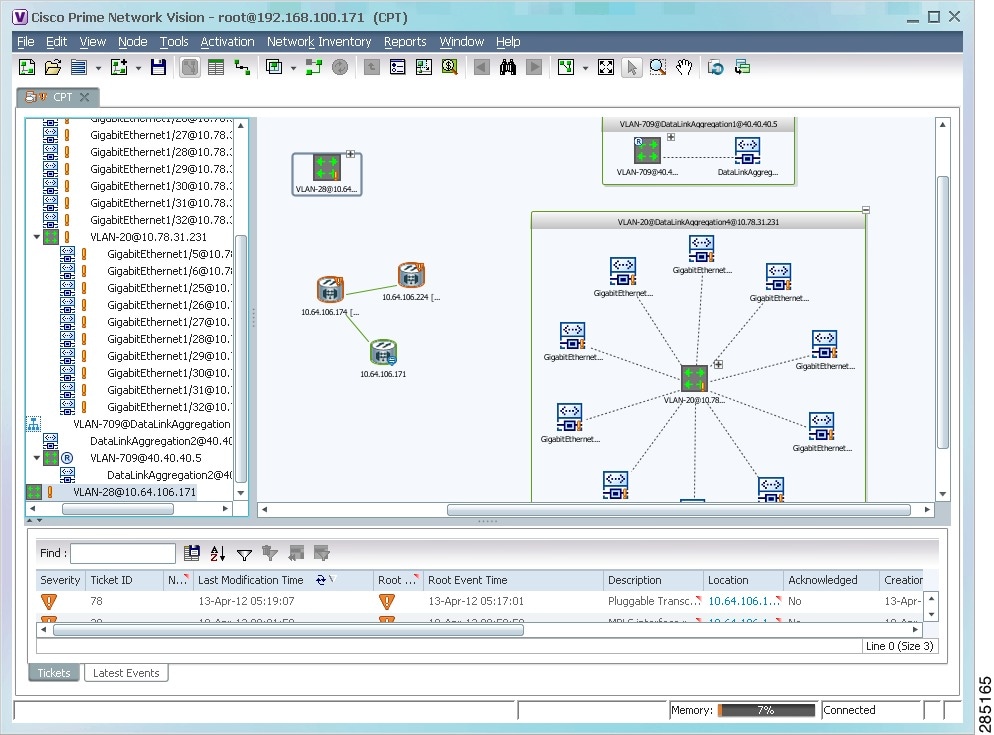
Step 3 ![]() In the Add Unassigned Bridge to domain dialog box, select the required bridge and click OK.
In the Add Unassigned Bridge to domain dialog box, select the required bridge and click OK.
The map is refreshed and displays the newly added bridge as shown in Figure 13-40.
Figure 13-40 Unassociated Bridge in Prime Network Vision
Working with Ethernet Flow Point Cross-Connects
Prime Network Vision automatically discovers Ethernet flow point (EFP) cross-connects, also known as locally switched EFPs. Prime Network Vision also identifies changes in already identified EFP cross-connects, such as cross-connect deletions or changes. Cross-connect changes can occur when one side of the cross-connect is removed or replaced.
Prime Network Vision also associates the VLANs that contain the EFPs that are part of the cross-connects. If the cross-connect contains a range EFP, which represents a range of VLANs, and you add the related VLANs to a map, Prime Network Vision displays the links between them and the cross-connect as well.
Prime Network Vision enables you to add EFP cross-connects to maps and to view their properties in inventory, as described in the following topics:
•![]() Viewing EFP Cross-Connect Properties
Viewing EFP Cross-Connect Properties
Adding EFP Cross-Connects
To add an EFP cross-connect to a map:
Step 1 ![]() In Prime Network Vision, select the map to which you wish to add the cross-connect.
In Prime Network Vision, select the map to which you wish to add the cross-connect.
Step 2 ![]() Open the Add EFP Cross-Connect dialog box in one of the following ways:
Open the Add EFP Cross-Connect dialog box in one of the following ways:
•![]() Choose File Add to Map > Cross Connect.
Choose File Add to Map > Cross Connect.
•![]() In the toolbar, click Add to Map and choose Cross Connect.
In the toolbar, click Add to Map and choose Cross Connect.
Step 3 ![]() In the Add EFP Cross Connect to domain dialog box, select the required EFP cross-connect and click OK.
In the Add EFP Cross Connect to domain dialog box, select the required EFP cross-connect and click OK.
The map is refreshed and displays the newly added EFP cross-connect.
Viewing EFP Cross-Connect Properties
To view EFP cross-connect properties in Prime Network Vision, do either of the following:
•![]() Select the EFP cross-connect with the properties you want to view, and choose Node > Properties.
Select the EFP cross-connect with the properties you want to view, and choose Node > Properties.
•![]() Double-click the device configured with an EFP cross-connect and, in the inventory window, choose Logical Inventory > Local Switching > Local Switching Entity.
Double-click the device configured with an EFP cross-connect and, in the inventory window, choose Logical Inventory > Local Switching > Local Switching Entity.
The information that is displayed for EFP cross-connects is the same in both the Local Switching Entry Properties window and in the Local Switching Table in logical inventory (as shown in Figure 13-41).
Figure 13-41 Local Switching Table in Logical Inventory
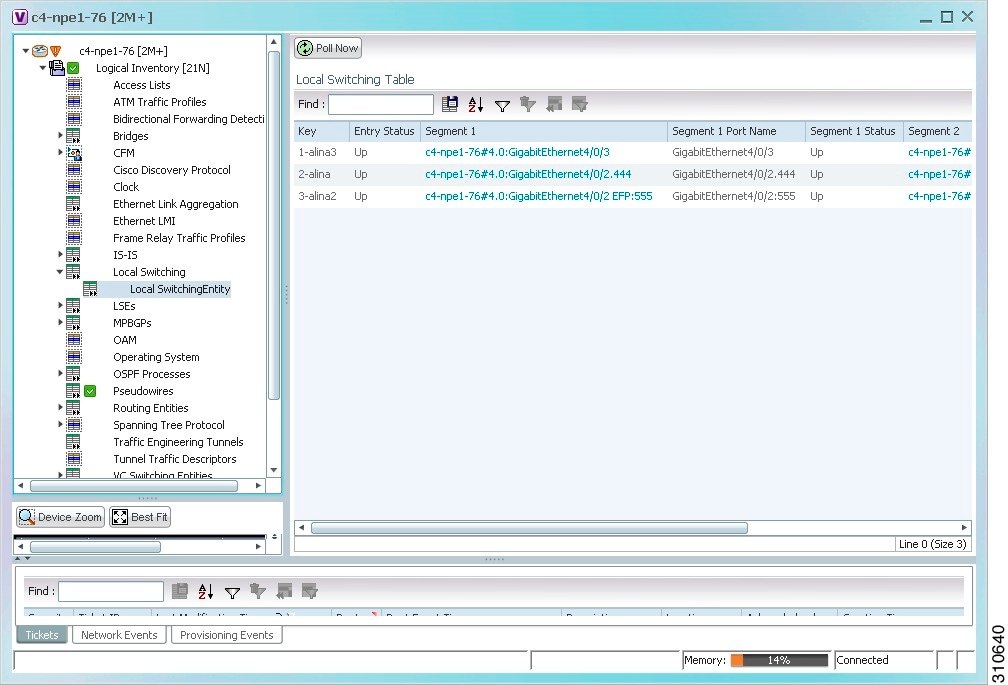
Table 13-36 describes the information displayed for the EFP cross-connects in the Local Switching Table.
Working with VPLS and H-VPLS Instances
Virtual Private LAN Service (VPLS) is a Layer 2 VPN technology that provides Ethernet-based multipoint-to-multipoint communication over MPLS networks. VPLS allows geographically dispersed sites to share an Ethernet broadcast domain by connecting sites through pseudowires. The network emulates a LAN switch or bridge by connecting customer LAN segments to create a single bridged Ethernet LAN.
Hierarchical VPLS (H-VPLS) partitions the network into several edge domains that are interconnected using an MPLS core. The edge devices learn only of their local N-PE devices and therefore do not need large routing table support. The H-VPLS architecture provides a flexible architectural model that enables Ethernet multipoint and point-to-point Layer 2 VPN services, as well as Ethernet access to Layer 3 VPN services, enabling service providers to offer multiple services across a single high-speed architecture.
Prime Network Vision discovers the following VPLS-related information from the network and constructs VPLS instances:
•![]() VSIs
VSIs
•![]() Pseudowires
Pseudowires
•![]() EFPs
EFPs
•![]() Switching entities
Switching entities
Working with VPLS and H-VPLS in Prime Network Vision
Prime Network Vision enables you to:
•![]() Add VPLS instances to a map—See Adding VPLS Instances to a Map.
Add VPLS instances to a map—See Adding VPLS Instances to a Map.
•![]() Apply VPLS overlays—See Applying VPLS Instance Overlays.
Apply VPLS overlays—See Applying VPLS Instance Overlays.
•![]() View link details in VPLS overlays—See Viewing Pseudowire Tunnel Links in VPLS Overlays.
View link details in VPLS overlays—See Viewing Pseudowire Tunnel Links in VPLS Overlays.
•![]() View VPLS-related properties—See the following topics:
View VPLS-related properties—See the following topics:
–![]() Viewing VPLS Instance Properties
Viewing VPLS Instance Properties
–![]() Viewing Virtual Switching Instance Properties
Viewing Virtual Switching Instance Properties
–![]() Viewing VPLS Core or Access Pseudowire Endpoint Properties
Viewing VPLS Core or Access Pseudowire Endpoint Properties
–![]() Viewing VPLS Access Ethernet Flow Point Properties
Viewing VPLS Access Ethernet Flow Point Properties
You can delete a VPLS forward from Prime Network Vision if it is displayed with the reconciliation icon.
Adding VPLS Instances to a Map
You can add the VPLS instances that Prime Network Vision discovers to maps as required.
To add a VPLS instance to a map:
Step 1 ![]() In Prime Network Vision, select the required map or domain.
In Prime Network Vision, select the required map or domain.
Step 2 ![]() Open the Add VPLS Instance to map dialog box in either of the following ways:
Open the Add VPLS Instance to map dialog box in either of the following ways:
•![]() In the toolbar, choose Add to Map > VPLS.
In the toolbar, choose Add to Map > VPLS.
•![]() In the menu bar, choose File > Add to Map > VPLS.
In the menu bar, choose File > Add to Map > VPLS.
Step 3 ![]() In the Add VPLS Instance dialog box, do either of the following:
In the Add VPLS Instance dialog box, do either of the following:
•![]() To search for specific elements:
To search for specific elements:
a. Choose Search.
b. To narrow the display to a range of VPLS instances or a group of VPLS instances, enter a search string in the search field.
c. Click Go.
For example, if you enter VPLS1, the VPLS instances that have names containing the string VPLS1 are displayed.
•![]() To view all available VPLS instances, choose Show All and click Go.
To view all available VPLS instances, choose Show All and click Go.
The VPLS instances that meet the specified search criteria are displayed in the Add VPLS Instance dialog box in table format. The dialog box also displays the date and time at which the list was generated. To update the list, click Refresh.
Note ![]() If an element is not included in your scope, it is displayed with the locked device icon.
If an element is not included in your scope, it is displayed with the locked device icon.
For information about sorting and filtering the table contents, see Filtering and Sorting Tabular Content.
Step 4 ![]() In the Add VPLS Instance dialog box, select the instances that you want to add. You can select and add multiple instances by pressing Ctrl while selecting individual instances or by pressing Ctrl +Shift to select a group of instances.
In the Add VPLS Instance dialog box, select the instances that you want to add. You can select and add multiple instances by pressing Ctrl while selecting individual instances or by pressing Ctrl +Shift to select a group of instances.
Step 5 ![]() Click OK.
Click OK.
The VPLS instance is displayed in the navigation pane and in the content area. In addition, any associated tickets are displayed in the ticket pane. See Figure 13-42.
Figure 13-42 VPLS Instance in Prime Network Vision Map
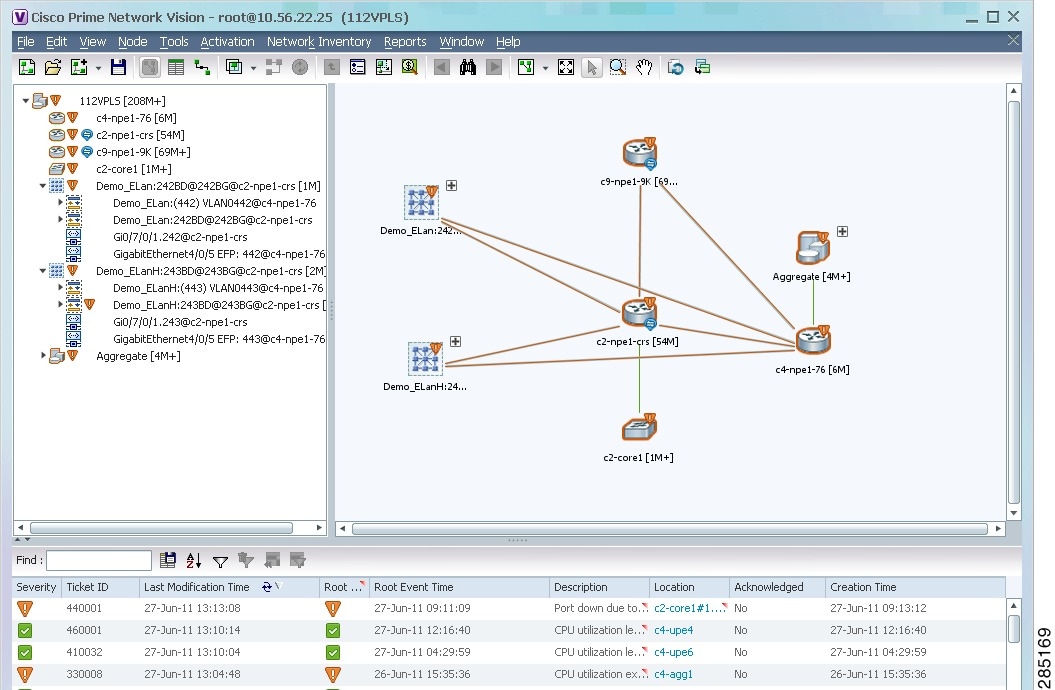
The VPLS instance information is saved with the map in the Prime Network database.
Applying VPLS Instance Overlays
An VPLS instance overlay allows you to isolate the parts of a network that are being used by a specific VPLS instance.
To apply a VPLS instance overlay:
Step 1 ![]() In Prime Network Vision, choose the map in which you want to apply an overlay.
In Prime Network Vision, choose the map in which you want to apply an overlay.
Step 2 ![]() From the toolbar, choose Choose Overlay Type > VPLS.
From the toolbar, choose Choose Overlay Type > VPLS.
Figure 13-43 shows an example of the Select VPLS Instance Overlay for map dialog box.
Figure 13-43 Select VPLS Instance Overlay Dialog Box
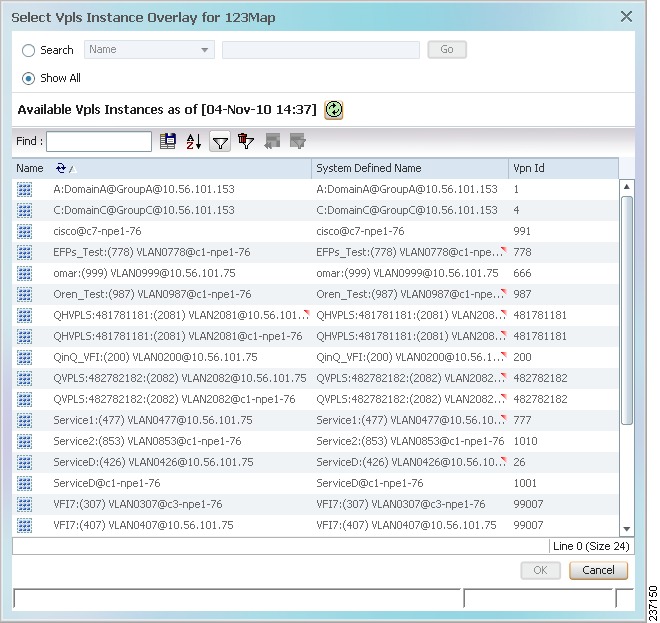
Step 3 ![]() Select the required VPLS instance for the overlay.
Select the required VPLS instance for the overlay.
Step 4 ![]() Click OK.
Click OK.
The elements being used by the selected VPLS instance are highlighted in the map while the other elements are dimmed, as shown in Figure 13-44.
Figure 13-44 VPLS Instance Overlay in Prime Network Vision
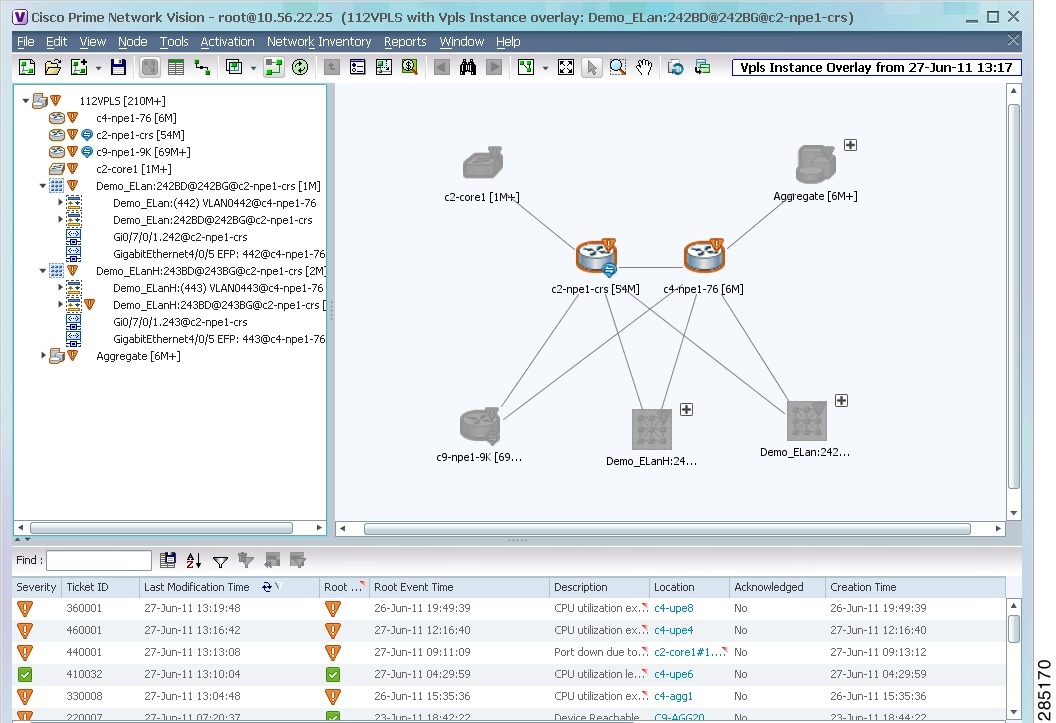
Step 5 ![]() To hide and view the overlay, click Hide Overlay/Show Overlay in the toolbar. The button toggles depending on whether the overlay is currently displayed or hidden.
To hide and view the overlay, click Hide Overlay/Show Overlay in the toolbar. The button toggles depending on whether the overlay is currently displayed or hidden.
Step 6 ![]() To remove the overlay, choose Choose Overlay Type > None.
To remove the overlay, choose Choose Overlay Type > None.
Viewing Pseudowire Tunnel Links in VPLS Overlays
When a VPLS overlay is applied to a map in Prime Network Vision, you can view the details of the pseudowires that are interconnected through selected links.
To view unidirectional or bidirectional pseudowire traffic links when a VPLS overlay is applied to a map:
Step 1 ![]() Right-click the required link in the overlay, and choose Show Callouts. The link must be visible (not dimmed) in the map.
Right-click the required link in the overlay, and choose Show Callouts. The link must be visible (not dimmed) in the map.
Link information is displayed as shown in Figure 13-45.
Figure 13-45 Link Callout Window for a VPLS Overlay
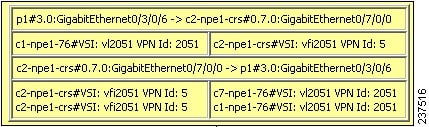
The callout window displays the following information for each link represented by the selected link:
•![]() Link details and direction.
Link details and direction.
•![]() Details of the sites using the link and the interlinks.
Details of the sites using the link and the interlinks.
Step 2 ![]() To view the pseudowire link details, double-click the yellow callout window.
To view the pseudowire link details, double-click the yellow callout window.
The details about the link are displayed in the Link Details window as shown in Figure 13-46.
Figure 13-46 Link Details Window for a VPLS Overlay
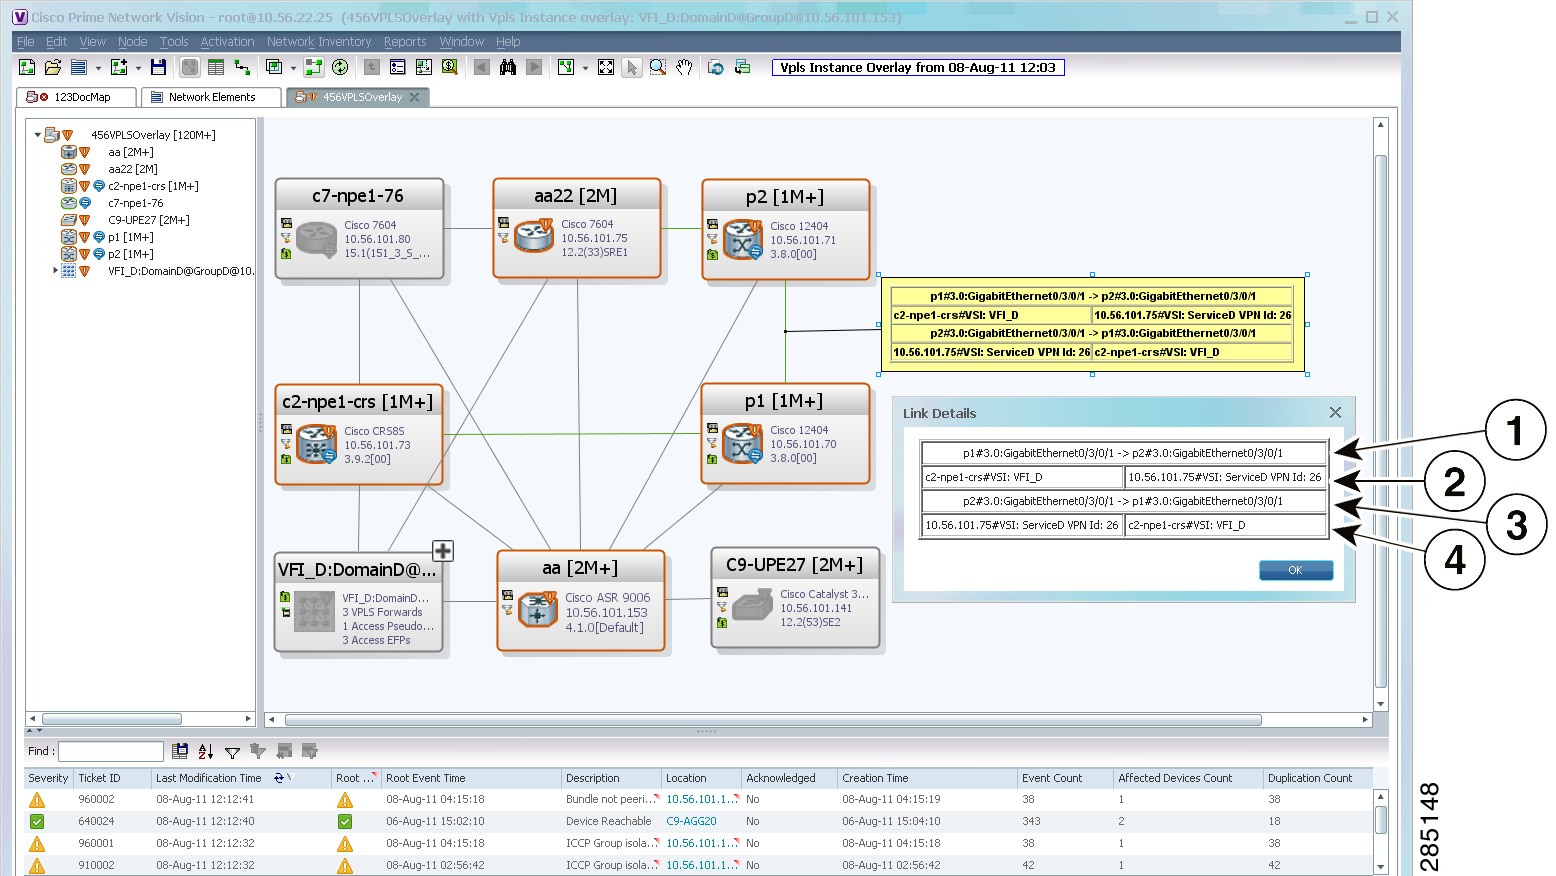
The Link Details window provides the following information:
Step 3 ![]() Click OK to close the Link Details window.
Click OK to close the Link Details window.
Step 4 ![]() To close the link callout window, right-click the selected link, then choose Hide Callouts.
To close the link callout window, right-click the selected link, then choose Hide Callouts.
Viewing VPLS-Related Properties
Prime Network Vision enables you to view the properties of the following VPLS-related elements:
•![]() VPLS instances—See Viewing VPLS Instance Properties.
VPLS instances—See Viewing VPLS Instance Properties.
•![]() Virtual Switching Instances—Viewing Virtual Switching Instance Properties
Virtual Switching Instances—Viewing Virtual Switching Instance Properties
•![]() Tunnels—See Viewing VPLS Core or Access Pseudowire Endpoint Properties.
Tunnels—See Viewing VPLS Core or Access Pseudowire Endpoint Properties.
•![]() Port connectors—See Viewing VPLS Access Ethernet Flow Point Properties.
Port connectors—See Viewing VPLS Access Ethernet Flow Point Properties.
Viewing VPLS Instance Properties
To view the properties of a VPLS instance in Prime Network Vision, open the VPLS Instance Properties window in either of the following ways:
•![]() In the navigation pane or the map pane, right-click the VPLS instance and choose Properties.
In the navigation pane or the map pane, right-click the VPLS instance and choose Properties.
•![]() In the navigation pane or the map pane, select the VPLS instance and choose Node > Properties.
In the navigation pane or the map pane, select the VPLS instance and choose Node > Properties.
Figure 13-47 shows an example of the VPLS Instance Properties window.
Figure 13-47 VPLS Instance Properties Window
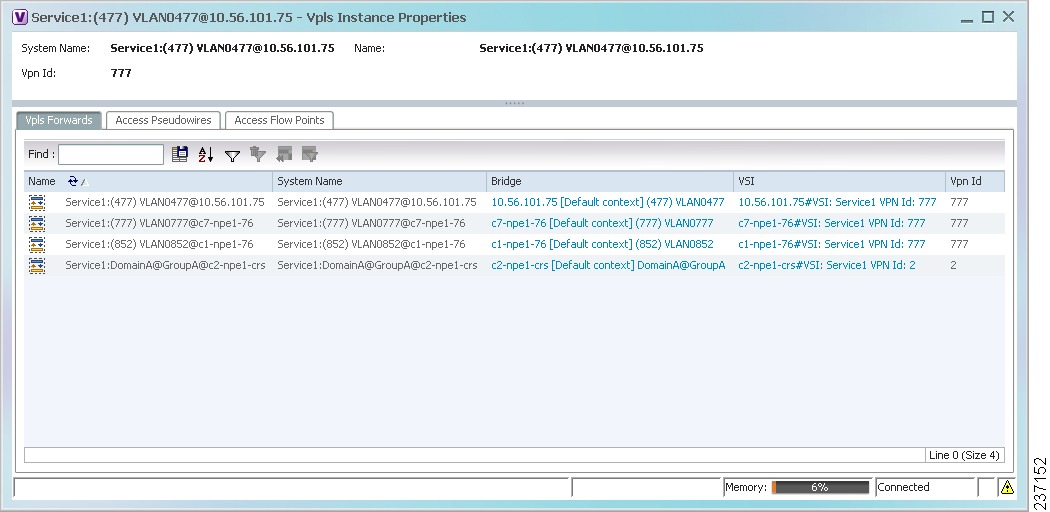
Table 13-37 describes the information that is displayed for VPLS instance properties.
The tabs that appear in the window depend on the VPLS instance and its configuration.
Viewing Virtual Switching Instance Properties
To view VSI properties in Prime Network Vision, open the VSI properties window in either of the following ways:
•![]() Double-click the required device and, in the inventory window, choose Logical Inventory > VSIs > vsi.
Double-click the required device and, in the inventory window, choose Logical Inventory > VSIs > vsi.
•![]() In the navigation pane, expand the VPLS instance, right-click the required VPLS forward, and choose Inventory or Properties. (See Figure 13-48.)
In the navigation pane, expand the VPLS instance, right-click the required VPLS forward, and choose Inventory or Properties. (See Figure 13-48.)
Figure 13-48 VPLS Forward in Prime Network Vision Navigation Pane
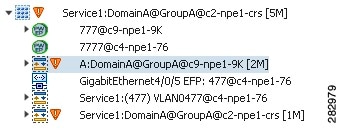
If you right-click the VPLS forward and choose Inventory, the inventory window is displayed. If you right-click the VPLS forward and choose Properties, the VSI Properties window is displayed. The information displayed is the same for both options.
VSI properties are displayed as shown in Figure 13-49.
Figure 13-49 VSI Properties in Logical Inventory
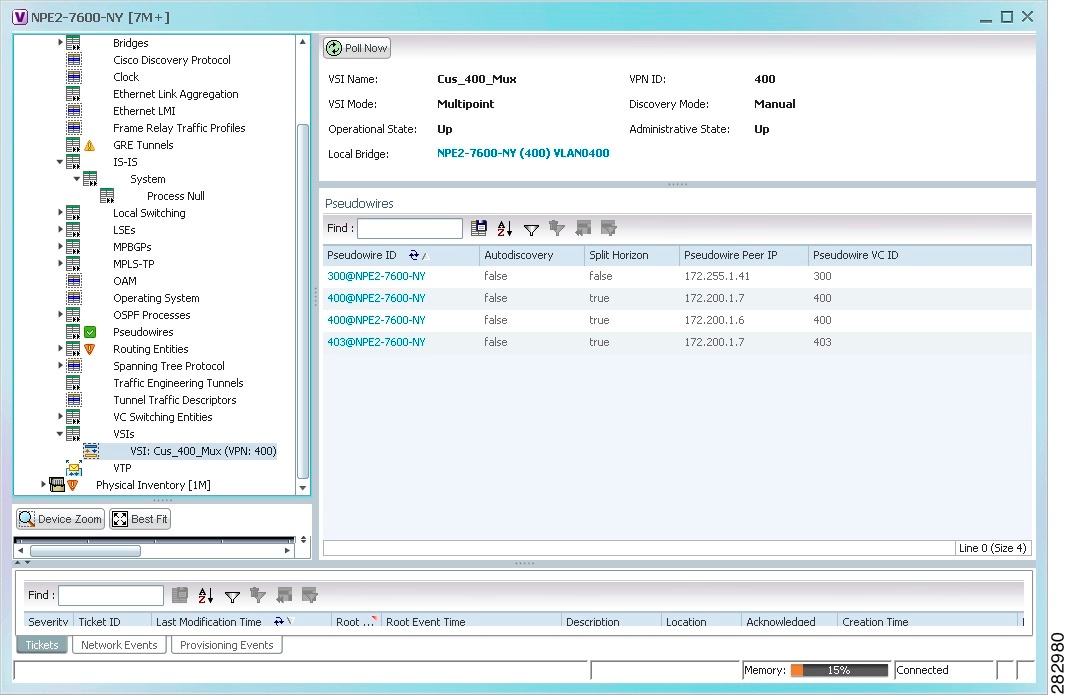
Table 13-38 describes the information that is displayed for the selected VSI.
Viewing VPLS Core or Access Pseudowire Endpoint Properties
Pseudowire endpoints are displayed under VPLS Instance (Access) or VPLS Forward (Core) in the Prime Network Vision navigation pane.
To view pseudowire endpoint properties for a VPLS instance, right-click the required pseudowire endpoint in the navigation pane, and choose Properties. (See Figure 13-50.)
Figure 13-50 VPLS Pseudowire in Prime Network Vision Navigation Pane
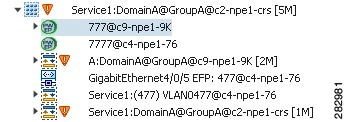
Figure 13-51 shows an example of the Tunnel Properties window that is displayed.
Figure 13-51 VPLS Tunnel Properties Window
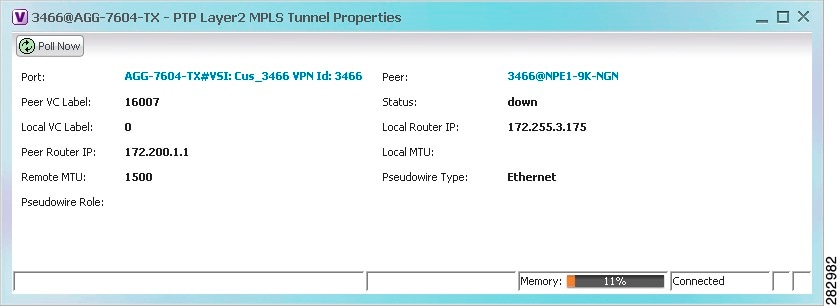
Table 13-39 describes the information that is displayed for pseudowire endpoint properties.
Viewing VPLS Access Ethernet Flow Point Properties
The ports that represent the attachment circuits to VPLS instances are displayed under VPLS instances in the Prime Network Vision navigation pane.
To view the properties for the Access Ethernet Flow Points configured for a VPLS instance, right-click the required interface in the navigation pane, and choose Inventory. (See Figure 13-52.)
Figure 13-52 VPLS Interface in Prime Network Vision Navigation Pane
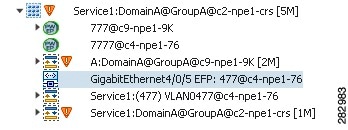
Figure 13-53 shows an example of the information displayed for the interface in physical inventory.
Figure 13-53 EFP Properties in Physical Inventory
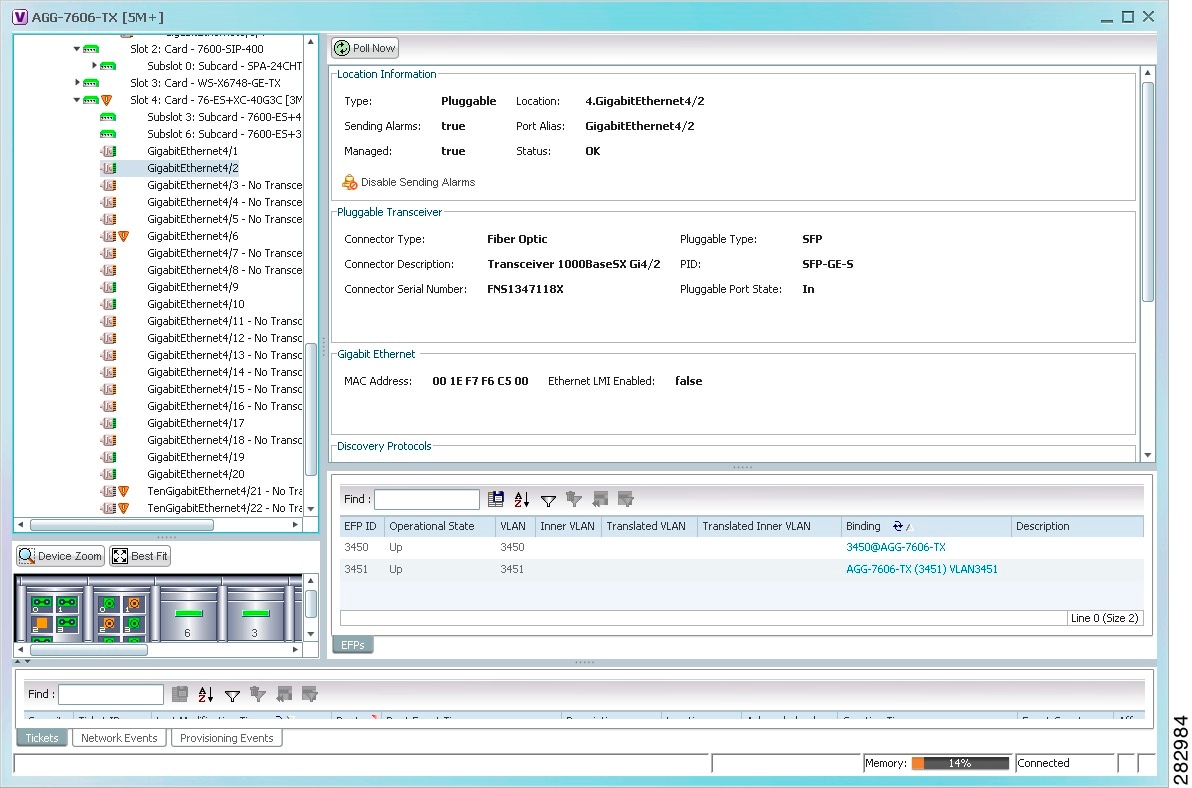
The information displayed in this window is the same as that displayed when the interface is selected in physical inventory.
The following information is displayed, depending on the interface and its configuration:
•![]() Location and interface details.
Location and interface details.
•![]() Technology-related information, such as Ethernet CSMA/CD or ATM IMA properties.
Technology-related information, such as Ethernet CSMA/CD or ATM IMA properties.
•![]() VLAN configuration details.
VLAN configuration details.
•![]() List of the configured subinterfaces on the port. For more information on the Subinterfaces table, see Viewing a Port Configuration.
List of the configured subinterfaces on the port. For more information on the Subinterfaces table, see Viewing a Port Configuration.
•![]() List of the configured EFPs on the port. For more information on the EFPs table, see Viewing EFP Properties.
List of the configured EFPs on the port. For more information on the EFPs table, see Viewing EFP Properties.
•![]() List of VLAN mappings configured on the port. For more information about the VLAN Mappings table, see Viewing VLAN Mappings.
List of VLAN mappings configured on the port. For more information about the VLAN Mappings table, see Viewing VLAN Mappings.
Working with Pseudowires
Prime Network supports the discovery and modeling of Any Transport over MPLS (AToM) and Ethernet over MPLS (EoMPLS) domains that span multisegment pseudowires. After discovery is complete, you can add any of the pseudowires to a map, view their properties in logical inventory, or view their redundancy status.
You can run the psuedowire commands on all Cisco IOS and Cisco IOS XR devices that support pseudowire technology, such as
•![]() Cisco 7200 series routers
Cisco 7200 series routers
•![]() Cisco 7600 series routers
Cisco 7600 series routers
•![]() Cisco ASR 9000 series aggregation services routers
Cisco ASR 9000 series aggregation services routers
•![]() Cisco XR 12000 series routers
Cisco XR 12000 series routers
•![]() Cisco ME 3600X and Cisco ME 3800X Carrier Ethernet Switches
Cisco ME 3600X and Cisco ME 3800X Carrier Ethernet Switches
•![]() Cisco Carrier Packet Transport (CPT) System
Cisco Carrier Packet Transport (CPT) System
For details on the software versions Prime Network supports for these network elements, see the Cisco Prime Network 3.10 Supported Cisco VNEs. To run the pseudowire commands, the software on the network element must support the pseudowire technology.
The following topics describe the options available to you for working with pseudowires in Prime Network:
•![]() Viewing Pseudowire Properties
Viewing Pseudowire Properties
•![]() Displaying Pseudowire Information
Displaying Pseudowire Information
•![]() Viewing Pseudowire Redundancy Service Properties
Viewing Pseudowire Redundancy Service Properties
•![]() Monitoring the Pseudowire Headend
Monitoring the Pseudowire Headend
Adding Pseudowires to a Map
You can add a pseudowire that Prime Network discovers to maps as required.
To add a pseudowire to a map:
Step 1 ![]() In Prime Network Vision, select the required map or domain.
In Prime Network Vision, select the required map or domain.
Step 2 ![]() Open the Add Pseudowire to map dialog box in either of the following ways:
Open the Add Pseudowire to map dialog box in either of the following ways:
•![]() In the toolbar, choose Add to Map > Pseudowire.
In the toolbar, choose Add to Map > Pseudowire.
•![]() In the menu bar, choose File > Add to Map > Pseudowire.
In the menu bar, choose File > Add to Map > Pseudowire.
Figure 13-54 shows an example of the Add Pseudowire dialog box.
Figure 13-54 Add Pseudowire Dialog Box
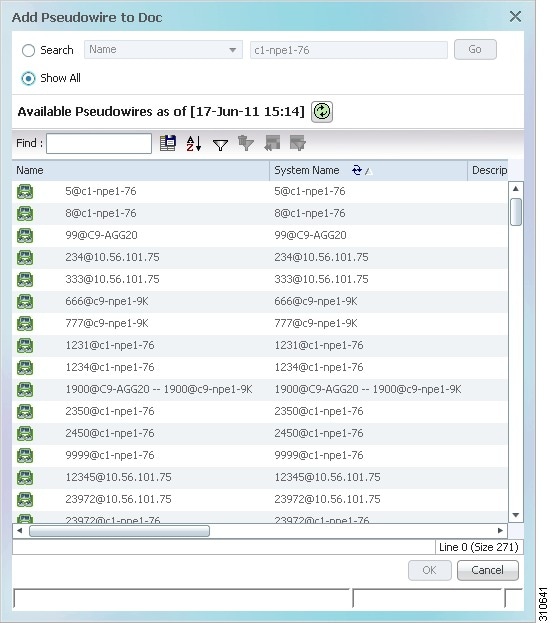
Step 3 ![]() In the Add Pseudowire dialog box, do either of the following:
In the Add Pseudowire dialog box, do either of the following:
•![]() To search for specific elements:
To search for specific elements:
a. Choose Search.
b. To narrow the display to a range of pseudowire or a group of pseudowires, enter a search string in the search field.
c. Click Go.
For example, if you enter pseudo1, the pseudowires that have names containing the string "pseudo1" are displayed.
•![]() To view all available pseudowires, choose Show All and click Go.
To view all available pseudowires, choose Show All and click Go.
The pseudowires that meet the specified search criteria are displayed in the Add Pseudowire dialog box in table format. The dialog box also displays the date and time at which the list was generated. To update the list, click Refresh.
Note ![]() If an element is not included in your scope, it is displayed with the locked device icon.
If an element is not included in your scope, it is displayed with the locked device icon.
For information about sorting and filtering the table contents, see Filtering and Sorting Tabular Content.
Step 4 ![]() In the Add Pseudowire dialog box, select the pseudowires that you want to add. You can select and add multiple pseudowires by pressing Ctrl while selecting individual pseudowires or by pressing Ctrl +Shift to select a group of pseudowires.
In the Add Pseudowire dialog box, select the pseudowires that you want to add. You can select and add multiple pseudowires by pressing Ctrl while selecting individual pseudowires or by pressing Ctrl +Shift to select a group of pseudowires.
Step 5 ![]() Click OK.
Click OK.
The pseudowire is displayed in the navigation pane and in the content area. In addition, any associated tickets are displayed in the ticket pane. See Figure 13-55.
Figure 13-55 Pseudowire in Prime Network Vision Map
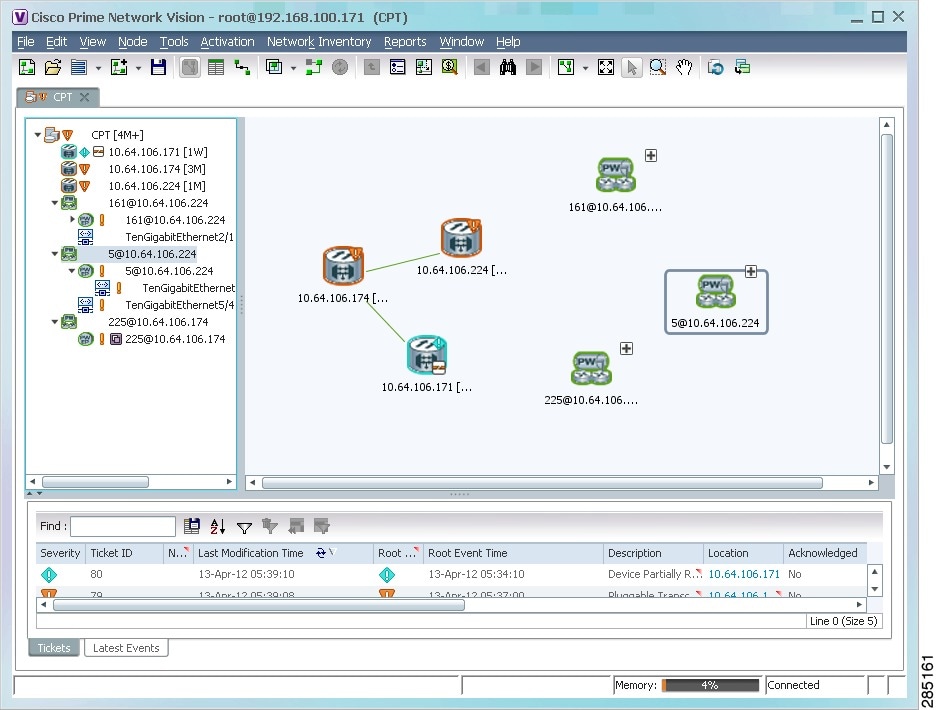
Step 6 ![]() Click the pseudowire in the navigation pane or double-click the pseudowire in the map pane to view the pseudowire components, such as pseudowire endpoints, pseudowire switching entities, and terminating interfaces.
Click the pseudowire in the navigation pane or double-click the pseudowire in the map pane to view the pseudowire components, such as pseudowire endpoints, pseudowire switching entities, and terminating interfaces.
Figure 13-56 shows an example of an expanded pseudowire in Prime Network Vision.
Figure 13-56 Pseudowire Components in Prime Network Vision Maps
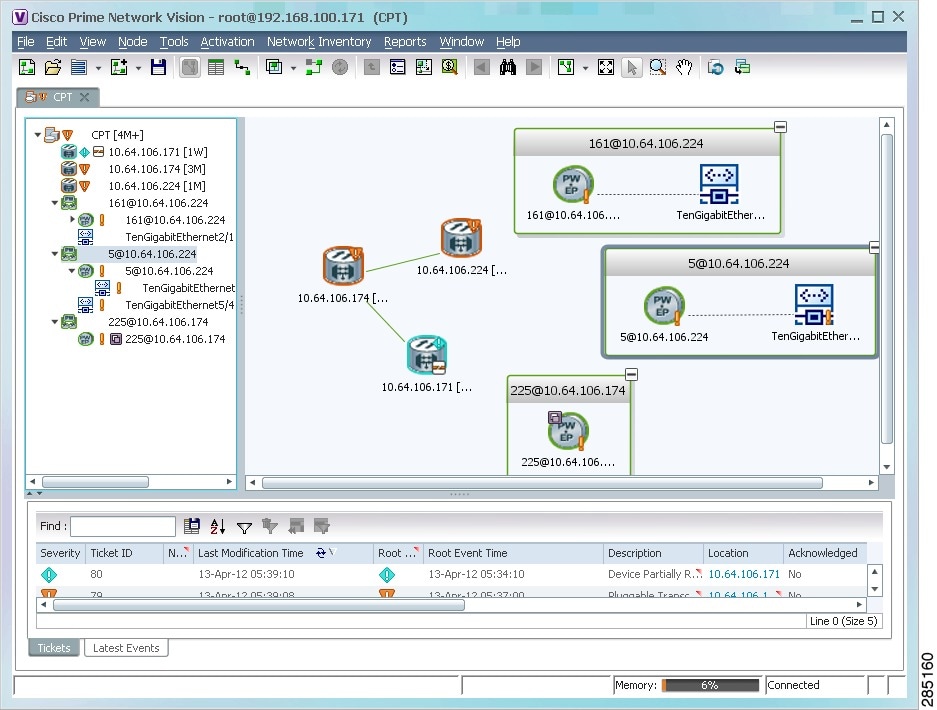
The pseudowire information is saved with the map in the Prime Network database.
Viewing Pseudowire Properties
To view pseudowire properties:
Step 1 ![]() In Prime Network Vision, select the required map or domain.
In Prime Network Vision, select the required map or domain.
Step 2 ![]() To view pseudowire endpoint properties configured on an element:
To view pseudowire endpoint properties configured on an element:
a. ![]() In the navigation or map pane, right-click the required element and then choose Inventory.
In the navigation or map pane, right-click the required element and then choose Inventory.
b. ![]() In the inventory window, choose Logical Inventory > Pseudowires.
In the inventory window, choose Logical Inventory > Pseudowires.
The Tunnel Edges table is displayed, listing the pseudowire endpoints configured on the selected element. For a description of the information contained in the Pseudowires Tunnel Edges table, see Table 19-27.
Step 3 ![]() To view the properties of a pseudowire that you added to a map, do either of the following:
To view the properties of a pseudowire that you added to a map, do either of the following:
•![]() If the pseudowire icon is of the largest size, click the Properties button.
If the pseudowire icon is of the largest size, click the Properties button.
•![]() Right-click the element, and then choose Properties.
Right-click the element, and then choose Properties.
The Pseudowire Properties window is displayed as shown in Figure 13-57.
Figure 13-57 Pseudowire Properties Window
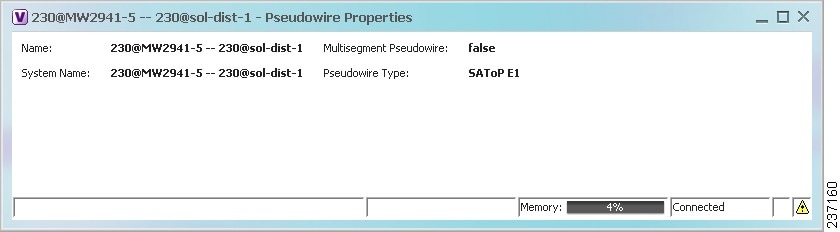
Table 13-40 describes the information presented in the Pseudowire Properties window.
Step 4 ![]() To view the properties of a pseudowire endpoint associated with a pseudowire, right-click the required pseudowire endpoint, and then choose Properties.
To view the properties of a pseudowire endpoint associated with a pseudowire, right-click the required pseudowire endpoint, and then choose Properties.
The Tunnel Properties window containing the pseudowire endpoint properties is displayed as shown in Figure 13-51 and described in Table 13-39.
Step 5 ![]() To view the properties of a pseudowire switching entity associated with the pseudowire, select the switching entity, and then choose Node > Inventory.
To view the properties of a pseudowire switching entity associated with the pseudowire, select the switching entity, and then choose Node > Inventory.
The Local Switching table is displayed as shown in Figure 13-41.
Table 13-36 describes the information displayed in the Local Switching table.
Step 6 ![]() To view the properties of the pseudowire endpoint that terminates on the subinterface, right-click the required interface, and then choose Properties.
To view the properties of the pseudowire endpoint that terminates on the subinterface, right-click the required interface, and then choose Properties.
Note ![]() The selected port must be an Ethernet subinterface for the Contained Current CTPs table to be displayed.
The selected port must be an Ethernet subinterface for the Contained Current CTPs table to be displayed.
Table 13-41 describes the information displayed in the Contained Current CTPs table.
Step 7 ![]() To view the properties of an Ethernet flow point associated with the pseudowire, right-click the EFP and then choose Properties.
To view the properties of an Ethernet flow point associated with the pseudowire, right-click the EFP and then choose Properties.
See Viewing EFP Properties for the information that is displayed for EFPs.
Displaying Pseudowire Information
Note ![]() You might be prompted to enter your device access credentials while exectuing the command. Once you have entered them, these credentials will be used for every subsequent execution of a command in the same GUI client session. If you want to change the credentials, click Edit Credentials. The Edit Credentials button will not be available for SNMP commands or if the command is scheduled for a later time.
You might be prompted to enter your device access credentials while exectuing the command. Once you have entered them, these credentials will be used for every subsequent execution of a command in the same GUI client session. If you want to change the credentials, click Edit Credentials. The Edit Credentials button will not be available for SNMP commands or if the command is scheduled for a later time.
To To view Virtual Circuit Connectivity Verification (VCCV) and Control Channel (CC) information for a pseudowire endpoint:
Step 1 ![]() In the require map, double-click the required device configured for pseudowire.
In the require map, double-click the required device configured for pseudowire.
Step 2 ![]() In the inventory window, choose Logical Inventory > Pseudowire.
In the inventory window, choose Logical Inventory > Pseudowire.
Step 3 ![]() In the Tunnel Edges table, right-click the required interface and choose Commands > Show > Display Pseudowire.
In the Tunnel Edges table, right-click the required interface and choose Commands > Show > Display Pseudowire.
Step 4 ![]() In the Display Pseudowire dialog box, do either of the following:
In the Display Pseudowire dialog box, do either of the following:
•![]() To view the command before running it, click Preview.
To view the command before running it, click Preview.
•![]() To run the command, click Execute.
To run the command, click Execute.
When you click Execute, the results are displayed in the dialog box.
Step 5 ![]() The following information is displayed:
The following information is displayed:
•![]() The element name.
The element name.
•![]() The command issued.
The command issued.
•![]() The results, including:
The results, including:
–![]() VCCV: CC Type—The types of CC processing that are supported. The number indicates the position of the bit that was set in the received octet. The available values are:
VCCV: CC Type—The types of CC processing that are supported. The number indicates the position of the bit that was set in the received octet. The available values are:
- CW [1]—Control Word
- RA [2]—Router Alert
- TTL [3]—Time to Live
- Unkn [x]—Unknown
–![]() Elapsed time—The elapsed time, in seconds.
Elapsed time—The elapsed time, in seconds.
Step 6 ![]() Click Close to close the Display Pseudowire dialog box.
Click Close to close the Display Pseudowire dialog box.
Viewing Pseudowire Redundancy Service Properties
If a pseudowire is configured for redundancy service, a redundancy service badge is applied to the secondary (backup) pseudowire in the navigation and map panes in the Prime Network Vision window. Additional redundancy service details are provided in the inventory window for the device on which the pseudowire is configured.
To view redundancy service properties for pseudowires:
Step 1 ![]() To determine if a pseudowire is configured for redundancy service, expand the required pseudowire in the navigation or map pane.
To determine if a pseudowire is configured for redundancy service, expand the required pseudowire in the navigation or map pane.
If the pseudowire is configured for redundancy service, the redundancy service badge appears in the navigation and map panes as shown in Figure 13-58.
Figure 13-58 Pseudowire Redundancy Service Badge in a Map
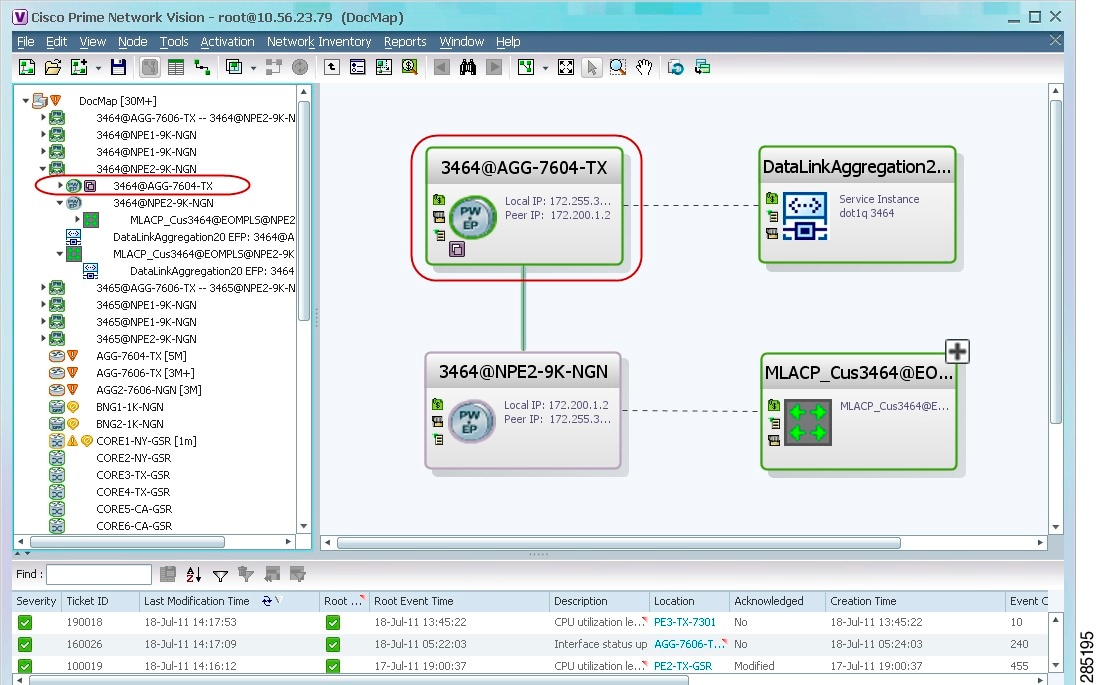
Step 2 ![]() To view additional details, in the map, double-click the element with the redundancy service badge.
To view additional details, in the map, double-click the element with the redundancy service badge.
The PTP Layer 2 MPLS Tunnel Properties window is displayed as shown in Figure 13-59 and shows that the selected pseudowire has a Secondary role in a redundancy service.
Figure 13-59 Layer 2 MPLS Tunnel Properties for Pseudowire Redundancy Service
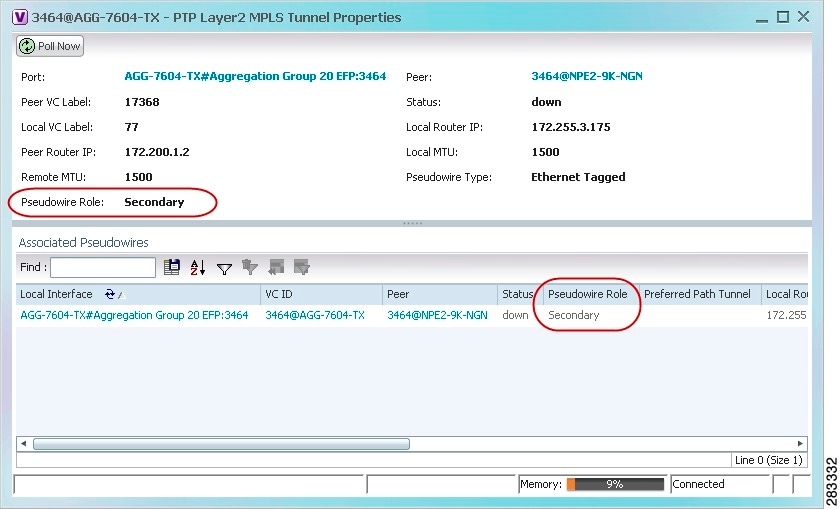
Step 3 ![]() In the PTP Layer 2 MPLS Tunnel Properties window, click the VC ID hyperlink.
In the PTP Layer 2 MPLS Tunnel Properties window, click the VC ID hyperlink.
The Tunnel Edges table in logical inventory is displayed, with the local interface selected in the table. (See Figure 13-60.)
Figure 13-60 Pseudowire Redundancy Service in Logical Inventory
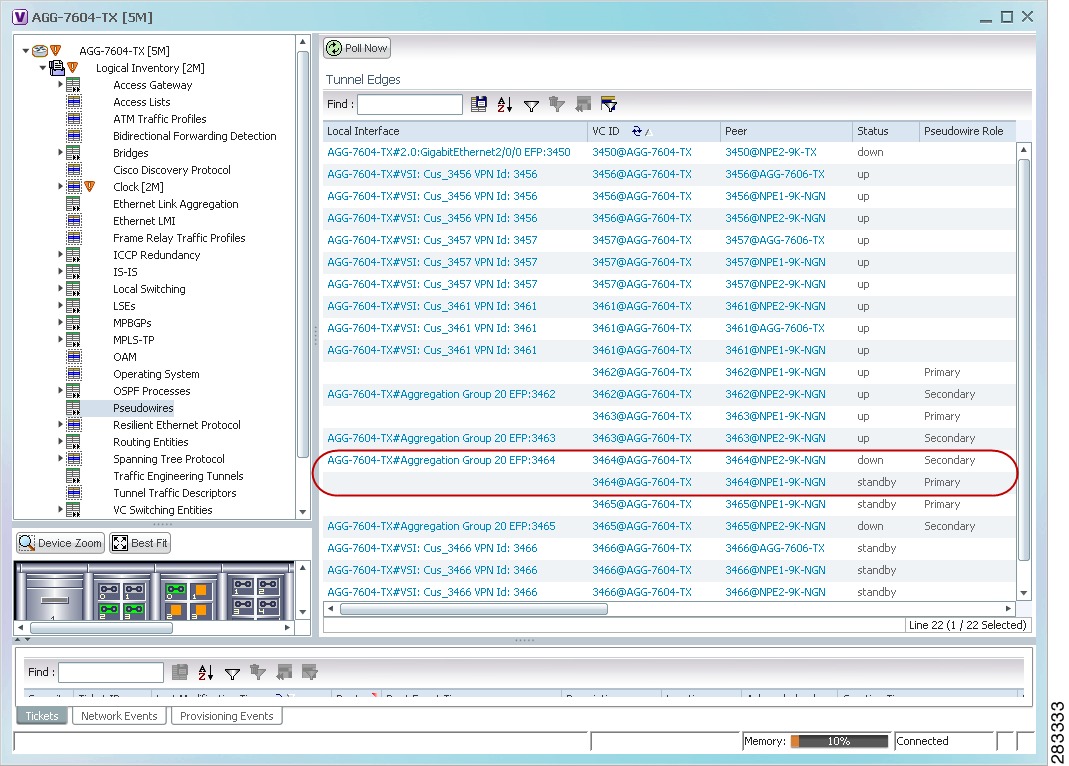
The entries indicate that the selected tunnel edge has a Secondary role in the first VC and a Primary role in the second VC.
For more information about the Pseudowires Tunnel Edges table, see Table 19-27.
Applying Pseudowire Overlays
A pseudowire overlay allows you to isolate the parts of a network that are used by a specific pseudowire.
To apply a pseudowire overlay:
Step 1 ![]() In Prime Network Vision, choose the map in which you want to apply an overlay.
In Prime Network Vision, choose the map in which you want to apply an overlay.
Step 2 ![]() From the toolbar, choose Choose Overlay Type > Pseudowire.
From the toolbar, choose Choose Overlay Type > Pseudowire.
Figure 13-61 shows an example of the Select Pseudowire Overlay for map dialog box.
Figure 13-61 Select Pseudowire Overlay Dialog Box
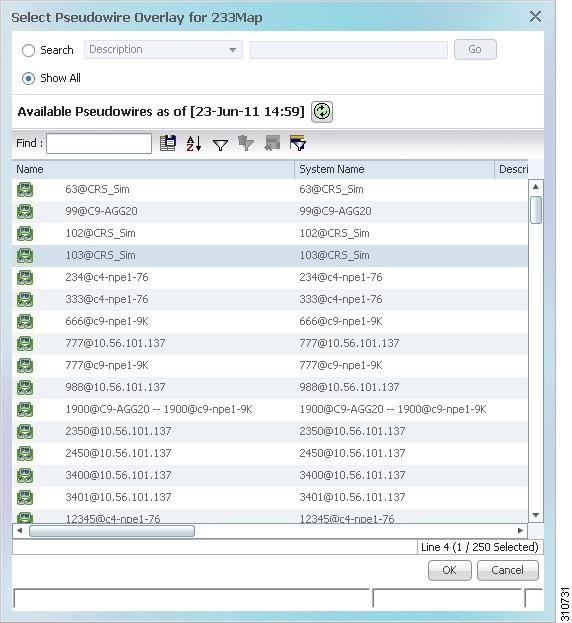
Step 3 ![]() Select the required pseudowire for the overlay.
Select the required pseudowire for the overlay.
Step 4 ![]() Click OK.
Click OK.
The elements being used by the selected pseudowire are highlighted in the map while the other elements are dimmed, as shown in Figure 13-62.
Figure 13-62 Pseudowire Overlay in Prime Network Vision
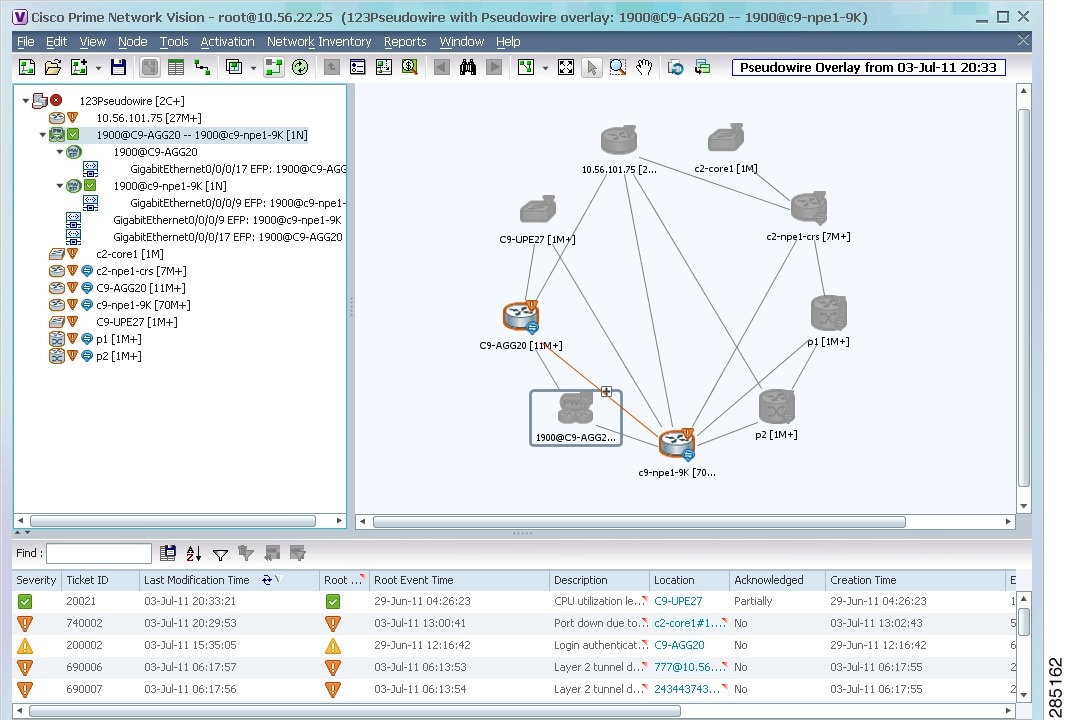
Step 5 ![]() To hide and view the overlay, click Hide Overlay/Show Overlay in the toolbar. The button toggles depending on whether the overlay is currently displayed or hidden.
To hide and view the overlay, click Hide Overlay/Show Overlay in the toolbar. The button toggles depending on whether the overlay is currently displayed or hidden.
Step 6 ![]() To remove the overlay, choose Choose Overlay Type > None.
To remove the overlay, choose Choose Overlay Type > None.
Monitoring the Pseudowire Headend
A pseudowire (PW) is an emulation of a point-to-point connection over a packet-switching network (PSN). It operates over a uniform packet-based access/aggregation network. The composite L2 AC and the PW segment together form a point-to-point virtual CE-PE link that functions like a traditional CE-PE link technology.
Figure 13-63 displays a typical pseudowrie deployment over core network and Figure 13-64 displays a pseduowire deployment over access network.
Figure 13-63 Pseudowire Deployment Over Core Network
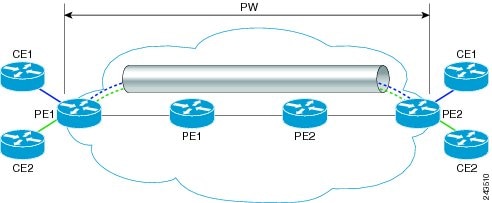
Figure 13-64 Pseudowire Deployment Over Access Network
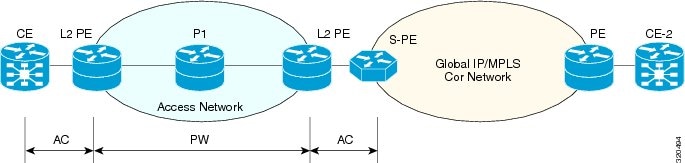
A pseudowire headend (PW-HE) virtual interface originates as a PW on an access node and terminates on a Layer 3 service instance on the service provider router. For example, a PWHE can originate on the Layer 2 PW feeder node and terminate on a VRF instance on the Cisco CRS Router. You can configure all ingress and egress QoS function on the PW-HE interface, including policing, shaping, queuing, and hierarchical policies.
In other words, the PW-HE is a technology that allows termination of access or aggregation pseduowires into an L2 or L3 domain. It allows us to replace a 2-node solution with a 1-node solution. Without a PW-HE, a L2 PE node must terminate a PW and then handoff the data to a S-PE via an Access Circuit.
The following figure displays the PW-HE interface:
Figure 13-65 PW-HE Interface
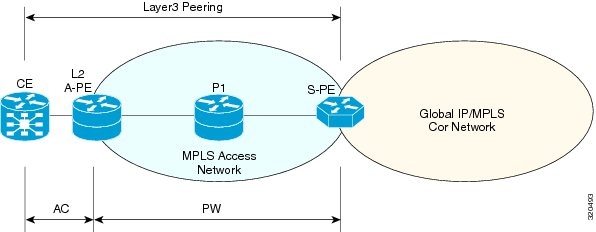
The PW-HE interface is treated like any existing L3 interface and operates on one of the following nodes:
•![]() Bridged interworking (VC type 5 or 4) node—PW will carry customer Ethernet frames with IP payload. The S-PE device must perform ARP resolution for customer IP addresses learnt over PW-HE, which acts as a broadcast interface.
Bridged interworking (VC type 5 or 4) node—PW will carry customer Ethernet frames with IP payload. The S-PE device must perform ARP resolution for customer IP addresses learnt over PW-HE, which acts as a broadcast interface.
•![]() IP interworking node (VC type 11)—The PW-HE acts as a point-to-point interface. Hence, there will be two types of PW-HE interface-PW-Ether and PW-IW. These PW's can terminate into a VRF or the IP global table on SP-E.
IP interworking node (VC type 11)—The PW-HE acts as a point-to-point interface. Hence, there will be two types of PW-HE interface-PW-Ether and PW-IW. These PW's can terminate into a VRF or the IP global table on SP-E.
Viewing the PW-HE configuration
To view the PW-HE configuration:
Step 1 ![]() Right-click the required device in Prime Network Vision and choose Inventory.
Right-click the required device in Prime Network Vision and choose Inventory.
Step 2 ![]() In the logical inventory window, choose Logical Inventory > PW-HE. The list of PW-HE interfaces configured in Prime Network are displayed in the content pane.
In the logical inventory window, choose Logical Inventory > PW-HE. The list of PW-HE interfaces configured in Prime Network are displayed in the content pane.
Step 3 ![]() From the PW-HE node, choose a PW-HE interface. The PW-HE interface details are displayed in the content pane as shown in Figure 13-66.
From the PW-HE node, choose a PW-HE interface. The PW-HE interface details are displayed in the content pane as shown in Figure 13-66.
Figure 13-66 PW-HE Configuration Details
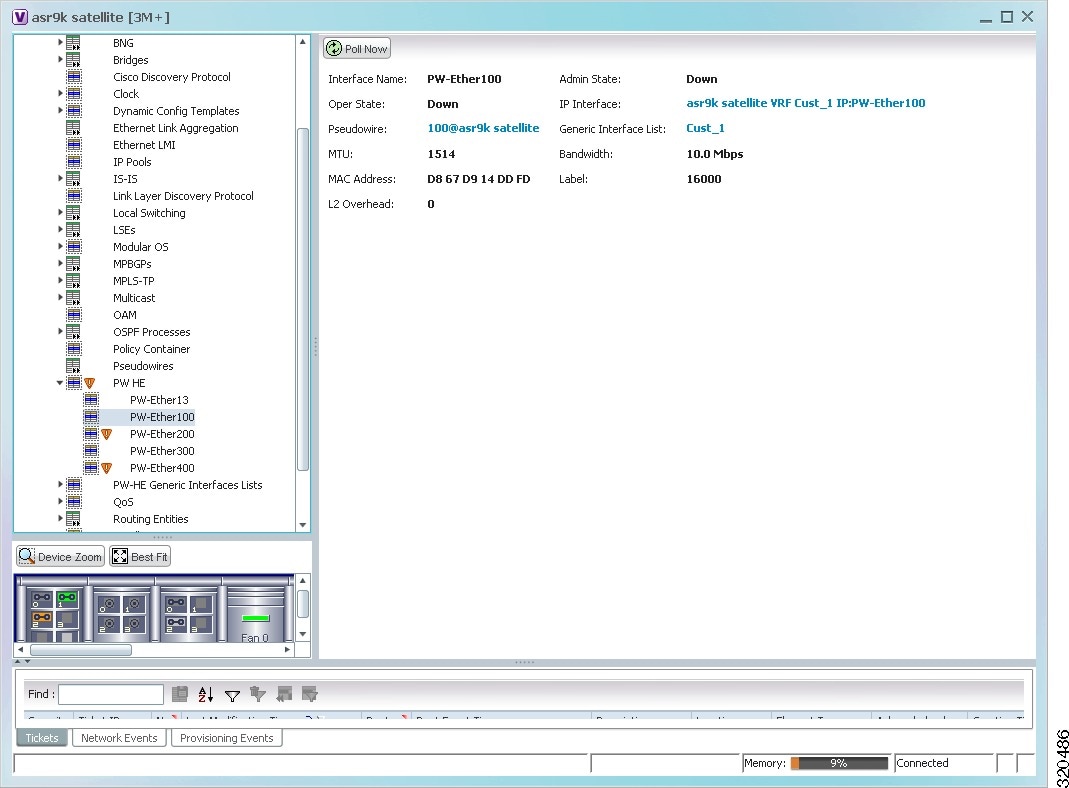
Table 13-42 displays the PW-HE interface details.
You can also view the following configuration details for a PW-HE interface:
•![]() Viewing PW-HE Configured as a Local Interface under Pseudowire
Viewing PW-HE Configured as a Local Interface under Pseudowire
•![]() Viewing PW-HE Generic Interface List
Viewing PW-HE Generic Interface List
•![]() Viewing PW-HE as an Associated Entity for a Routing Entity
Viewing PW-HE as an Associated Entity for a Routing Entity
•![]() Viewing PW-HE as an Associated Entity for a VRF
Viewing PW-HE as an Associated Entity for a VRF
Viewing PW-HE Configured as a Local Interface under Pseudowire
To view the local interface details:
Step 1 ![]() Right-click the required device in Prime Network Vision and choose Inventory.
Right-click the required device in Prime Network Vision and choose Inventory.
Step 2 ![]() In the logical inventory window, choose Logical Inventory > Pseudowire. The list of Pseudowire interfaces configured in Prime Network are displayed in the content pane. For more information on Pseudowire properties, see Viewing Pseudowire Properties.
In the logical inventory window, choose Logical Inventory > Pseudowire. The list of Pseudowire interfaces configured in Prime Network are displayed in the content pane. For more information on Pseudowire properties, see Viewing Pseudowire Properties.
•![]()
Viewing PW-HE Generic Interface List
To view the PW-HE generic interface list:
Step 1 ![]() Right-click the required device in Prime Network Vision and choose Inventory.
Right-click the required device in Prime Network Vision and choose Inventory.
Step 2 ![]() In the logical inventory window, choose Logical Inventory > PW-HE Generic Interface List. The list of generic interfaces configured in Prime Network are displayed in the content pane.
In the logical inventory window, choose Logical Inventory > PW-HE Generic Interface List. The list of generic interfaces configured in Prime Network are displayed in the content pane.
Step 3 ![]() From the PW-HE Generic Interface List node, choose a generic interface list. The interface details are displayed in the content pane.
From the PW-HE Generic Interface List node, choose a generic interface list. The interface details are displayed in the content pane.
Table 13-43 displays the PW-HE Generic Interface List details.
Viewing PW-HE as an Associated Entity for a Routing Entity
To view the routing entity details for a PW-HE:
Step 1 ![]() Right-click the required device in Prime Network Vision and choose Inventory.
Right-click the required device in Prime Network Vision and choose Inventory.
Step 2 ![]() In the logical inventory window, choose Logical Inventory > Routing Entities > Routing Entity. The routing entity details for the PW-HE is displayed in the content pane. For more information on Routing entity details, see Viewing Routing Entities.
In the logical inventory window, choose Logical Inventory > Routing Entities > Routing Entity. The routing entity details for the PW-HE is displayed in the content pane. For more information on Routing entity details, see Viewing Routing Entities.
Viewing PW-HE as an Associated Entity for a VRF
To view the VRF details for a PW-HE:
Step 1 ![]() Right-click the required device in Prime Network Vision and choose Inventory.
Right-click the required device in Prime Network Vision and choose Inventory.
Step 2 ![]() In the logical inventory window, choose Logical Inventory > VRF > PW-HE node. The VRF details for the PW-HE is displayed in the content pane. For more information on VRF details, see Viewing VRF Properties.
In the logical inventory window, choose Logical Inventory > VRF > PW-HE node. The VRF details for the PW-HE is displayed in the content pane. For more information on VRF details, see Viewing VRF Properties.
Working with Ethernet Services
Ethernet services are created when the following business elements are linked to one another:
•![]() Network VLAN and bridge domain are linked through a shared EFP.
Network VLAN and bridge domain are linked through a shared EFP.
•![]() Network VLAN and VPLS instance are linked through either of the following:
Network VLAN and VPLS instance are linked through either of the following:
–![]() A shared, standalone EFP.
A shared, standalone EFP.
–![]() A shared switching entity.
A shared switching entity.
•![]() Network VLAN and network pseudowire (single or multi-segment) are linked through either of the following:
Network VLAN and network pseudowire (single or multi-segment) are linked through either of the following:
–![]() A shared, standalone EFP.
A shared, standalone EFP.
–![]() A shared switching entity.
A shared switching entity.
•![]() VPLS-EoMPLS connected via a shared access pseudowire endpoint.
VPLS-EoMPLS connected via a shared access pseudowire endpoint.
•![]() Network VLAN and cross-connect are connected by a shared EFP.
Network VLAN and cross-connect are connected by a shared EFP.
•![]() Network VLAN and service link are connected by a shared EFP.
Network VLAN and service link are connected by a shared EFP.
If a VPLS, network pseudowire, cross-connect, or network VLAN object is not connected to another business element, it resides alone in an Ethernet service.
In releases prior to Prime Network Vision 3.8, EVC multiplex was discovered by means of Ethernet flow point associations. Beginning with Prime Network Vision 3.8, multiplex capabilities were enhanced to distinguish multiplexed services based on the Customer VLAN ID; that is, Prime Network Vision 3.9 is Inner Tag-aware.
As a result, in environments in which service providers have customers with multiplexed services, an EVC can distinguish each service and create its own EVC representation.
Prime Network Vision discovers Ethernet services and enables you to add them to maps, apply overlays, and view their properties. See the following topics for more information:
•![]() Adding Ethernet Services to a Map
Adding Ethernet Services to a Map
•![]() Applying Ethernet Service Overlays
Applying Ethernet Service Overlays
•![]() Viewing Ethernet Service Properties
Viewing Ethernet Service Properties
Adding Ethernet Services to a Map
You can add the Ethernet services that Prime Network Vision discovers to maps as required.
To add an Ethernet service to a map:
Step 1 ![]() In Prime Network Vision, select the required map or domain.
In Prime Network Vision, select the required map or domain.
Step 2 ![]() Open the Add Ethernet Service to map dialog box in either of the following ways:
Open the Add Ethernet Service to map dialog box in either of the following ways:
•![]() In the toolbar, choose Add to Map > Ethernet Service.
In the toolbar, choose Add to Map > Ethernet Service.
•![]() In the menu bar, choose File > Add to Map > Ethernet Service.
In the menu bar, choose File > Add to Map > Ethernet Service.
Step 3 ![]() In the Add Ethernet Service dialog box, do either of the following:
In the Add Ethernet Service dialog box, do either of the following:
•![]() To search for specific elements:
To search for specific elements:
a. Choose Search, and then choose a search category: EVC Terminating EFPs, Name, or System Name.
b. To narrow the display to a range of Ethernet services or a group of Ethernet services, enter a search string in the search field.
c. Click Go.
For example, if you choose Name and enter EFP1, the network elements that have names beginning with EFP1 are displayed.
•![]() To view all available Ethernet services, choose Show All and click Go.
To view all available Ethernet services, choose Show All and click Go.
The available elements that meet the specified search criteria are displayed in the Add Ethernet Service dialog box in table format. The dialog box also displays the date and time at which the list was generated. To update the list, click Refresh.
Note ![]() If an element is not included in your scope, it is displayed with the locked device icon.
If an element is not included in your scope, it is displayed with the locked device icon.
For information about sorting and filtering the table contents, see Filtering and Sorting Tabular Content.
Step 4 ![]() In the Add Ethernet Service dialog box, select the elements that you want to add. You can select and add multiple elements by pressing Ctrl while selecting individual elements or by pressing Ctrl +Shift to select a group of elements.
In the Add Ethernet Service dialog box, select the elements that you want to add. You can select and add multiple elements by pressing Ctrl while selecting individual elements or by pressing Ctrl +Shift to select a group of elements.
Step 5 ![]() Click OK.
Click OK.
The Ethernet service is displayed in the navigation pane and in the content area. In addition, any associated tickets are displayed in the ticket pane. See Figure 13-67.
Figure 13-67 Ethernet Service in Prime Network Vision
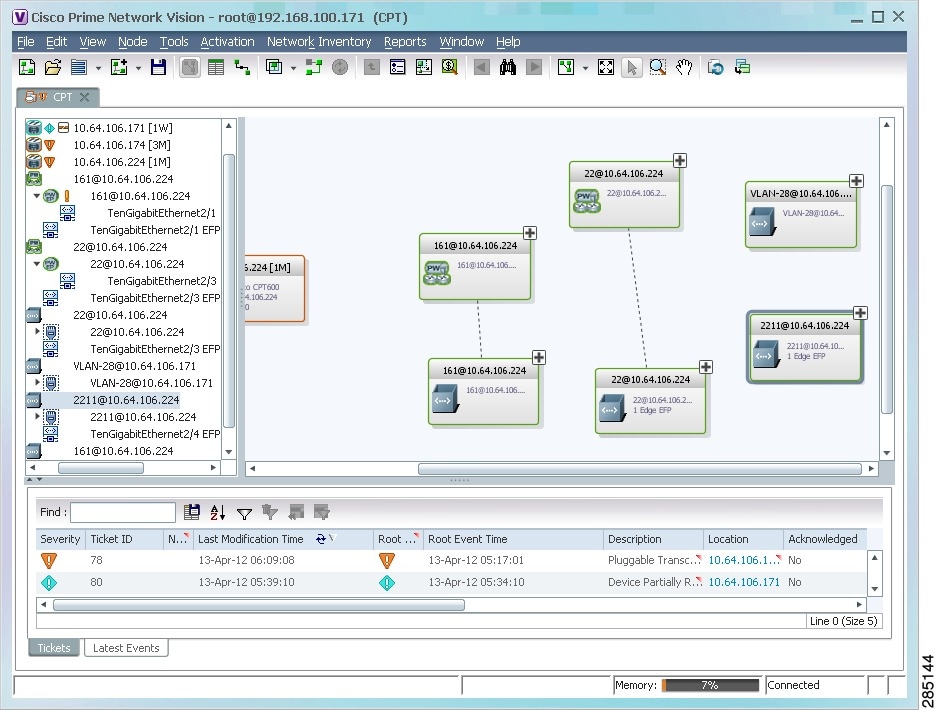
The Ethernet service information is saved with the map in the Prime Network database.
Applying Ethernet Service Overlays
An Ethernet service overlay allows you to isolate the parts of a network that are being used by a specific Ethernet service.
To apply an Ethernet service overlay:
Step 1 ![]() In Prime Network Vision, choose the map in which you want to apply an overlay.
In Prime Network Vision, choose the map in which you want to apply an overlay.
Step 2 ![]() From the toolbar, choose Choose Overlay Type > Ethernet Service.
From the toolbar, choose Choose Overlay Type > Ethernet Service.
Figure 13-68 shows an example of the Select Ethernet Service Overlay for map dialog box.
Figure 13-68 Select Ethernet Service Overlay Dialog Box
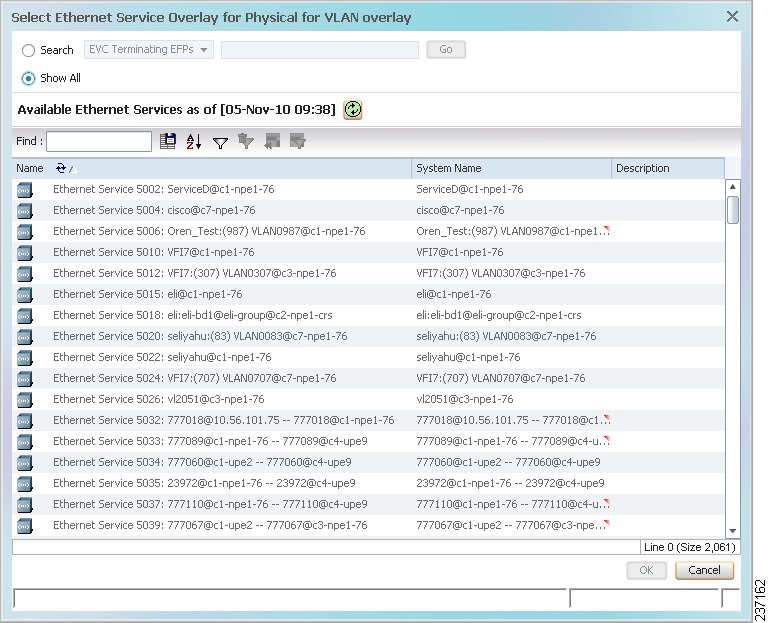
Step 3 ![]() Select the required Ethernet Service for the overlay.
Select the required Ethernet Service for the overlay.
Step 4 ![]() Click OK.
Click OK.
The elements being used by the selected Ethernet service are highlighted in the map while the other elements are dimmed, as shown in Figure 13-69.
Figure 13-69 Ethernet Service Overlay in Prime Network Vision
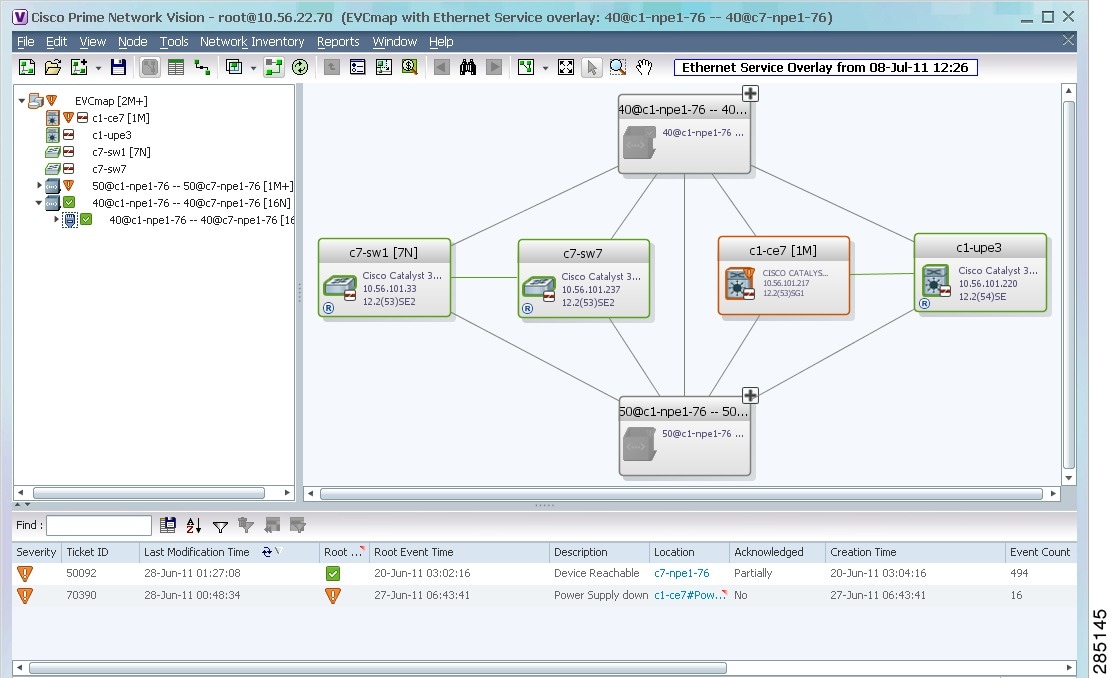
Step 5 ![]() To hide and view the overlay, click Hide Overlay/Show Overlay in the toolbar. The button toggles depending on whether the overlay is currently displayed or hidden.
To hide and view the overlay, click Hide Overlay/Show Overlay in the toolbar. The button toggles depending on whether the overlay is currently displayed or hidden.
Step 6 ![]() To remove the overlay, choose Choose Overlay Type > None.
To remove the overlay, choose Choose Overlay Type > None.
Viewing Ethernet Service Properties
To view Ethernet service properties:
Step 1 ![]() In Prime Network Vision, select the map containing the required Ethernet service.
In Prime Network Vision, select the map containing the required Ethernet service.
Step 2 ![]() In the navigation or map pane, right-click the Ethernet service and choose Properties.
In the navigation or map pane, right-click the Ethernet service and choose Properties.
Figure 13-70 shows an example of an Ethernet Service Properties window with the EVC Terminating table. Depending on the types of service in the EVC, tabs might be displayed. For example, if the EVC contains two network VLANs and a VPLS, tabs are displayed for the following:
•![]() EVC Terminating table
EVC Terminating table
•![]() Network VLANs
Network VLANs
•![]() VPLS
VPLS
Figure 13-70 Ethernet Service Properties Window
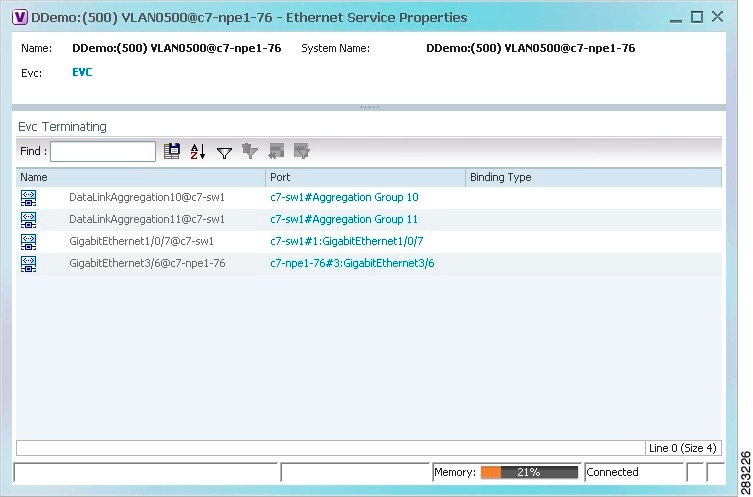
Table 13-44 describes the information that is displayed for an Ethernet service.
Step 3 ![]() To view the EVC Properties window, click the hyperlink in the EVC field.
To view the EVC Properties window, click the hyperlink in the EVC field.
Figure 13-71 shows an example of the EVC Properties window.
Figure 13-71 EVC Properties Window
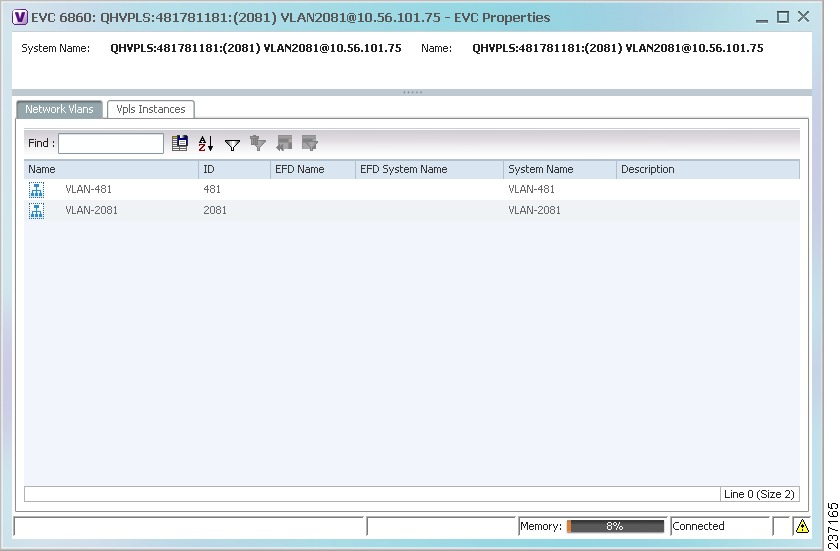
Table 13-45 describes the information that is displayed in the EVC Properties window. The tabs that are displayed depend on the services included in the EVC. For example, if the EVC contains two network VLANs and a VPLS, tabs are displayed for the following:
•![]() EVC Terminating table
EVC Terminating table
•![]() Network VLANs
Network VLANs
•![]() VPLS
VPLS
Viewing IP SLA Responder Service Properties
Cisco IOS Service Level Agreements (SLAs) software allows you to analyze IP service levels for IP applications and services by using active traffic monitoring to measure network performance.
The IP SLA responder is a component embedded in the destination Cisco device that allows the system to anticipate and respond to IP SLAs request packets. The responder provides accurate measurements without requiring dedicated probes. The responder uses the Cisco IOS IP SLAs Control Protocol to provide a mechanism through which it can be notified on which port it should listen and respond.
Two-Way Active Measurement Protocol (TWAMP) defines a standard for measuring round-trip network performance between any two devices that support the protocol.
Prime Network Vision supports IP SLA Responder service on the following devices:
•![]() Cisco 3400ME and 3750ME devices running Cisco IOS 12.2(52)SE.
Cisco 3400ME and 3750ME devices running Cisco IOS 12.2(52)SE.
•![]() Cisco MWR2941 devices running Cisco CSR 3.2.
Cisco MWR2941 devices running Cisco CSR 3.2.
To view IP SLA Responder service properties:
Step 1 ![]() In Prime Network Vision, double-click the device configured for IP SLA Responder service.
In Prime Network Vision, double-click the device configured for IP SLA Responder service.
Step 2 ![]() In the inventory window, choose Logical Inventory > IP SLA Responder.
In the inventory window, choose Logical Inventory > IP SLA Responder.
IP SLA Responder properties are displayed as shown in Figure 13-72.
Figure 13-72 IP SLA Responder in Logical Inventory
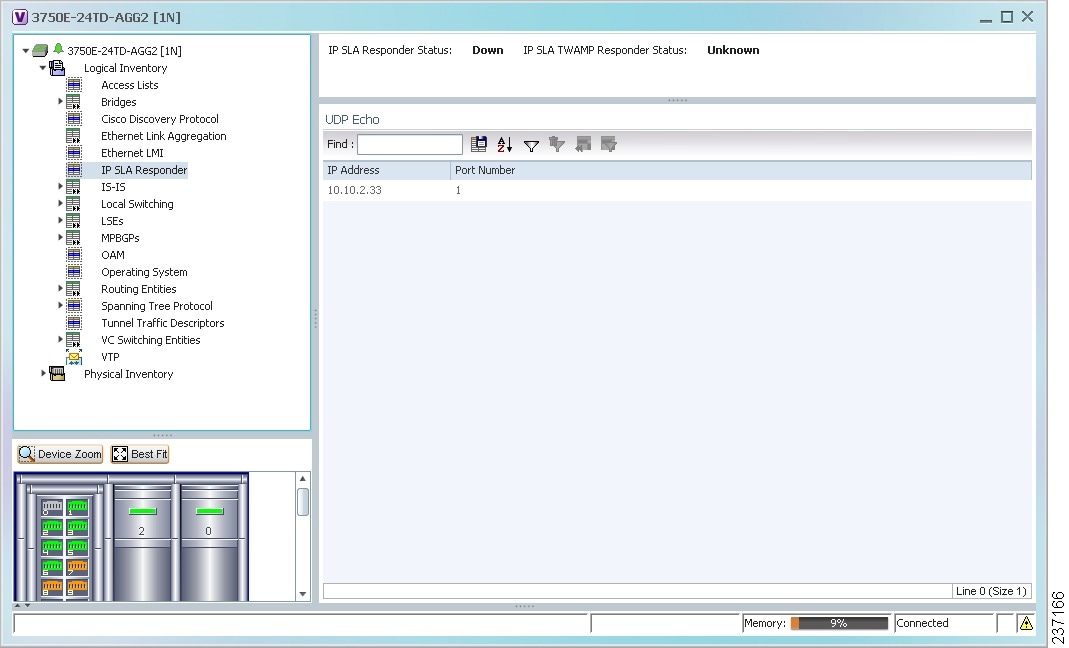
Table 13-46 describes the properties displayed for IP SLA Responder service.
Viewing IS-IS Properties
Intermediate System-to-Intermediate System (IS-IS) protocol is a routing protocol developed by the ISO. It is a link-state protocol where IS routers exchange routing information based on a single metric to determine network topology. It behaves in a manner similar to OSPF in the TCP/IP network.
IS-IS networks contain end systems, intermediate systems, areas, and domains. End systems are user devices. Intermediate systems are routers. Routers are organized into local groups called areas, and areas are grouped into a domain. For configuring IS-IS, see Configuring IS-IS.
To view IS-IS properties:
Step 1 ![]() In Prime Network Vision, double-click the device configured for IS-IS.
In Prime Network Vision, double-click the device configured for IS-IS.
Step 2 ![]() In the inventory window, choose Logical Inventory > IS-IS > System.
In the inventory window, choose Logical Inventory > IS-IS > System.
Figure 13-73 shows an example of the IS-IS window with the Process table in logical inventory.
Figure 13-73 IS-IS Window in Logical Inventory
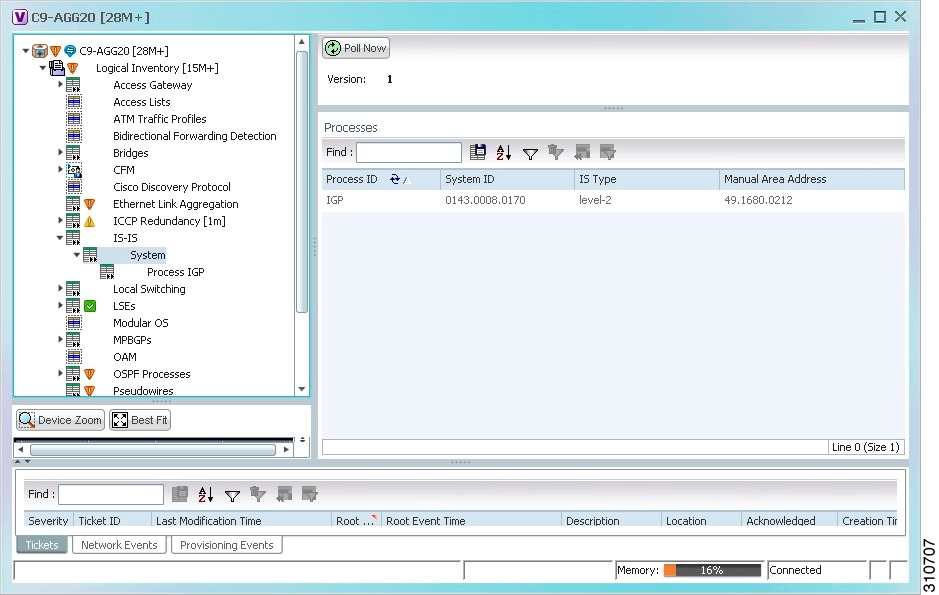
Table 13-47 describes the information that is displayed in this window and the Processes table.
Step 3 ![]() To view IS-IS process information, choose Logical Inventory > IS-IS > Process nnn.
To view IS-IS process information, choose Logical Inventory > IS-IS > Process nnn.
Figure 13-74 shows an example of the information that is displayed for the IS-IS process.
Figure 13-74 IS-IS Process Properties in Logical Inventory
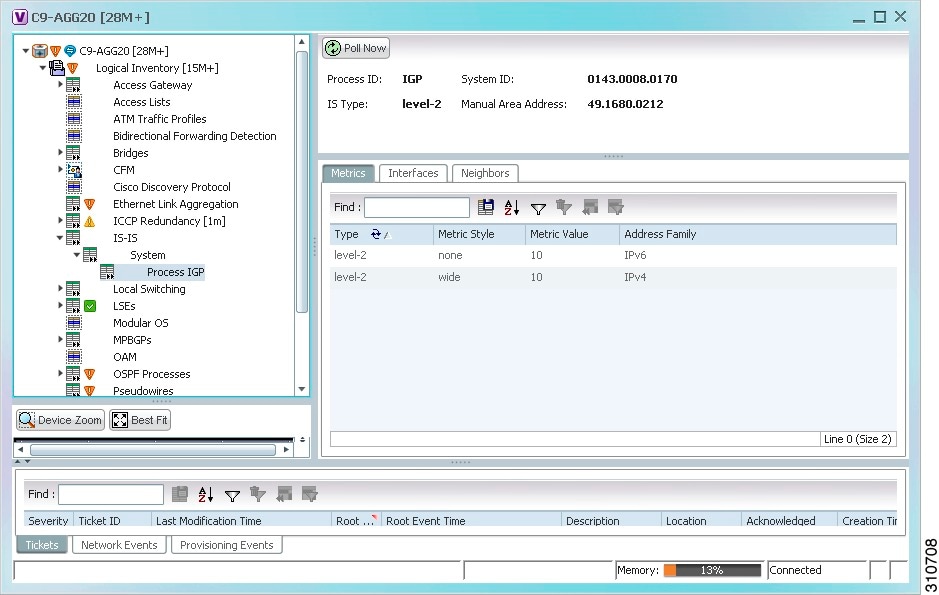
Table 13-48 describes the information that is displayed for the selected IS-IS process.
Viewing OSPF Properties
Prime Network Vision supports the following versions of OSPF:
•![]() OSPFv1
OSPFv1
•![]() OSPFv2
OSPFv2
•![]() OSPFv3
OSPFv3
Using Prime Network Vision you can view OSPF properties for:
•![]() OSPF processes, including the process identifier and OSPF version.
OSPF processes, including the process identifier and OSPF version.
•![]() OSPF network interfaces, such as the area identifier, network type, and status.
OSPF network interfaces, such as the area identifier, network type, and status.
•![]() OSPF neighbors, including the neighbor identifier, neighbor interface address, and status.
OSPF neighbors, including the neighbor identifier, neighbor interface address, and status.
To view OSPF properties:
Step 1 ![]() In Prime Network Vision, double-click the device configured for OSPF.
In Prime Network Vision, double-click the device configured for OSPF.
Step 2 ![]() To view OSPF processes, choose Logical Inventory > OSPF Processes > OSPF Process (vn) ID where vn represents the OSPF version and ID is the OSPF process identifier.
To view OSPF processes, choose Logical Inventory > OSPF Processes > OSPF Process (vn) ID where vn represents the OSPF version and ID is the OSPF process identifier.
For example, in Figure 13-75, the entry in the navigation tree is OSPF Process (v2) 10.
Figure 13-75 OSPF Processes in Logical Inventory
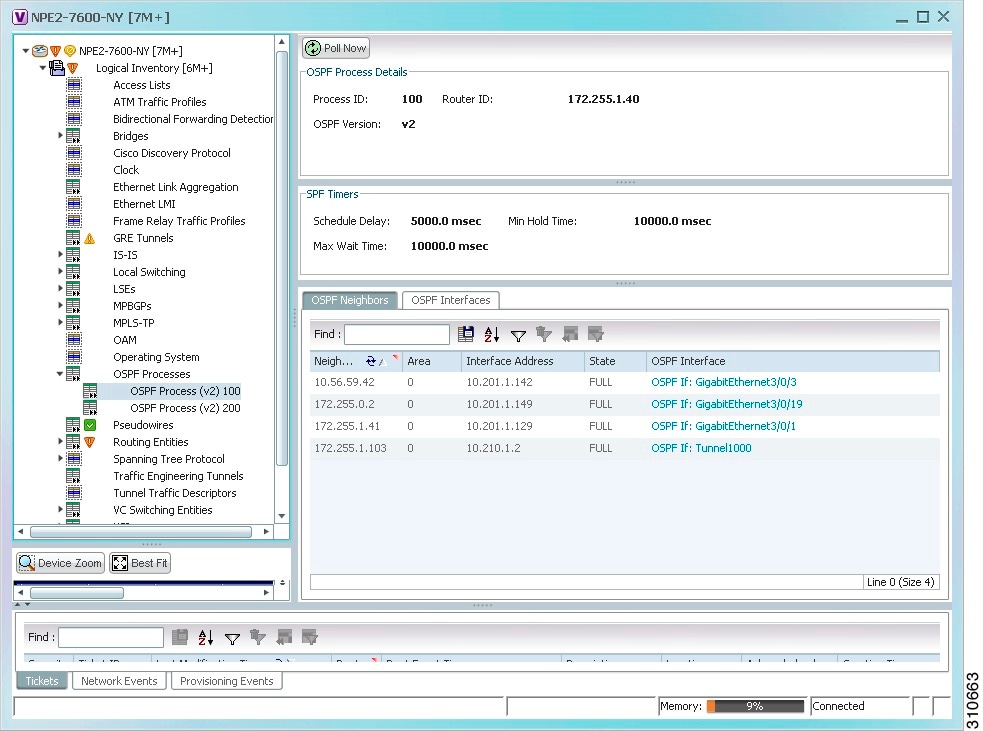
Table 13-49 describes the information that is displayed for OSPF processes.
|
|
|
|---|---|
|
|
|
Process ID |
Unique process identifier. |
Router ID |
Router IP address. |
OSPF Version |
OSPF version: v1, v2, or v3. |
|
|
|
Schedule Delay |
Number of milliseconds to wait after a change before calculating the shortest path first (SPF). |
Min Hold Time |
Minimum number of milliseconds to wait between two consecutive SPF calculations. |
Max Wait Time |
Maximum number of milliseconds to wait between two consecutive SPF calculations. |
|
|
|
Neighbor ID |
OSPF neighbor IP address. |
Area |
OSPF area identifier. |
Interface Address |
IP address of the interface on the neighbor configured for OSPF. |
State |
State of the communication with the neighbor: Down, Attempt, Init, 2-Way, Exstart, Exchange, Loading, and Full. |
OSPF Interface |
Hyperlinked entry to the OSPF Interface Properties window. The OSPF Interfaces window displays the same information as the OSPF Interfaces Table below. |
|
|
|
IP Interface |
OSPF interface, hyperlinked to the relevant entry in the routing entity IP Interfaces table in logical inventory. For more information about the IP Interfaces table, see Table 19-12. |
Internet Address |
OSPF interface IP address. |
Area ID |
OSPF area identifier. |
Priority |
Eight-bit unsigned integer that specifies the priority of the interface. Values range from 0 to 255. Of two routers, the one with the higher priority takes precedence. |
Cost |
Specified cost of sending a packet on the interface, expressed as a metric. Values range from 1 to 65535. |
Status |
State of the interface: Up or Down. |
State |
OSPF state: BDR, DR, DR-Other, Waiting, Point-to-Point, or Point-to-Multipoint. |
Network Type |
Type of OSPF network: Broadcast, Nonbroadcast Multiple Access (NBMA), Point-to-Multipoint, Point-to-Point, or Loopback. |
DR Address |
Designated router IP address. |
BDR Address |
Backup designated router IP address. |
Configuring REP and mLACP
The following commands can be launched from the inventory by right-clicking the appropriate node and selecting Commands. Before executing any commands, you can preview them and view the results. If desired, you can also schedule the commands. For details on the software versions Prime Network supports for these network elements, see the Cisco Prime Network 3.10 Supported Cisco VNEs. To run the REP and mLACP commands, the software on the network element must support these technology.
Note ![]() You might be prompted to enter your device access credentials while executing a command. Once you have entered them, these credentials will be used for every subsequent execution of a command in the same GUI client session. If you want to change the credentials, click Edit Credentials. The Edit Credentials button will not be available for SNMP commands or if the command is scheduled for a later time.
You might be prompted to enter your device access credentials while executing a command. Once you have entered them, these credentials will be used for every subsequent execution of a command in the same GUI client session. If you want to change the credentials, click Edit Credentials. The Edit Credentials button will not be available for SNMP commands or if the command is scheduled for a later time.
Using Pseudowire Ping and Show Commands
The Ping Pseudowire and Display Pseudowire commands can be launched from the inventory by right-clicking the appropriate node and selecting Commands. Before executing any commands, you can preview them and view the results. If desired, you can also schedule the commands.
Note ![]() You might be prompted to enter your device access credentials while executing a command. Once you have entered them, these credentials will be used for every subsequent execution of a command in the same GUI client session. If you want to change the credentials, click Edit Credentials. The Edit Credentials button will not be available for SNMP commands or if the command is scheduled for a later time.
You might be prompted to enter your device access credentials while executing a command. Once you have entered them, these credentials will be used for every subsequent execution of a command in the same GUI client session. If you want to change the credentials, click Edit Credentials. The Edit Credentials button will not be available for SNMP commands or if the command is scheduled for a later time.
Configuring IS-IS
In order to enable IS-IS for IP on a Cisco router and have it exchange routing information with other IS-IS enabled routers, you must perform these two tasks:
•![]() Enable the IS-IS process and assign area
Enable the IS-IS process and assign area
•![]() Enable IS-IS for IP routing on an interface
Enable IS-IS for IP routing on an interface
You can configure the router to act as a Level 1 (intra-area) router, as Level 1-2 (both a Level 1 router and a Level 2 router), or as Level 2 (an inter-area router only).
The IS-IS commands helps you to configure the IS-IS on a Cisco router. These commands can be launched from the logical inventory. Before executing any commands, you can preview them and view the results. If desired, you can also schedule the commands.
The table below lists the IS-IS configuration commands and the ISIS supported network elements.
To run the ISIS commands, the software on the network element must support ISIS technology. For details on the software versions Prime Network supports for the ISIS supported network elements, see the Cisco Prime Network 3.10 Supported Cisco VNEs.
Note ![]() You might be prompted to enter your device access credentials while executing a command. Once you have entered them, these credentials will be used for every subsequent execution of a command in the same GUI client session. If you want to change the credentials, click Edit Credentials. The Edit Credentials button will not be available for SNMP commands or if the command is scheduled for a later time.
You might be prompted to enter your device access credentials while executing a command. Once you have entered them, these credentials will be used for every subsequent execution of a command in the same GUI client session. If you want to change the credentials, click Edit Credentials. The Edit Credentials button will not be available for SNMP commands or if the command is scheduled for a later time.
 Feedback