- Title Page
- Table of Contents
- Preface
- Setting Up Devices and Using the GUI Clients
- Working with the Cisco Prime Network Vision Client
- Viewing and Managing NE Properties
- Device Configurations and Software Images
- Working with Prime Network Vision Maps
- Working with Links
- Labeling NEs Using Business Tags
- Working with the Prime Network Events
- Tracking Faults Using Prime Network Events
- Working with Tickets in Cisco Prime Network Vision
- Working with Reports
- Using Cisco PathTracer to Diagnose Problems
- Monitoring Carrier Ethernet Services
- Monitoring Carrier Grade NAT Properties
- Monitoring DWDM Properties
- Monitoring Ethernet Operations, Administration,and Maintenance Tool Properties
- Monitoring Y.1731 IPSLA Configuration
- IPv6 and IPv6 VPN over MPLS
- Monitoring MPLS Services
- Viewing IP and MPLS Multicast Configurations
- Monitoring MToP Services
- Viewing and Managing SBCs
- Monitoring AAA Configurations
- Monitoring IP Pools
- Monitoring BNG Configurations
- Monitoring Mobile Technologies
- Monitoring Data Center Configurations
- Icon and Button Reference
- Glossary
- Index
Monitoring DWDM Properties
The Cisco IP over dense wavelength division multiplexing (IPoDWDM) solution enables the convergence of the IP and DWDM core networks of the service providers. It increases service flexibility, operational efficiency and reliability while lowering operating expenses (OpEx) and capital expenditures (CapEx).
Cisco Prime Network discovers and displays the following DWDM attributes in the Physical Inventory tree of the Cisco Prime Network Vision:
•![]() DWDM controllers. The controller location is same as the DWDM interface.
DWDM controllers. The controller location is same as the DWDM interface.
•![]() Loopback information for the DWDM controller.
Loopback information for the DWDM controller.
•![]() DWDM controller status.
DWDM controller status.
•![]() DWDM port properties—Wavelength, Laser Status, Tx Power, and Rx Power.
DWDM port properties—Wavelength, Laser Status, Tx Power, and Rx Power.
•![]() DWDM controller card status (G.709 status).
DWDM controller card status (G.709 status).
Prime Network also provides commands that support DWDM and Synchronous Optical Network (SONET) controllers. These commands help in configuring the device and in displaying device details. The commands are described in Configuring and Viewing DWDM. (For information on the SONET commands, see Configuring Clock.)
The following topics describe how you can view and monitor IP over dense wavelength division multiplexing (DWDM) properties configured on network elements by using Cisco Prime Network Vision (Prime Network Vision):
•![]() User Roles Required to View DWDM Properties
User Roles Required to View DWDM Properties
•![]() Viewing DWDM in Physical Inventory
Viewing DWDM in Physical Inventory
•![]() Viewing Performance Monitoring Configuration
Viewing Performance Monitoring Configuration
User Roles Required to View DWDM Properties
This topic identifies the roles that are required to view DWDM properties using Prime Network Vision. Prime Network determines whether you are authorized to perform a task as follows:
•![]() For GUI-based tasks (tasks that do not affect elements), authorization is based on the default permission that is assigned to your user account.
For GUI-based tasks (tasks that do not affect elements), authorization is based on the default permission that is assigned to your user account.
•![]() For element-based tasks (tasks that do affect elements), authorization is based on the default permission that is assigned to your account. That is, whether the element is in one of your assigned scopes and whether you meet the minimum security level for that scope.
For element-based tasks (tasks that do affect elements), authorization is based on the default permission that is assigned to your account. That is, whether the element is in one of your assigned scopes and whether you meet the minimum security level for that scope.
For more information on user authorization, see the Cisco Prime Network 3.10 Administrator Guide.
The following tables identify the tasks that you can perform:
•![]() Table 15-1 identifies the tasks that you can perform if a selected element is not in one of your assigned scopes.
Table 15-1 identifies the tasks that you can perform if a selected element is not in one of your assigned scopes.
•![]() Table 15-2 identifies the tasks that you can perform if a selected element is in one of your assigned scopes.
Table 15-2 identifies the tasks that you can perform if a selected element is in one of your assigned scopes.
By default, users with the Administrator role have access to all managed elements. To change the Administrator user scope, see the topic on device scopes in the Cisco Prime Network 3.10 Administrator Guide.
Viewing DWDM in Physical Inventory
Prime Network Vision enables you to monitor a variety of DWDM properties in physical inventory, including forward error correction (FEC), G.709 status, and performance monitoring parameters.
To view DWDM properties in physical inventory:
Step 1 ![]() In a Prime Network Vision map, double-click the device on which DWDM is configured.
In a Prime Network Vision map, double-click the device on which DWDM is configured.
Step 2 ![]() In the inventory window, choose Physical Inventory > Chassis and navigate to the interface configured for DWDM. DWDM details are displayed in the DWDM area in the content pane as shown in Figure 15-1.
In the inventory window, choose Physical Inventory > Chassis and navigate to the interface configured for DWDM. DWDM details are displayed in the DWDM area in the content pane as shown in Figure 15-1.
Figure 15-1 DWDM Properties in Physical Inventory
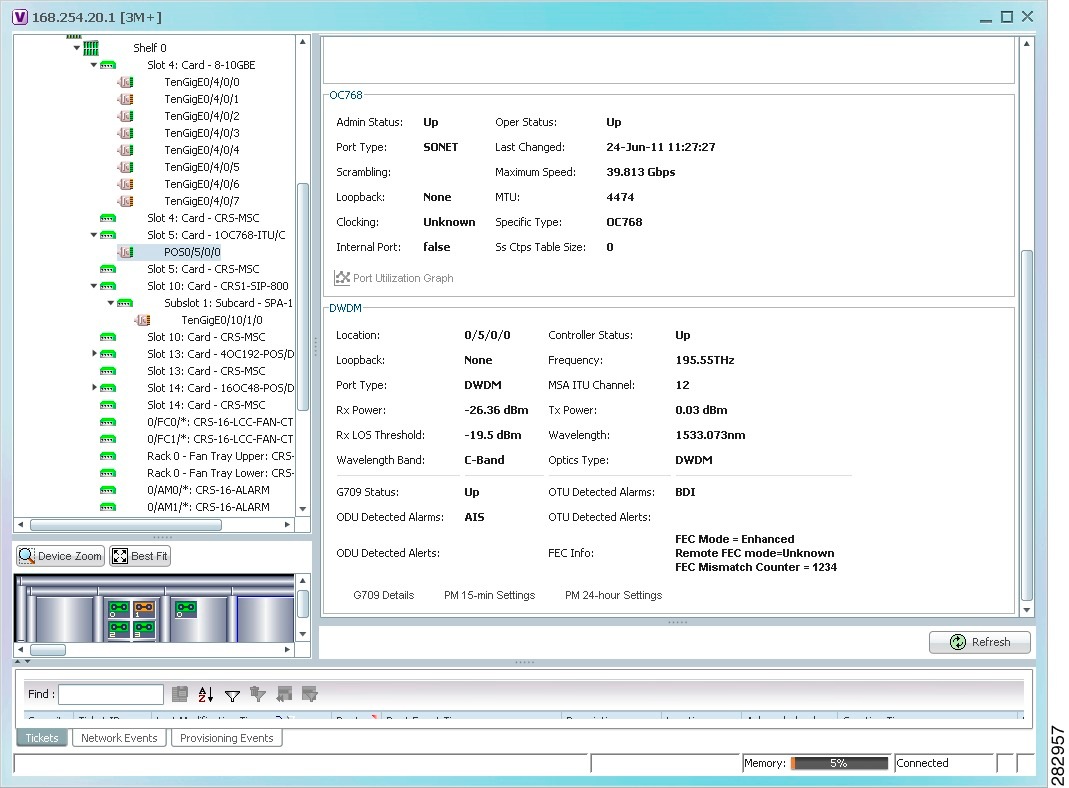
Table 15-3 describes the information displayed for DWDM.
|
|
|
|---|---|
Location |
Physical interface using the format rack/slot/module/port where: • • • • |
Controller Status |
Status of the controller: Up or Down. |
Loopback |
Whether or not the DWDM controller is configured for loopback mode. |
Frequency |
Frequency of the channel in terahertz. |
Port Type |
The port type. In this case, DWDM. |
MSA ITU Channel |
Multi Source Agreement (MSA) ITU channel number. |
Rx Power |
Actual optical power at the receiving port. |
Tx Power |
Value of the transmit power level. |
Rx LOS Threshold |
Number of optical channel transport unit (OTU) loss of signal (LOS) alarms. If the receive optical power is less than or equal to this defined threshold, the optical LOS alarm is raised. |
Wavelength |
Wavelength corresponding to the channel number in nanometers. |
Wavelength Band |
Indicates the wavelength band: C-band or L-band. |
Optics Type |
Indicates the optics type: GE or DWDM. |
|
|
|
G709 Status |
Whether the G.709 wrapper is enabled or disabled: Up or Down. |
OTU Detected Alarms |
OTU overhead alarms. |
ODU Detected Alarms |
Optical channel data unit (ODU) alarms. |
OTU Detected Alerts |
OTU alerts. |
ODU Detected Alerts |
ODU alerts. |
FEC Info |
Indicates the: • • • |
G709 Details |
Click to view G709 properties. For more information, see Viewing G.709 Properties. |
PM 15-min Settings |
Click to view 15-minute performance monitoring properties. For more information, see Viewing Performance Monitoring Configuration. |
PM 24-hour Settings |
Click to view 24-hour performance monitoring properties. For more information, see Viewing Performance Monitoring Configuration. |
Viewing G.709 Properties
The Telecommunication Standardization Sector (ITU-T) Recommendation G.709 provides a standardized method for transparently transporting services over optical wavelengths end to end. A significant component of G.709 is the FEC code that improves performance and extends the distance that optical signals can span.
To view G.709 properties:
Step 1 ![]() In Prime Network Vision, double-click the device on which DWDM is configured.
In Prime Network Vision, double-click the device on which DWDM is configured.
Step 2 ![]() In the inventory window, choose Physical Inventory > Chassis and navigate to the interface configured for DWDM.
In the inventory window, choose Physical Inventory > Chassis and navigate to the interface configured for DWDM.
Step 3 ![]() In the content pane, click G709 Details.
In the content pane, click G709 Details.
The G709 Info Properties window is displayed as shown in Figure 15-2 for all Cisco devices except the Cisco 7600 series devices.
Figure 15-2 DWDM G709 Properties Window
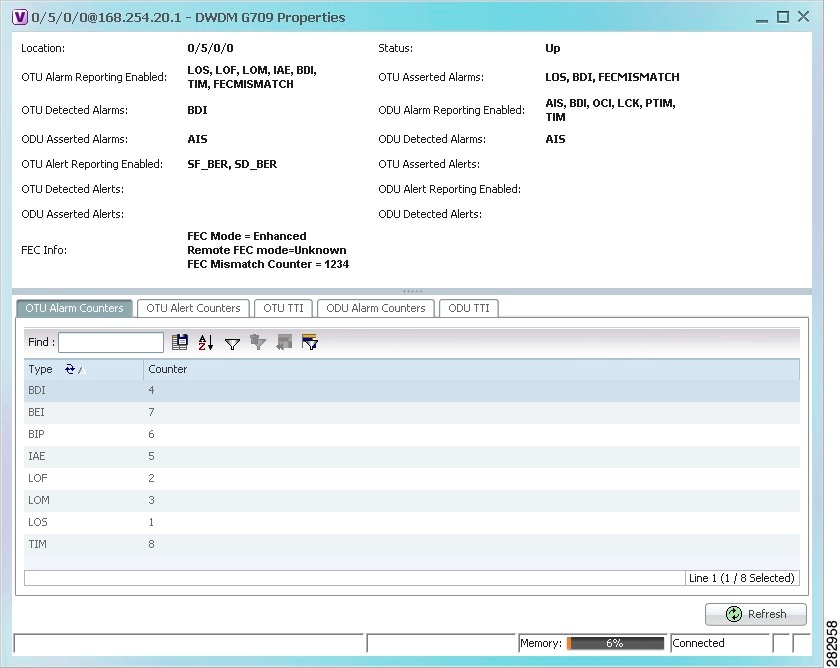
Figure 15-3 shows the tabs that are displayed in the G709 Info Properties window for Cisco 7600 series devices. For Cisco 7600 series devices:
•![]() The ODU Alert Counters tab is displayed.
The ODU Alert Counters tab is displayed.
•![]() The ODU TTI and OTU TTI tabs are not displayed.
The ODU TTI and OTU TTI tabs are not displayed.
Figure 15-3 DWDM G709 Properties Window for Cisco 7600 Series Devices
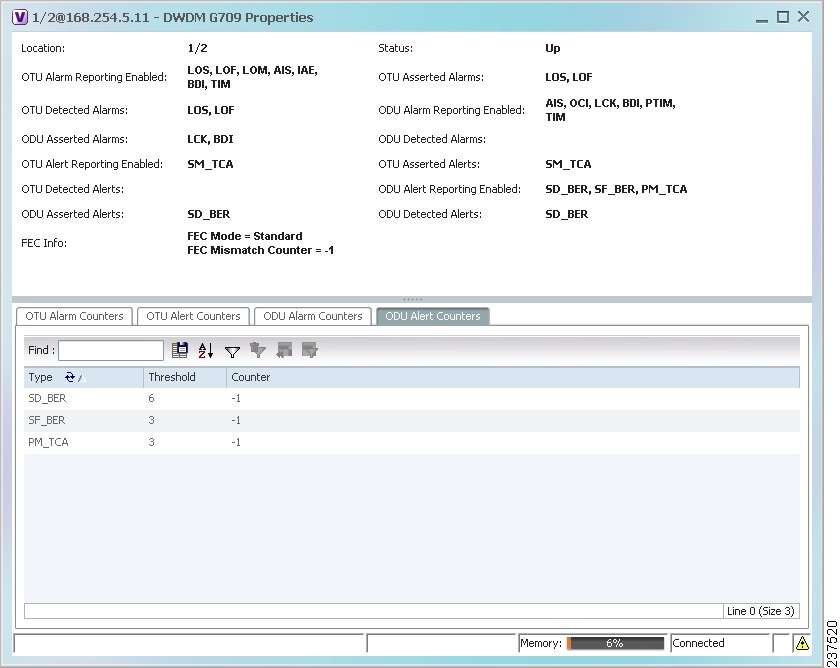
Table 15-4 describes the fields that are displayed above the tabs in the G709 Info Properties window.
The G709 Info Properties window contains the following tabs, depending on the selected network element:
Step 4 ![]() To view additional G.709 properties, click the required tab. Table 15-5 describes the information displayed in each tab.
To view additional G.709 properties, click the required tab. Table 15-5 describes the information displayed in each tab.
Step 5 ![]() To close the G709 Info Properties window, click the upper right corner.
To close the G709 Info Properties window, click the upper right corner.
Viewing Performance Monitoring Configuration
Performance monitoring parameters are used to gather, store, set thresholds for, and report performance data for early detection of problems. Thresholds are used to set error levels for each performance monitoring parameter. During the accumulation cycle, if the current value of a performance monitoring parameter reaches or exceeds its corresponding threshold value, a threshold crossing alert (TCA) can be generated. The TCAs provide early detection of performance degradation.
Prime Network Vision enables you to view the configuration settings for performance monitoring. Performance monitoring statistics are accumulated on a 15-minute basis, synchronized to the start of each quarter-hour. They are also accumulated on a daily basis starting at midnight. Historical counts are maintained for thirty-three 15-minute intervals and two daily intervals.
To view performance monitoring configuration settings:
Step 1 ![]() In Prime Network Vision, double-click the device on which DWDM is configured.
In Prime Network Vision, double-click the device on which DWDM is configured.
Step 2 ![]() In the inventory window, choose Physical Inventory > Chassis and navigate to the interface configured for DWDM.
In the inventory window, choose Physical Inventory > Chassis and navigate to the interface configured for DWDM.
Step 3 ![]() In the content pane, select the performance monitoring configuration settings you want to view:
In the content pane, select the performance monitoring configuration settings you want to view:
•![]() To view the performance monitoring 15-minute configuration settings, click PM 15-min Settings.
To view the performance monitoring 15-minute configuration settings, click PM 15-min Settings.
•![]() To view the performance monitoring 24-hour configuration settings, click PM 24-hour Settings.
To view the performance monitoring 24-hour configuration settings, click PM 24-hour Settings.
The Client DWDM PM Settings Properties window is displayed as shown in Figure 15-4.
Figure 15-4 Client DWDM PM Settings Properties Window
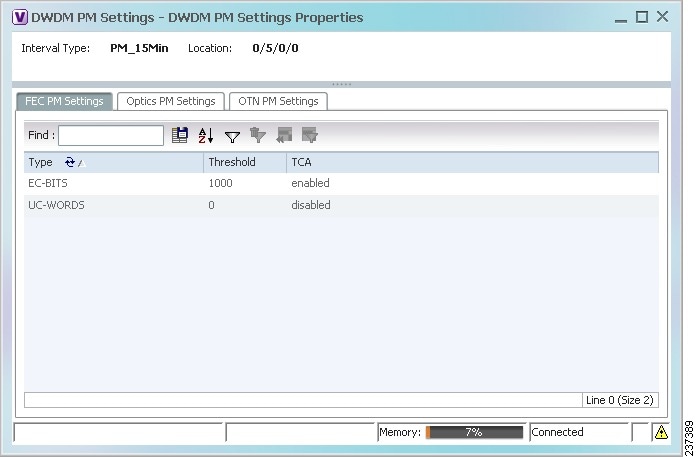
Table 15-6 describes the information displayed above the tabs in the Client DWDM PM Settings Properties window and in each of the tabs.
Configuring and Viewing DWDM
The following commands can be launched from the inventory by right-clicking the appropriate node and selecting Commands. Before executing any commands, you can preview them and view the results. If desired, you can also schedule the commands.
The table below lists the configuration commands and the supported network elements. Before executing any commands, you can preview them and view the results. If desired, you can also schedule the commands.
For details on the software versions Prime Network supports for thes supported network elements, see the Cisco Prime Network 3.10 Supported Cisco VNEs. To run the Carrier Grade NAT commands, the software on the network element must support the Carrier Grade NAT technology.
To find out if a device supports these commands, see the Cisco Prime Network 3.10 Supported Cisco VNEs.

Note ![]() You might be prompted to enter your device access credentials while executing a command. Once you have entered them, these credentials will be used for every subsequent execution of a command in the same GUI client session. If you want to change the credentials, click Edit Credentials. The Edit Credentials button will not be available for SNMP commands or if the command is scheduled for a later time.
You might be prompted to enter your device access credentials while executing a command. Once you have entered them, these credentials will be used for every subsequent execution of a command in the same GUI client session. If you want to change the credentials, click Edit Credentials. The Edit Credentials button will not be available for SNMP commands or if the command is scheduled for a later time.
|
|
|
|
|
|---|---|---|---|
Controller Data |
Show > |
N/A; performed from command launch point |
• • • • |
PM History Data |
PM interval type: 15-min or 24-hour |
||
Interval number |
|||
RTPM Counters |
PM interval type: 15-min or 24-hour |
||
RTPM Threshold |
PM interval type: 15-min or 24-hour |
||
Wavelength Map |
N/A; performed from command launch point |
||
IM Trace Details |
Card location (for example, 0/5/CPU0) |
||
Device Log |
N/A; performed from command launch point |
||
Counters |
Clear > |
N/A; performed from command launch point |
|
Channel |
Configure > |
Channel number |
|
Option: Set or reset channel |
|||
FEC Mode |
G.709 FEC mode: Disabled, enhanced, or standard |
||
G.709 ODU |
ODU alarm type: ais, bdi, lck, oci, ptim, or tim |
||
Option: Enable or disable alarm type |
|||
G.709 OTU |
OTU alarm type: bdi, fecmismatch, iae, lof, lom, los, sd-ber, sf-ber, or tim |
||
Option: Enable or disable alarm type |
|||
G.709 TTI |
Configure > |
Optical channel unit type: ODU or OTU |
• • • • |
TTI type: Expected or sent |
|||
TTI string type: ASCII or hex |
|||
TTI string |
|||
Option: Set or reset TTI string |
|||
G.709 Wrapper |
Option: Disable or enable G.709 wrapper |
||
Laser State |
Laser state: Switch off or on |
||
Loopback |
Loopback value: Internal or line |
||
Option: Set or remove |
|||
PM FEC Data |
PM interval type |
||
FEC alarm type: • • |
|||
TCA options: Enable or disable TCA generation |
|||
Threshold option. Set configures the value on the device; reset is the default. If you select blank, the threshold value is not used. |
|||
Threshold value |
|||
PM Optics Data |
Configure > |
PM interval: 15-min or 24-hour |
• • • • |
Optics alarm type: • • • |
|||
Maximum TCA option: Enable or disable |
|||
Maximum threshold option: Choosing Set configures the value on the device; Reset is the default. If you select blank, the threshold value is not used. |
|||
Maximum threshold |
|||
Minimum TCA option: enable or disable |
|||
Minimum threshold option: Choosing Set configures the value on the device; Reset is the default. If you select blank, the threshold value is not used. |
|||
Minimum threshold |
|||
PM OTN Data |
PM interval: 15-min or 24-hour |
||
OTN alarm type. For a list of types and their descriptions, see the OTN PN Settings Tab information in Table 15-6. |
|||
TCA option: Enable or disable |
|||
Threshold option: Choosing Set configures the value on the device; Reset is the default. If you select blank, the threshold value is not used. |
|||
Threshold value |
|||
Transmit Power |
Transmit power in dBm |
||
Option: Set or reset transponder Tx threshold |
|||
Rx LOS Threshold |
Rx LOS threshold value |
||
Option: Set or reset transponder Rx threshold |
 Feedback