Modular QoS Configuration Guide for Cisco 8000 Series Routers, Cisco IOS XR Release

PDF

Modular QoS Configuration Guide for Cisco 8000 Series Routers, Cisco IOS XR Release

Traffic class queue pause duration

Want to summarize with AI?

Log in

A PFC congestion monitoring functionality that monitors both transmit (Tx) and receive (Rx) pause durations in microseconds.


A traffic class queue pause duration is a Priority Flow Control (PFC) congestion monitoring functionality that

  • reports how long per-traffic-class queues remain paused, presented as the percent of time and the absolute duration (in microseconds), for both transmitting (Tx) and receiving (Rx) paths

  • correlates pause activity across adjacent devices (Tx on the receiver versus Rx on the transmitter) to distinguish short-lived bursts from sustained congestion, and

  • supports multi-window sampling, such as one minute and five minutes, and offers per-interface granularity to facilitate troubleshooting and buffer PFC threshold tuning.

Table 1. Feature History Table

Feature Name

Release Information

Feature Description

View Traffic Class Queue Pause Duration

Release 25.4.1

Introduced in this release on: Fixed Systems (8010 [ASIC: A100])(select variants only*)

*This feature is supported on:

  • 8011-32Y8L2H2FH

  • 8011-12G12X4Y-A/D

Enhanced PFC pause duration monitoring Release 25.2.1

Introduced in this release on: Modular Systems (8800 [LC ASIC: Q200])

This feature improves network congestion analysis by providing granular visibility into Priority Flow Control (PFC) pause durations.

It introduces the ability to monitor both transmit (Tx) and receive (Rx) pause durations in microseconds, allowing for precise identification of congestion patterns.

Previously, only pause percentages were available, but this enhancement provides a more detailed and accurate understanding of PFC pause events.

The feature introduces these changes:

CLI:

YANG data models

View Traffic Class Queue Pause Duration

Release 25.1.1

Introduced in this release on: Fixed Systems (8010 [ASIC: A100], 8700 [ASIC:K100])(select variants only*)

*This feature is supported on:

  • 8011-4G24Y4H-I

  • 8712-MOD-M

View Traffic Class Queue Pause Duration

Release 24.4.1

Introduced in this release on: Fixed Systems (8200 [ASIC: P100], 8700 [ASIC: P100])(select variants only*); Modular Systems (8800 [LC ASIC: P100])(select variants only*)

*This feature is supported on:

  • 8711-32FH-M

  • 8212-48FH-M

  • 88-LC1-36EH

  • 88-LC1-12TH24FH-E

  • 88-LC1-52Y8H-EM

View Traffic Class Queue Pause Duration

Release 24.2.11

Introduced in this release on Cisco 8000 Series Routers with Cisco Silicon One Q200 network processors that support the PFC buffer-extended mode function.

For traffic flows between routers, you can view the pause duration of output and input queues in the transmitting and receiving routers, respectively.

The pause duration values of the impacted traffic class queues are displayed for regular intervals within a specified time duration.

With the information, you can view the extent of congestion on PFC-enabled interfaces over a period of time and identify whether traffic congestion is due to small bursts of traffic or other causes.

The feature introduces these changes:

CLI:

YANG data models:

  • Cisco-IOS-XR-platforms-ofa-oper (see GitHub, YANG Data Models Navigator


How traffic class queue pause duration works

In PFC-enabled networks, routers exchange PAUSE and NO-PAUSE (X-on) frames to manage congestion without packet drops. When queue occupancy crosses the configured pause-threshold, the receiver issues PAUSE frames upstream. When congestion clears, it sends X-on frames.

The router records how long each queue remains paused during each sampling window and reports this as a pause percentage or pause duration.

Summary

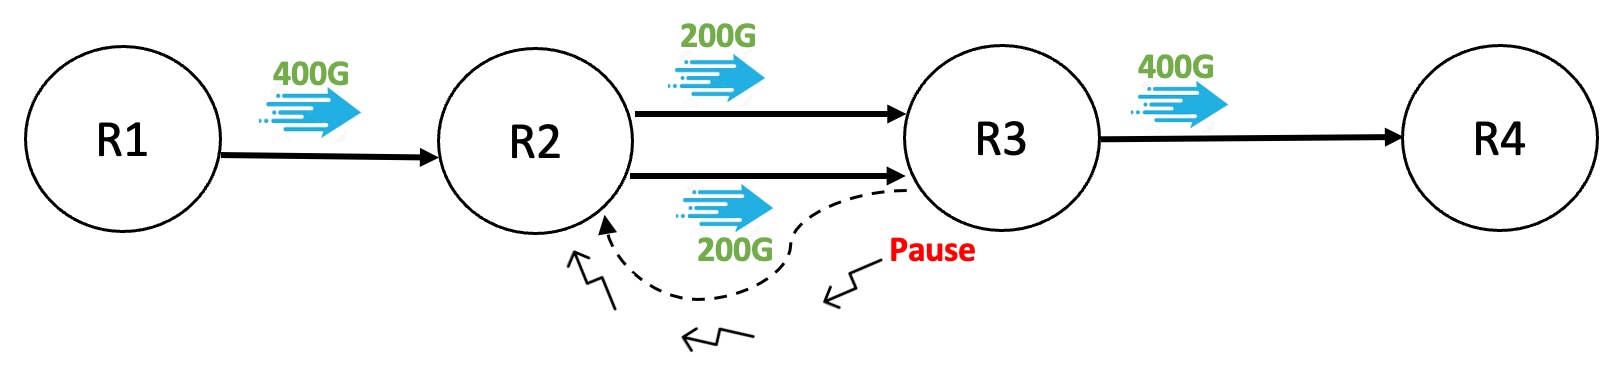
This summary refers to the figure to clarify the workflow.

  • Transmitting router (R2): Sends traffic and pauses output queues when PAUSE frames are received.

  • Receiving router (R3): Detects congestion, issues PAUSE or X-on frames, and measures pause duration.

  • Upstream router (R1): Feeds traffic into R2 and can receive propagated PAUSE frames.

  • Downstream router (R4): Receives traffic forwarded from R3.

These components work together to regulate traffic flow and record how long queues remain paused.

Workflow

Figure 1. Traffic class queue pause duration scenario

These stages describe how traffic class queue pause duration works.

  1. R1 transmits: R1 sends packets to R2 at a line rate of 400 Gbps.
  2. R2 transmits normally: R2 forwards 400 G of traffic toward R3 across two 200 G PFC-enabled ECMP links
  3. R3 queues begin to fill: R3 forwards 399 G to R4 and buffers the remaining 1 G in input queues. Mild congestion starts but remains below the pause-threshold.
  4. R3 crosses the pause-threshold: R3 detects the threshold breach and sends PFC PAUSE frames to R2.R2 halts transmission and buffers packets in High Bandwidth Memory (HBM).
  5. Pause propagates upstream: R2 sends PAUSE frames further upstream to R1.Traffic slows from R1 to R2 to R3 and queues stabilize.
  6. R3 drains queues and resumes: As congestion clears, R3 sends X-on frames to R2.Transmission resumes at line rate.
  7. R2 releases backlog: R2 transmits its buffered packets at full 400 G, causing a brief traffic burst.R3’s queues refill temporarily, triggering another PAUSE.
  8. Pause cycles repeat: R2 and R3 alternate between PAUSE and X-on states.For example, both routers record approximately 50 percent pause-percentage, which indicates short, periodic congestion.
  9. Administrator monitors pause duration: Run show controllers npu packet-memory interface <interface> to display pause statistics for each traffic class and interval. High pause percentages (greater than or equal to 70 percent) suggest sustained congestion; lower values indicate normal operation.

Result

This process quantifies queue pause behavior in terms of time percentages or durations. This helps you distinguish transient bursts from persistent congestion and tune thresholds.


Best practices for using traffic class queue pause duration

Use these guidelines to interpret and validate traffic class queue pause-duration data accurately.

  • Select sampling intervals appropriately:

    Select a short observation window (30 seconds to 1 minute) to detect micro-bursts or transient queue spikes.

    Select a longer observation window (5 minutes) to capture congestion trends and recurring pause patterns over time.

  • Avoid over-sampling in detail option: Avoid using the detail option in automation scripts or telemetry integrations, as it generates a large volume of records

  • Verify Priority Flow Control (PFC) configuration: Ensure that PFC buffer-extended mode is enabled on the transmitting and receiving router nodes.

  • PFC mode support for viewing pause duration in microseconds: Use buffer-internal or buffer-extended mode to view pause duration in microseconds.


View traffic class queue pause duration

Use the show controllers npu packet-memory interface command to view pause statistics per interface and traffic class to determine how long queues were paused, as a percentage or in microseconds, for selected intervals.

Before you begin

Enable PFC buffer-extended mode on the transmitting and receiving router nodes.

Follow these steps to view queue pause duration on a PFC-enabled router.

Procedure

1.

Select Tx or Rx view.

  • rx-pause-percent —Specifies the input queues on the receiving router.

  • tx-pause-percent –Specifies the output queues on the transmitting router.

2.

(Optional) Choose observation window or detail level.

  • one-minute –Specifies the average pause duration of the queues in percentage for the last minute.

  • five-minute –Specifies the average pause duration of the queues in percentage for the last five minutes.

  • detail –Displays a maximum of 120 records at a frequency of one record per 250-millisecond interval.

  • Default—30 records are displayed for each traffic class at a frequency of one record per second.

  • verbose —View the time stamp in a raw mode.

3.

Run the show command.

Router#show controllers npu packet-memory interface <intf> tx-pause-percent <observation window in time or detail> location <node>

OR

Router#show controllers npu packet-memory interface <intf> rx-pause-percent <observation window in time or detail> location <node>
  • one-minute –Specifies the average pause duration of the queues in percentage for the last minute.

  • five-minute –Specifies the average pause duration of the queues in percentage for the last five minutes.

  • detail –Displays a maximum of 120 records at a frequency of one record per 250-millisecond interval.

  • Default—30 records are displayed for each traffic class at a frequency of one record per second.

  • verbose —View the time stamp in a raw mode.

  • View the average pause duration for input queues for a specific observation window.
    Router#show controllers npu packet-memory interface all tx-pause-percent one-minute location 0/6/CPU0 
    
    -------------------------------------------------------------------------
    Node ID: 0/6/CPU0
    Source Queue Pause Percentage Info for interface(s) all
    Intf               TC          Pause-Percentage 
    name                                            
    -------------------------------------------------------------------------
      FH0/6/0/10       2           0.00000 
      FH0/6/0/11       2           0.00000 
      FH0/6/0/13       2           0.00000 
      FH0/6/0/14       2           0.00000 
      FH0/6/0/15       2           0.00000 
      FH0/6/0/16       2           0.00000 
      FH0/6/0/18       2           0.00000 
      FH0/6/0/21       2          53.01604 
      FH0/6/0/22       2           0.00000 
      FH0/6/0/23       2          53.13991
  • View the average pause duration of output queues for a specific observation window.
    show controllers npu packet-memory interface all rx-pause-percent one-minute location 0/6/CPU0 
    -------------------------------------------------------------------------
    Node ID: 0/6/CPU0
    Out Queue Pause Percentage Info for interface(s) all
    Intf               TC          Pause-Percentage 
    name                                            
    -------------------------------------------------------------------------
      FH0/6/0/10       2           0.00000 
      FH0/6/0/11       2           0.00000 
      FH0/6/0/13       2           0.00000 
      FH0/6/0/14       2           0.00000 
      FH0/6/0/15       2           0.00000 
      FH0/6/0/16       2           0.00000 
      FH0/6/0/18       2           0.00000 
      FH0/6/0/21       2          53.01604 
      FH0/6/0/22       2           0.00000 
      FH0/6/0/23       2          53.13991 
    
  • View pause duration for Tx pause frames in microseconds.
    Router#show controllers npu packet-memory interface all tx-pause-duration location 0/2/CPU0 
    
    -------------------------------------------------------------------------
    Node ID: 0/2/CPU0
    Out Queue Pause Duration Info for interface(s) all
    
    Intf               TC          Pause-Duration 
    name                                            
    -------------------------------------------------------------------------
       FH0/2/0/0       3                 0 
       FH0/2/0/0       4                 0 
      FH0/2/0/35       3                 0 
      FH0/2/0/35       4                 0 
      FH0/2/0/34       3                 0 
      FH0/2/0/34       4                 0 
      FH0/2/0/33       3                 0 
      FH0/2/0/33       4                 0 
      FH0/2/0/31       3       33282645110 
      FH0/2/0/31       4       31821853078 
      FH0/2/0/30       3       33304272074 
      FH0/2/0/30       4       31835301237 
      FH0/2/0/29       3                 0 
      FH0/2/0/29       4                 0 
      FH0/2/0/28       3       33227075106 
      FH0/2/0/28       4       31802440395 
      FH0/2/0/27       3       33241333365 
      FH0/2/0/27       4       31740514268 
      FH0/2/0/26       3       33256748403 
      FH0/2/0/26       4       32711889077 
      FH0/2/0/25       3       33344738029 
      FH0/2/0/25       4       31827152759 
      FH0/2/0/24       3       33407963260 
      FH0/2/0/24       4       32542402762 
       FH0/2/0/1       3                 0 
       FH0/2/0/1       4                 0 
       FH0/2/0/2       3                 0 
       FH0/2/0/2       4                 0 
       FH0/2/0/3       3                 0 
       FH0/2/0/3       4                 0 
       FH0/2/0/4       3                 0 
       FH0/2/0/4       4                 0 
       FH0/2/0/5       3                 0 
       FH0/2/0/5       4                 0 
       FH0/2/0/6       3                 0 
       FH0/2/0/6       4                 0 
       FH0/2/0/7       3                 0 
       FH0/2/0/7       4                 0 
       FH0/2/0/8       3                 0 
       FH0/2/0/8       4                 0 
       FH0/2/0/9       3                 0 
       FH0/2/0/9       4                 0 
      FH0/2/0/10       3                 0 
      FH0/2/0/10       4                 0 
      FH0/2/0/11       3                 0 
      FH0/2/0/11       4                 0
  • View pause duration for Rx pause frames in microseconds.
    Router#show controllers npu packet-memory interface all rx-pause-duration location 0/2/CPU0 
    Fri Feb  7 05:02:28.551 UTC
    
    -------------------------------------------------------------------------
    Node ID: 0/2/CPU0
    Source Queue Pause Duration Info for interface(s) all
    
    Intf               TC          Pause-Duration 
    name                                            
    -------------------------------------------------------------------------
       FH0/2/0/0       3          66113289 
       FH0/2/0/0       4       20373867793 
      FH0/2/0/35       3                 0 
      FH0/2/0/35       4                 0 
      FH0/2/0/34       3                 0 
      FH0/2/0/34       4                 0 
      FH0/2/0/33       3                 0 
      FH0/2/0/33       4                 0 
      FH0/2/0/31       3                 0 
      FH0/2/0/31       4                 0 
      FH0/2/0/30       3                 0 
      FH0/2/0/30       4                 0 
      FH0/2/0/29       3                 0 
      FH0/2/0/29       4                 0 
      FH0/2/0/28       3                 0 
      FH0/2/0/28       4                 0 
      FH0/2/0/27       3                 0 
      FH0/2/0/27       4                 0 
      FH0/2/0/26       3                 0 
      FH0/2/0/26       4                 0 
      FH0/2/0/25       3                 0 
      FH0/2/0/25       4                 0 
      FH0/2/0/24       3                 0 
      FH0/2/0/24       4                 0 
       FH0/2/0/1       3          34701848 
       FH0/2/0/1       4       19824055492 
       FH0/2/0/2       3           5594691 
       FH0/2/0/2       4       19013361290 
       FH0/2/0/3       3          19015180 
       FH0/2/0/3       4       19924428067 
       FH0/2/0/4       3          27727815 
       FH0/2/0/4       4       19841945429 
       FH0/2/0/5       3                 0 
       FH0/2/0/5       4                 0 
       FH0/2/0/6       3          29833476 
       FH0/2/0/6       4       19835847699 
       FH0/2/0/7       3          29578038 
       FH0/2/0/7       4       19837595706 
       FH0/2/0/8       3                 0 
       FH0/2/0/8       4                 0 
       FH0/2/0/9       3                 0 
       FH0/2/0/9       4                 0 
      FH0/2/0/10       3                 0 
      FH0/2/0/10       4                 0 
      FH0/2/0/11       3                 0 
      FH0/2/0/11       4                 0