Monitor system and application health
The health of the Crosswork Platform system and applications is determined by the operational status of its microservices.
-
The system is considered healthy if all services are up and running.
-
The health is considered degraded if one or more services are down.
-
The health status is down if all services are down.
Monitoring System and Application Health in Crosswork Platform
The Crosswork Platform is built on an architecture consisting of microservices. These microservices, create dependencies across various services within the Crosswork system.
To monitor system and application health, from the main menu, choose Crosswork Manager to access the Crosswork Summary and Crosswork Health windows. Each window provides different views to help you monitor system and application health. You can use the tools and information provided in this window, along with support and guidance from your Cisco Customer Experience account team. Also, you can use the tools to identify, diagnose, and fix issues with the Cisco Crosswork cluster, Platform Infrastructure, and installed applications.
While both windows can give you access to the same type of information, the purpose of each summary and view is different.
Monitor cluster health
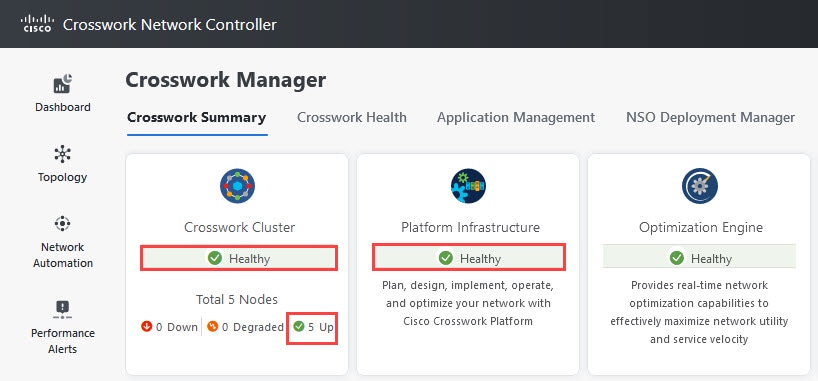
The Monitor Cluster Health feature provides a summary of the overall system health, focusing on hardware resources and virtual machines (VMs).
-
Displays system health at a glance in the Crosswork Summary window.
-
Allows users to check hardware resource status and VM performance before installing or upgrading applications.
-
Enables users to view resource utilization, drill down on VMs, and perform VM or cluster-related activities.
Accessing and Using Cluster Health Information
The Crosswork Summary window, accessible via , provides a summary of system health. Users can click the System Summary tile to view resource utilization and manage VMs or cluster-related activities. If hardware resources are overutilized or services are degrading, users may need to add more VMs to scale the system. Additional details, such as microservices and alarms, can be accessed by clicking on the Cisco Crosswork Platform Infrastructure and application tiles.
For more information, see Cluster management overview.
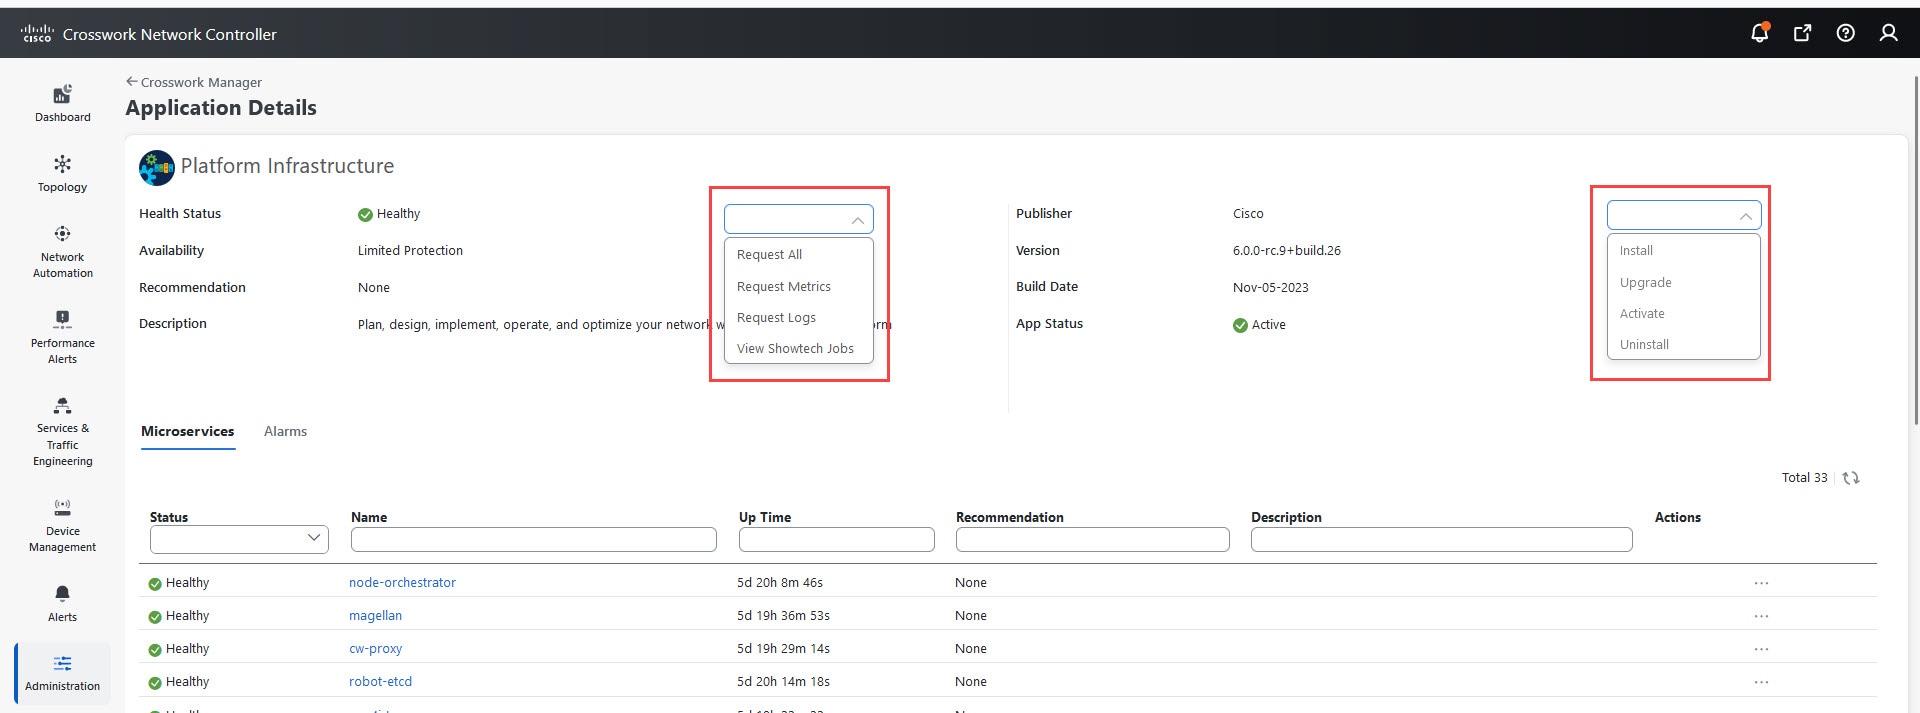
Monitor platform infrastructure and application health
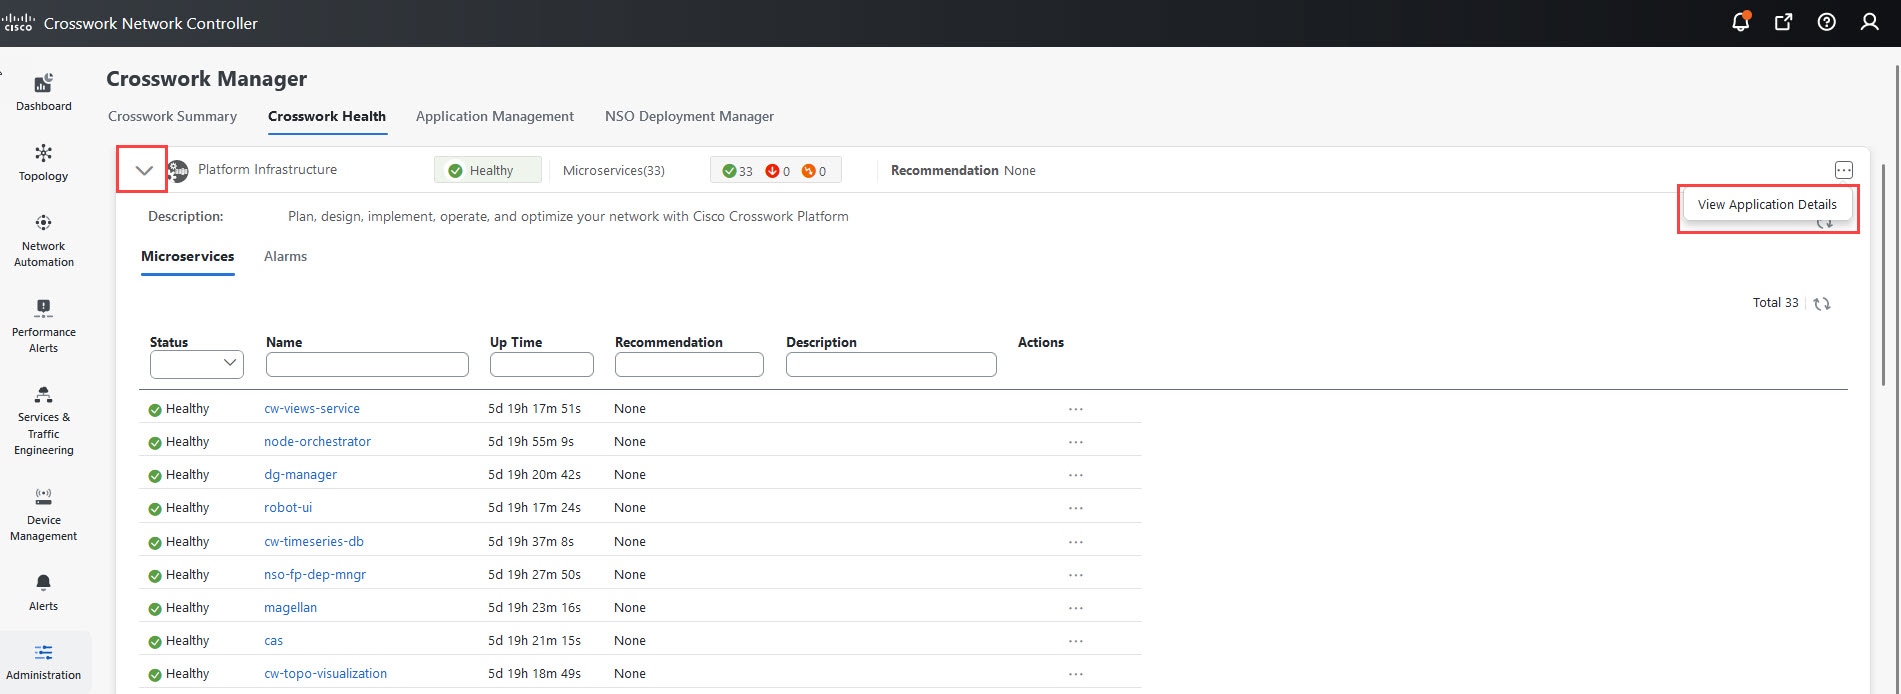
The Crosswork health window ( tab) displays summaries for the Crosswork platform infrastructure health and installed applications status, with details of microservice status.
Within the Crosswork health tab, you can perform these actions:
-
Click the
 icon on the application row to view application details.
-
Expand an application row to view information on microservices, alarms, and events for the selected Crosswork product.
From the Microservices tab, you can:
-
View the list of microservices and, if applicable, associated microservices by clicking on the microservice name.
-
Click
to restart or obtain Showtech data and logs for each microservice.

Note
Showtech logs must be collected separately for each application.
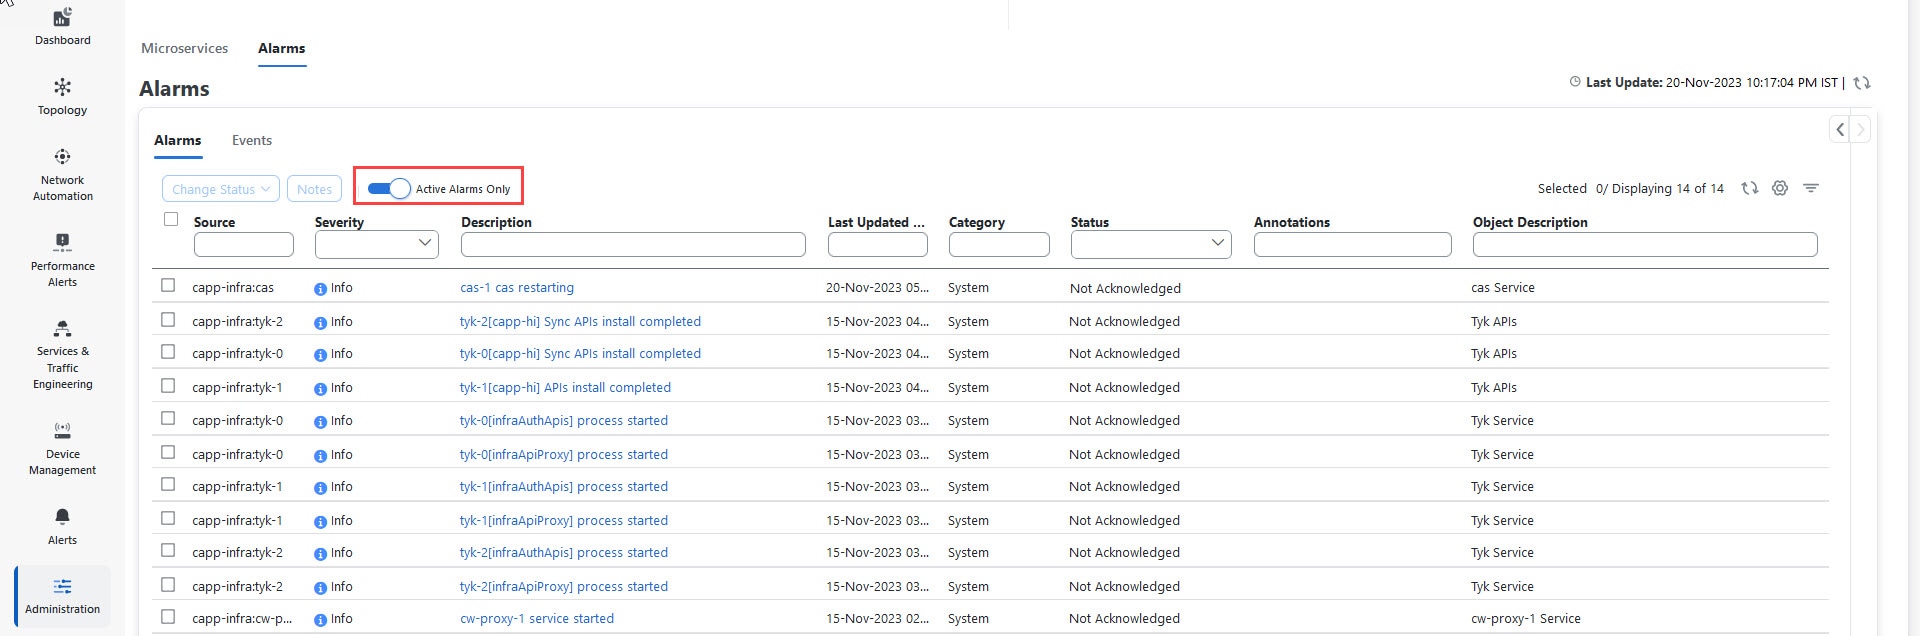
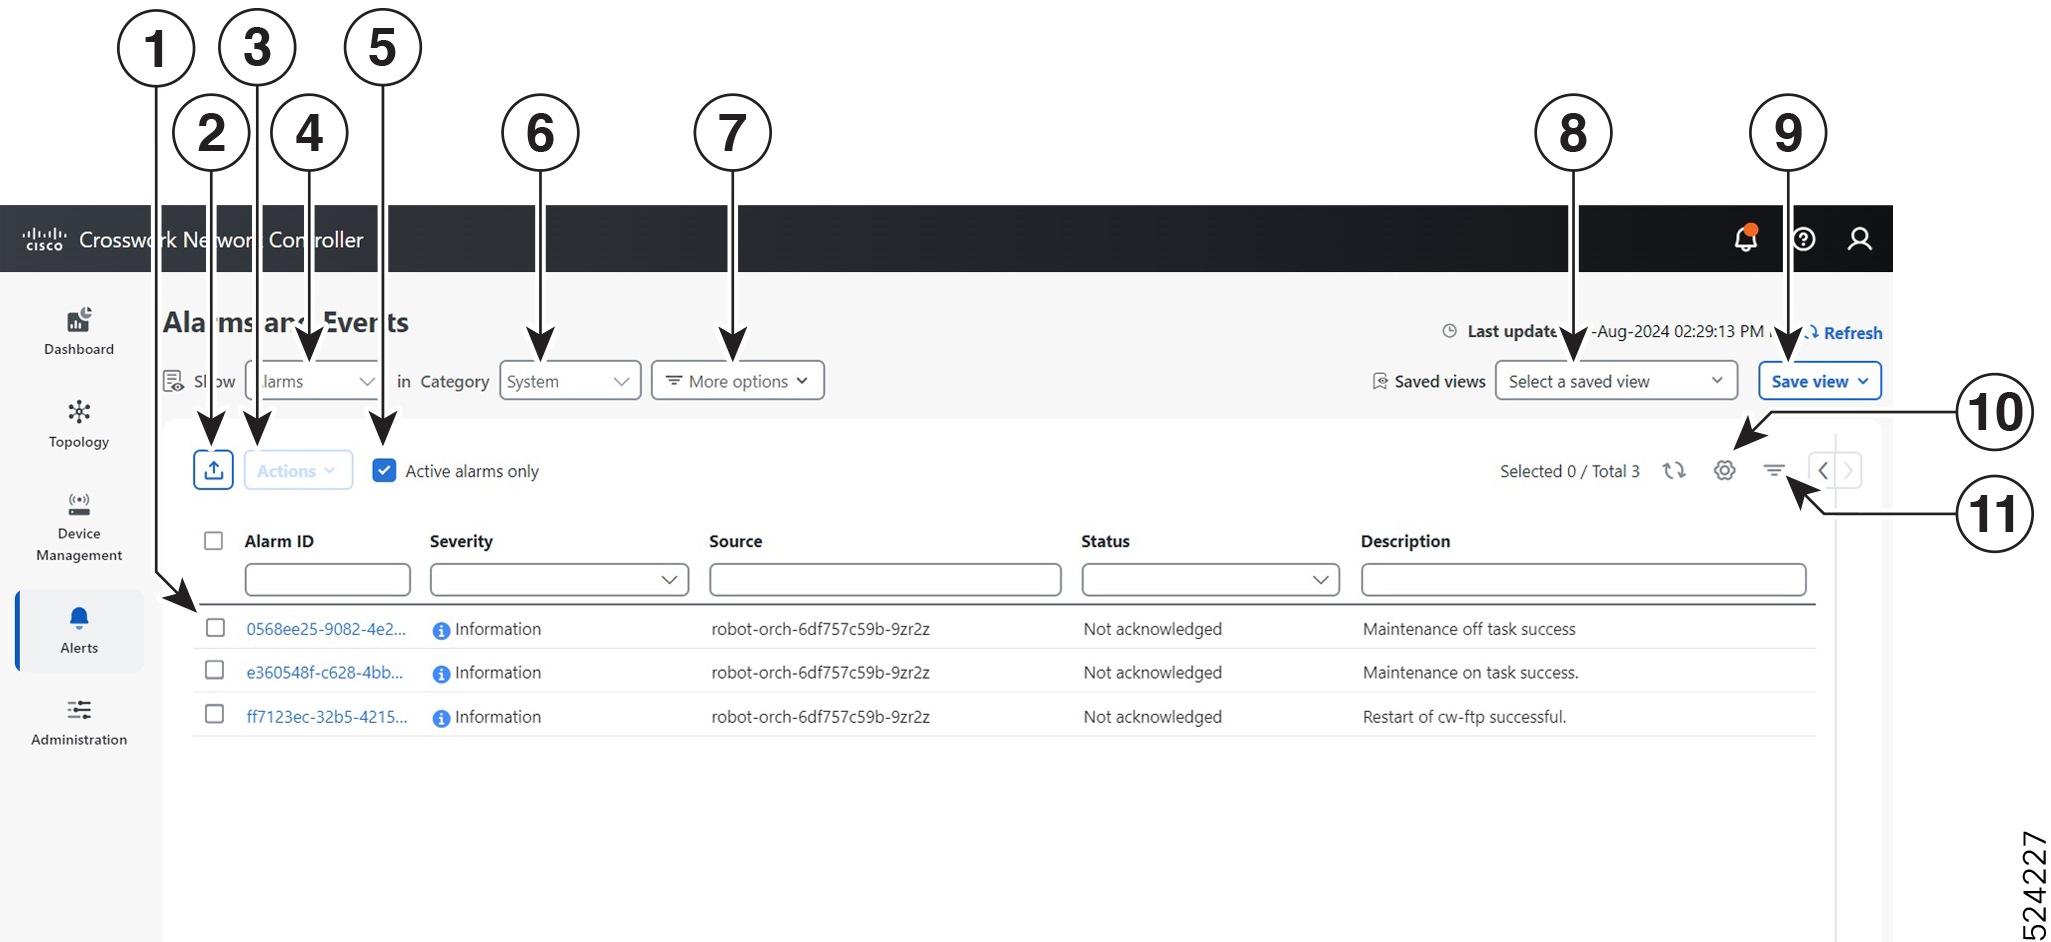
From the Alarms tab, you can:
-
Filter the active alarms.
-
Click the alarm description to drill down on alarm details.
-
Change the status of the alarms (Acknowledge, Unacknowledge, Clear).
-
Add notes to alarms.
-
View list of events in the product.
-
View the correlated alarm for each event.
Visually monitor system functions in real time
You can monitor the health of Crosswork Network Controller and any of its functions in real time, using a set of monitoring dashboards you can access from the Crosswork Manager window.
Crosswork Network Controller uses Grafana to create these dashboards. The dashboards display the graphical view of the product's infrastructure, using metrics collected in its database. You can use these dashboards to diagnose problems you may encounter with individual Crosswork Network Controller applications or their underlying services.
There are multiple monitor dashboards. Each dashboard is categorized by the type of functionality it monitors and the metrics it provides. This table lists some categories that may be available depending on which Crosswork Network Controller applications are installed.
|
This dashboard category... |
Monitors... |
|---|---|
|
Change Automation |
Playbook functions. Metrics include the number of MOP jobs executed, response latency, API calls, database activity, and so on. |
|
Optima |
Feature pack, traffic, and SR-PCE dispatcher functions. |
|
Collection - Manager |
Device-data collection functions. Metrics include telemetry collection latencies, total collection operations, memory and database activity related to telemetry, delayed collections, and so on. |
|
Health Insights |
Key Performance Indicator functions. Metrics include the number of KPI alerts, API calls, and so on. |
|
Infra |
System infrastructure messaging and database activity. |
|
Inventory |
Inventory manager functions. These metrics include total numbers of inventory change activities. |
|
Platform |
System hardware and communications usage and performance. Metrics include disk and CPU usage, database size, network and disk operations, and client/server communications. |
| ZTP |
Zero Touch Provisioning functions. |
To conserve disk space, Crosswork Network Controller maintains a maximum of 24 hours of collected metric data.
Grafana is an open-source visualization tool. This section provides general information about how to use the Crosswork Network Controller implementation of Grafana. For more information about Grafana itself, see https://grafana.com and http://docs.grafana.org
Procedure
|
Step 1 |
From the main menu, choose . |
||||||||||||||||||||
|
Step 2 |
At the top right, click View More Visualizations. The Grafana user interface appears. |
||||||||||||||||||||
|
Step 3 |
In the Grafana user interface, click Home. Grafana displays the list of monitoring dashboards and their categories, as shown in this example. 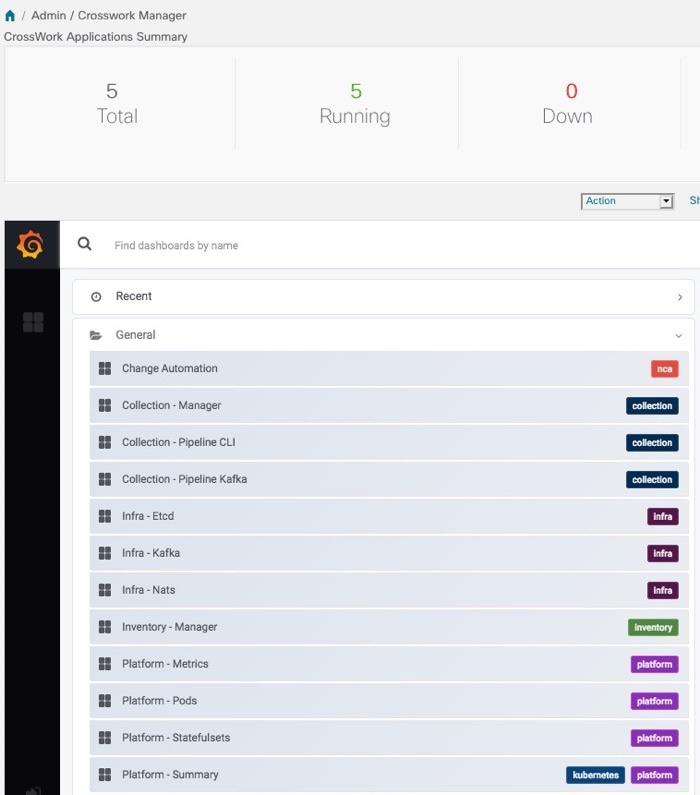
|
||||||||||||||||||||
|
Step 4 |
Click the dashboard you want to view. For example, when you click on Platform - Summary dashboard, a view appears similar to one shown in the next figure. 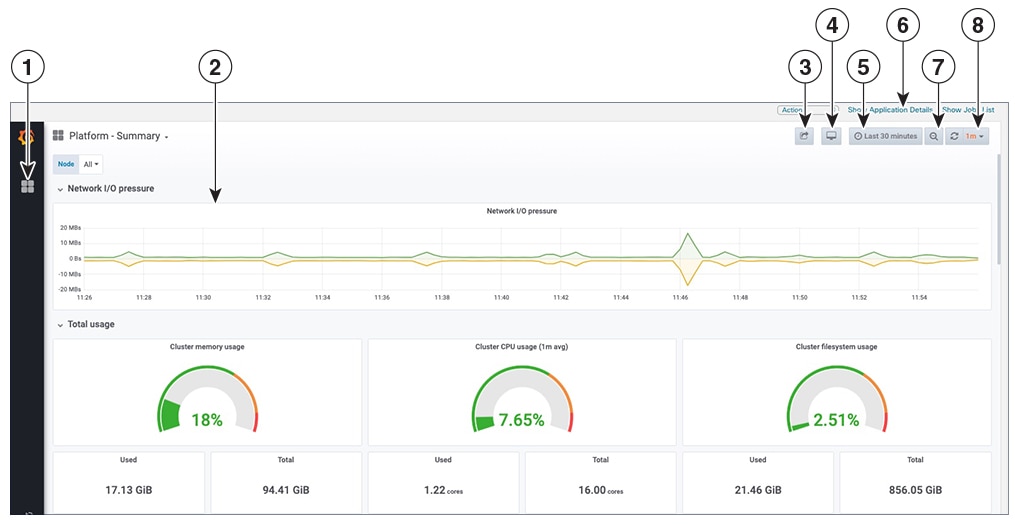
|
||||||||||||||||||||
|
Step 5 |
Scroll the dashboard to display all the metrics, or select any of the functions described in the following table.
|
Check system health
In this example, you can navigate through the different windows and identify areas to check for a healthy Crosswork system.
Procedure
|
Step 1 |
Check overall system health.
|
|
Step 2 |
Check and view detailed information about the microservices that run as part of the Crosswork Platform Infrastructure.
|
|
Step 3 |
Check and view the alarms and events related to the microservices.
|
|
Step 4 |
View which Crosswork applications are installed.
|
|
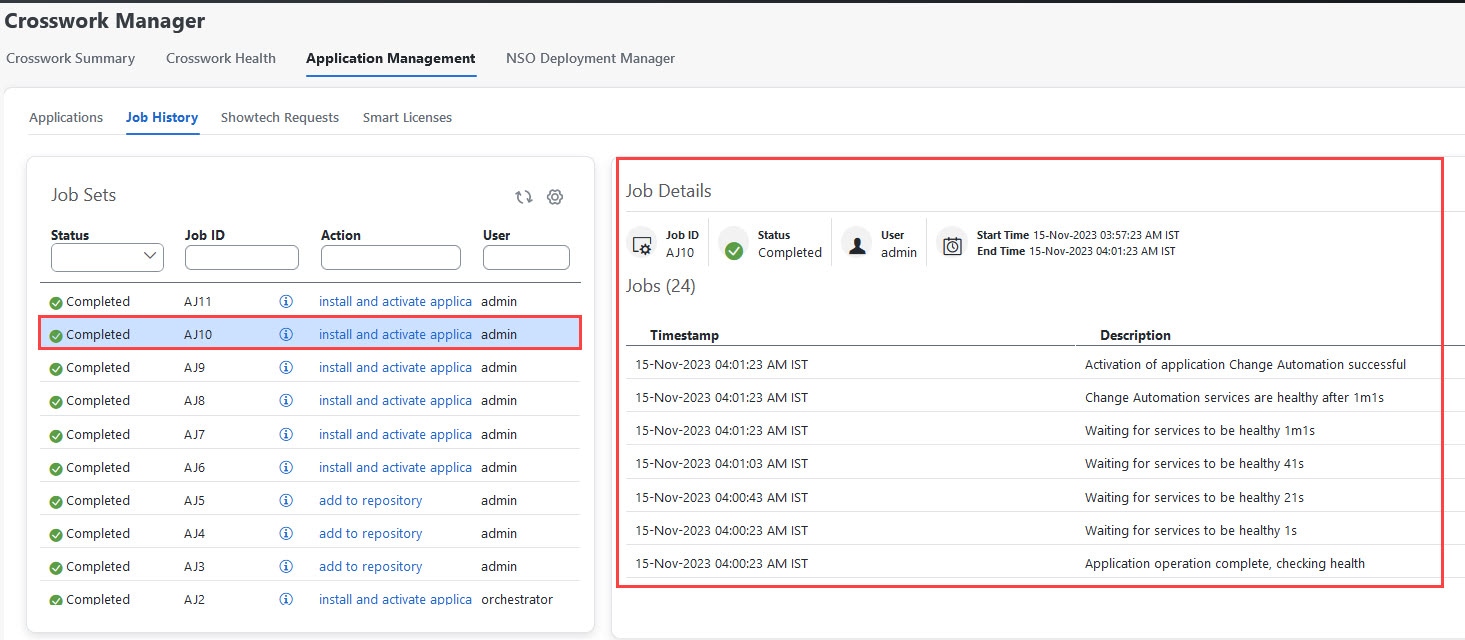
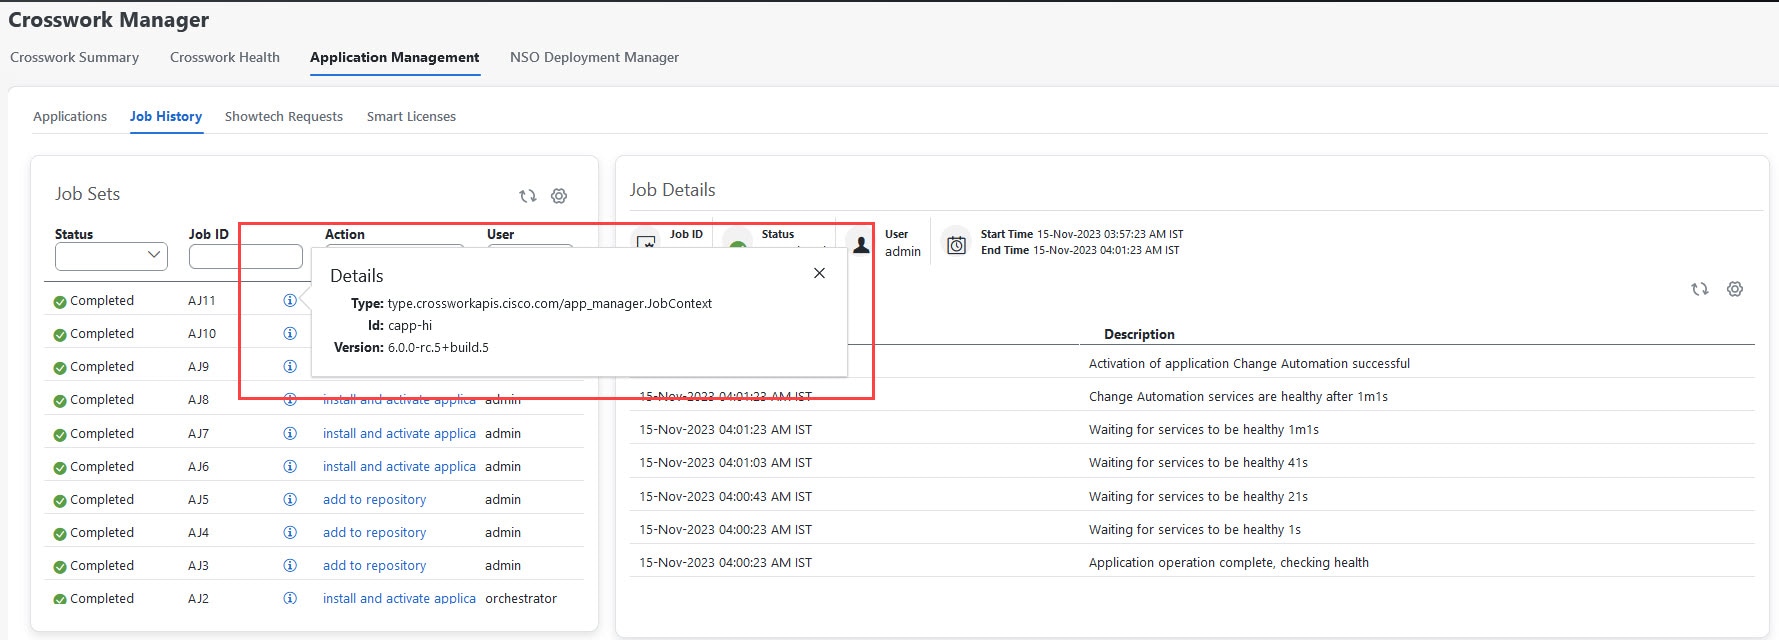
Step 5 |
View the status of jobs.
|
 Feedback