Event and System logs

Consolidated application logs

Summary Data

Table 1. Summary Data
Applicable Product(s) or Functional Area cnAAA
Applicable Platform(s) SMI
Feature Default Setting Enabled – Always-on
Related Documentation Not Applicable

Feature History

Table 2. Feature History
Feature Details Release
First introduced.

2025.01.0

Feature Description

CPC provides a centralized view of the application logs that are consolidated from different containers. The unified view improves the efficiency as you can determine the issue faster instead of accessing the individual containers to view the logs. Collection of logs from the containers is enabled by default.

You can view the logs in the real time and offline mode. The real-time mode captures the current event activity that is performed on the container. In the offline mode, you have the flexibility to access the logs from a remote machine.

Logs are listed based on the timestamp at which they are generated.

How it Works

This section describes how this feature works.

The OAM node hosts the logs which different application containers generate. These containers include the cnAAA (engine), cnAAA-radius-ep, policy-builder, radius-ep, crd, and unifiedapi.

View the logs

This section describes how to view the consolidated application logs.

To view the consolidated logs, use the following command:

kubectl logs -n namespace consolidated-logging-0 

NOTES:

  • namespace – Specifies the namespace under which cnAAA is deployed.

Troubleshoot Information

This section provides information for troubleshooting any issues that may arise during the feature operation.

If the logs are not generated in the consolidated-logging-0 pod, then one of the following conditions may be causing the failure. To resolve the issue, make sure that you do the following:

  • Verify the status of <namespace>-cnAAA-oam-app helm deployment. To view the configured helm charts and their status, use the following command:

    helm list 
  • Ensure that the gRPC stream appender is enabled by verifying the contents of cps-logback configMap. To verify the contents, use the following command:

    kubectl describe configmap -n  namespace cps-logback 
  • Ensure that the consolidated-logging-0 pod is up and running. To check the pod status, use the following command:

    kubectl describe pod consolidated-logging-0 -n namespace 
  • Verify that the consolidated-logging-0 pod is accessible through the consolidated-logging service. To verify the connection, use the nc command.

    For more information on consolidated logging, see Consolidated AAA log files section

Consolidated AAA log files

The directory /data/consolidated-aaa-logging/, located inside the pod consolidated-aaa-logging-0, contains these logs which provide a comprehensive view of system operations, user activities, API interactions, retry and failure events, and core engine and application processing.

bng-device-audit.log: Logs create, update, and delete operations on BNG devices through Policy Enforcement Point, REST API. This includes the timestamp, source IP, operation, and API content.

qns-custrefdata_audit.log: Logs create, update, and delete operations on CRD table entries through REST API. This includes the timestamp, operation, source IP, and API content.

lastlogin_user_pb.log: Logs details of the last user login to Policy Builder (PB). This includes the username, timestamp, and message.

lastlogin_user_cc.log: Logs details of the last user login to Control Center. This includes the username, timestamp, and message.

qns-audit-pb.log: Logs PB user login, logout, publish, and save client repository actions. This includes the timestamp, username, source IP, and message.

qns-audit.log: Logs Control Center user login, logout, subscriber create, update, delete, and subscriber SSID add or remove actions. This includes the timestamp, username, source IP, and message.

qns-pb-publish-svn-diff.log: Logs SVN differences when a user publishes in PB. This includes the timestamp, username, and list of repository changes.

coaBackOffFailureReport.csv: Logs CoA BackOff retry failures that exceed maximum retransmission. This includes the timestamp, session ID, BNG IP, subscriber ID, service details, error type, and NAS error code.

ocs_consolidated-retryandsuccess.csv: Logs proxy accounting messages that reached the primary or secondary OCS server after retries. This includes the timestamp, server name, server IP, retry count, and request details.

pmz_consolidated-retryandsuccess.csv: Logs proxy accounting messages that reached primary or secondary PMZ server after retries. This includes the timestamp, PMZ server name, message with PMZ server IP, number of retries, Request message details.

ocs_consolidated-retryandfailure.csv: Logs proxy accounting messages that failed to reach primary or secondary OCS server after all the retries. This includes the timestamp, OCS server name, message with OCS server IP, number of retries, Request message details.

pmz_consolidated-retryandfailure.csv: Logs proxy accounting messages that failed to reach PMZ servers after all retries. This includes the timestamp, PMZ server name, message with PMZ server IP, number of retries, Request message details.

consolidated-engine.log: Logs core engine processing messages.

consolidated-app.log: Logs application processing, including RADIUS endpoint pod, engine processing, and network device manager logs.

consolidated-api.log: Logs Unified API interactions.

policybuilder.log: Captures policy builder pod logs.

Accounting mismatch with retry and failure logging mechanism to OCS

The retry and failure logging mechanism for OCS accounting messages records accounting mismatches in CSV files when cnAAA does not deliver messages to OCS due to reachability issues.

cnAAA supports these types of Accounting messages:

  • Messages that are retried and successful on successive retries will be logged in consolidated-retryandsuccess.csv.

  • Messages that are retried and fail in all retries will be logged in consolidated-retryandfailure.csv.

Sample output for consolidated-retryandsuccess.csv
Sample output for consolidated-retryandfailure.csv format.

Log file location in consolidated-aaa-logging-0 pod : /data/consolidated-aaa-logging.

System and Syslog activity logging

System and Syslog activity logging allows you to track and monitor user activities within the CPC environment. This feature provides data for security auditing and troubleshooting by capturing logs of user sessions, command executions, and system events.

This feature helps you:

  • Monitor for unauthorized access or suspicious activity by tracking login attempts and command history.

  • Identify system changes or specific commands that lead to operational issues such as deletion of files, change in access control or system configuration changes.

  • Maintain a chronological record of user interactions with the system.

The logging framework uses standard Linux utilities and the psacct package (integrated as the userlog tool) to provide:

  • User session tracking: The system records login and logout times, session durations, and source IP addresses.

  • Command history: Captures a list of commands executed by specific users or across the entire system.

  • System reboot history: Tracks the frequency and timestamps of system reboots.

  • Security monitoring: Logs failed user login attempts to identify potential brute-force attacks.

Command reference and usage

Use the commands described in this section to retrieve activity logs. Some commands require sudo privileges.

  • Monitor user sessions:

    The last command displays a list of all users who logged in and out since the log file was created.

    Example output:

    user@rid8447988-1-master1:~$ sudo last
    luser    pts/0        10.0.1.20        Tue Feb 24 07:27   still logged in
    luser    pts/0        10.0.1.20        Tue Feb 24 05:59 - 06:24  (00:25)
    luser    pts/0        10.0.1.20        Tue Feb 24 04:24 - 05:46  (01:22)
    reboot   system boot  6.8.0-58-generic Mon Feb 23 21:21   still running
    reboot   system boot  6.8.0-58-generic Mon Feb 23 10:12   still running
    reboot   system boot  6.8.0-58-generic Fri Feb 20 21:25   still running
    luser    pts/0        10.0.1.20        Fri Feb 20 08:42 - 08:57  (00:15)
    luser    pts/0        10.0.1.20        Fri Feb 20 04:22 - 05:02  (00:39)
    luser    pts/0        10.0.1.20        Thu Feb 19 14:04 - 14:20  (00:15)
    luser    pts/0        10.0.1.20        Thu Feb 19 13:57 - 14:01  (00:04)
    luser    pts/1        10.0.1.20        Thu Feb 19 12:25 - 13:34  (01:09)
    luser    pts/0        10.0.1.20        Thu Feb 19 12:00 - 13:26  (01:26)
    luser    pts/0        10.0.1.20        Thu Feb 19 11:06 - 11:59  (00:52)
    luser    pts/1        10.0.1.20        Thu Feb 19 10:52 - 11:36  (00:43)
    luser    pts/0        10.0.1.20        Thu Feb 19 10:46 - 11:02  (00:15)
    luser    pts/2        10.0.1.20        Thu Feb 19 10:35 - 10:51  (00:15)
    luser    pts/1        10.0.1.20        Thu Feb 19 10:32 - 10:47  (00:15)
    luser    pts/0        10.0.1.20        Thu Feb 19 10:26 - 10:46  (00:19)
    luser    pts/0        10.0.1.20        Thu Feb 19 10:23 - 10:24  (00:00)
    luser    pts/0        10.0.1.20        Thu Feb 19 10:21 - 10:22  (00:00)
    luser    pts/0        10.0.1.20        Thu Feb 19 09:53 - 10:21  (00:27)
    luser    pts/0        10.0.1.20        Thu Feb 19 09:35 - 09:51  (00:15)
    luser    pts/0        10.0.1.20        Thu Feb 19 06:13 - 06:30  (00:16)
    luser    pts/0        10.0.1.20        Thu Feb 19 04:37 - 04:54  (00:16)
  • Identify last login per user:

    The lastlog command displays the login name, port, and the last time each user (including system users like root and daemon) logged into the system.

    Example output:

    luser@rid8447988-1-master1:~$ sudo lastlog
    Username         Port     From                                       Latest
    root                                                                **Never logged in**
    daemon                                                              **Never logged in**
    bin                                                                 **Never logged in**
    sys                                                                 **Never logged in**
    sync                                                                **Never logged in**
    games                                                               **Never logged in**
    man                                                                 **Never logged in**
    lp                                                                  **Never logged in**
    mail                                                                **Never logged in**
    news                                                                **Never logged in**
    uucp                                                                **Never logged in**
    proxy                                                               **Never logged in**
    www-data                                                            **Never logged in**
    backup                                                              **Never logged in**
    list                                                                **Never logged in**
    irc                                                                 **Never logged in**
    _apt                                                                **Never logged in**
    nobody                                                              **Never logged in**
    systemd-network                                                     **Never logged in**
    systemd-timesync                                                    **Never logged in**
    dhcpcd                                                              **Never logged in**
    messagebus                                                          **Never logged in**
    systemd-resolve                                                     **Never logged in**
    pollinate                                                           **Never logged in**
    polkitd                                                             **Never logged in**
    syslog                                                              **Never logged in**
    uuidd                                                               **Never logged in**
    tcpdump                                                             **Never logged in**
    tss                                                                 **Never logged in**
    landscape                                                           **Never logged in**
    fwupd-refresh                                                       **Never logged in**
    usbmux                                                              **Never logged in**
    sshd                                                                **Never logged in**
    _aide                                                               **Never logged in**
    systemd-coredump                                                    **Never logged in**
    _chrony                                                             **Never logged in**
    sssd                                                                **Never logged in**
    tac                                                                 **Never logged in**
    luser            pts/0    10.0.1.20                                 Tue Feb 24 07:27:28 +0000 2026
    luser@rid8447988-vbagalak-1-master1:~$
    
  • View command history:

    The history command displays the buffer of the most recent commands entered in the current session.

    Example output:

    luser@rid8447988-1-master1:~$ history
       23  2025-12-08 13:16:56 ls
       24  2025-12-08 13:16:59 cat global-smi.yaml
       25  2025-12-08 13:17:00 ;s
       26  2025-12-08 13:17:03 cat cee-smi.yaml
       27  2025-12-08 13:22:02 vim cee-smi.yaml
       28  2025-12-08 13:24:39 ls
       29  2025-12-08 13:24:43 cat global-smi.yaml
       30  2025-12-08 13:33:13 cat cee-smi.yaml
       31  2025-12-09 12:14:26 kubectl get pods -n pcf | grep prom
       32  2025-12-09 12:14:43 kubectl exec -it prometheus-rules-etcd-5cf4d58496-wfpnb -n cpf -- bash
       33  2025-12-09 12:14:50 kubectl exec -it prometheus-rules-etcd-5cf4d58496-wfpnb -n pcf -- bash
       34  2025-12-10 05:46:25 ssh -p 2024 admin@10.100.133.79
       35  2025-12-10 05:54:51 kubectl get pods -A | grep redis
       36  2025-12-10 05:55:13 kubect logs redis-keystore-0 -n pcf
       37  2025-12-10 05:55:23 kubectl logs redis-keystore-0 -n pcf
       38  2025-12-10 05:55:31 kubectl logs redis-keystore-1 -n pcf
       39  2025-12-10 05:55:44 kubectl logs redis-queue-0 -n pcf
       40  2025-12-10 05:55:49 kubectl logs redis-queue-1 -n pcf
       41  2025-12-10 05:55:54 kubectl logs redis-queue-2 -n pcf
       42  2025-12-10 05:56:02 ssh -p 2024 admin@10.100.133.79
       43  2025-12-10 05:59:10 kubectl exec -it redis-queue-0 -n pcf -- bash
       44  2025-12-10 06:00:02 ssh -p 2024 admin@10.100.133.79
       45  2025-12-10 06:01:23 kubectl exec -it redis-queue-0 -n pcf -- bash
       46  2025-12-10 06:02:10 kubectl get pods -A | grep redis
       47  2025-12-10 08:08:36 kubectl get pods -A | grep aaa
       48  2025-12-10 08:08:47 kubectl get pods -A -o wide | grep aaa
       49  2025-12-10 08:09:00 ip r
       50  2025-12-10 08:09:18 ssh -i luser.pem luser@10.1.43.220
       51  2025-12-10 08:09:39 kubectl get nodes -o wide
       52  2025-12-10 08:09:51 ssh -i luser.pem luser@10.1.44.174
       53  2025-12-10 08:10:32 cd /data/
  • Track specific user activity:

    The .bash_history command shows all commands a specific user executed over time, inspect the user's bash history file.

    Example output:

    luser@rid8447988-1-master1:~$ sudo cat /home/luser/.bash_history
    kubectl exec -it redis-queue-0 -n pcf -- bash
    #1764911584
    ssh -p 2024 admin@10.100.133.79
    #1764912019
    kubectl get pods -n <namespace>
    #1764912023
    kubectl get pods -n pcf
    #1764912041
    kubectl get pods -n pcf | grep redis
    #1764912071
    kubectl logs redis-queue-1 -n pcf
    #1764912088
    kubectl logs redis-queue-0 -n pcf
    #1764912100
    kubectl get pods -n pcf | grep redis
    #1764912119
    kubectl logs redis-queue-1 -n pcf
    #1764912125
    kubectl get pods -n pcf | grep redis
    #1764912141
    ssh -p 2024 admin@10.100.133.79
  • View system reboot history:

    The last reboot command tracks how many times the system rebooted and the kernel version used.

    Example output:

    luser@rid8447988-1-master1:~$ sudo last reboot
    reboot   system boot  6.8.0-58-generic Mon Feb 23 21:21   still running
    reboot   system boot  6.8.0-58-generic Mon Feb 23 10:12   still running
    reboot   system boot  6.8.0-58-generic Fri Feb 20 21:25   still running
    reboot   system boot  6.8.0-58-generic Wed Feb  4 04:39   still running
    
  • View failed login attempts:

    The lastb command lists all failed login attempts recorded in the /var/log/btmp file.

    Example output:

    luser@rid8447988-1-master1:~$ sudo lastb
    vagrant  ssh:notty    173.37.95.247    Sun Feb 22 16:30 - 16:30  (00:00)
    service  ssh:notty    173.37.95.247    Sun Feb 22 16:30 - 16:30  (00:00)
    service  ssh:notty    173.37.95.247    Sun Feb 22 16:30 - 16:30  (00:00)
    nessus_7 ssh:notty    173.37.95.247    Sun Feb 22 16:30 - 16:30  (00:00)
    service  ssh:notty    173.37.95.247    Sun Feb 22 16:30 - 16:30  (00:00)
    Fortiman ssh:notty    173.37.95.247    Sun Feb 22 16:30 - 16:30  (00:00)
    nessus_7 ssh:notty    173.37.95.247    Sun Feb 22 16:30 - 16:30  (00:00)
    nessus_7 ssh:notty    173.37.95.247    Sun Feb 22 16:30 - 16:30  (00:00)
             ssh:notty    173.37.95.247    Sun Feb 22 16:25 - 16:25  (00:00)
    cisco    ssh:notty    173.37.95.247    Sun Feb 22 16:25 - 16:25  (00:00)
    cisco    ssh:notty    173.37.95.247    Sun Feb 22 16:25 - 16:25  (00:00)
    cisco    ssh:notty    173.37.95.247    Sun Feb 22 16:25 - 16:25  (00:00)
    ADSL     ssh:notty    173.37.95.247    Sun Feb 22 16:16 - 16:16  (00:00)
    ADSL     ssh:notty    173.37.95.247    Sun Feb 22 16:16 - 16:16  (00:00)
    ADSL     ssh:notty    173.37.95.247    Sun Feb 22 16:16 - 16:16  (00:00)
    adminuse ssh:notty    173.37.95.247    Sun Feb 22 16:16 - 16:16  (00:00)
    adminuse ssh:notty    173.37.95.247    Sun Feb 22 16:16 - 16:16  (00:00)
    adminuse ssh:notty    173.37.95.247    Sun Feb 22 16:16 - 16:16  (00:00)
    Administ ssh:notty    173.37.95.247    Sun Feb 22 16:15 - 16:15  (00:00)
    Administ ssh:notty    173.37.95.247    Sun Feb 22 16:15 - 16:15  (00:00)
    Administ ssh:notty    173.37.95.247    Sun Feb 22 16:15 - 16:15  (00:00)
    Administ ssh:notty    173.37.95.247    Sun Feb 22 16:15 - 16:15  (00:00)
    Administ ssh:notty    173.37.95.247    Sun Feb 22 16:15 - 16:15  (00:00)
    Administ ssh:notty    173.37.95.247    Sun Feb 22 16:15 - 16:15  (00:00)

Search Facility

The search_facility.sh script searches and filters large volumes of compressed consolidated engine log files for cnAAA. This utility automates troubleshooting network accounting issues, identifies subscriber sessions, and analyze network traffic patterns by correlating MAC addresses with session IDs and message types within specific time ranges. The primary goal is to reduce log analysis time, enhancing operational efficiency.

How the log search utility works

The Search_Facility.sh script, found in the pcf-utilities pod, is copied and executed from the log directory on a remote logging server.

  • It processes compressed .gz log files that follow a standard date-time naming convention.

  • The script supports searching for ServiceAccounting and SessionAccounting messages.

  • It correlates MAC addresses with session IDs across these message types.

  • The script filters logs by specific time ranges, MAC addresses, and session IDs.

  • All search results compile into a single output file.

  • The script features interactive prompts with error handling for user inputs.

Log forwarder utility

The logs_forwarder.sh Bash script automates transferring log files from a local directory to a remote server using SCP. It renames each file with a time-stamp based on its last modification time for version control and chronological organization.

Use the Log Forwarder Utility: Follow these steps to use the log forwarder script.

  1. Locate the logs_forwarder.sh script in the pcf-utilities-0 pod under /data/utilities/support/script/search-facility/.

  2. Copy the logs_forwarder.sh script to the location where the log files are available.

  3. Modify the logs_forwarder.sh file by providing the following details:

    • SRC_DIR: Source directory containing log files to transfer.

    • DEST_DIR: Destination directory on the remote server.

    • DEST_HOST: IP address of the destination server.

    • DEST_USER: Username for remote server authentication.

  4. Execute the script to forward logs.

    ./logs_forwarder.sh

The script renames the log files by appending the time-stamp (consolidated-engine-YYYY-MM-DD-HH.X.log.gz).


Note


The logs_forwarder.sh script is for reference and can be modified according to specific requirements.


Use the log search utility

Procedure

Follow these steps to use the log search utility:


Follow these steps to use the log search utility:

Step 1

Log in to a cnAAA server.

Step 2

Locate the search_facility.sh script in the pcf-utilities-0 pod under /data/utilities/support/script/search-facility/

Step 3

Copy the search_facility.sh script to the specific log directory on the remote logging server where the search is performed.

Step 4

Open a terminal in the log directory.

Step 5

Execute the script, providing the log directory path as an argument.

./search_facility.sh /path/to/logs

Replace /path/to/logs with the actual log directory path.

Step 6

When prompted by the script, enter these parameters:

  1. Start Date: Enter the date in yyyy-mm-dd format.

  2. Start/End Hour (Optional): Specify hours in 00-23 format. If a start hour is provided, the end hour is mandatory.

  3. End Date: Enter the date in yyyy-mm-dd format.

  4. MAC Address: Enter the MAC address in xxxx.xxxx.xxxx format.

  5. Message Type (Optional): Specify ServiceAccounting or SessionAccounting. If omitted, both types are included by default.

  6. Session ID (Optional): Provide the Acct-Session-Id for session correlation.

Note


The script validates entries for correct formats, logical consistency (for example, no future dates, valid MAC address, hour ranges), and required arguments. If an entry is invalid, the script prompts again or exits with an informative message.


Example

Running the Search Facility Script

root@m6-calipers-vm3:~# ./search_facility.sh /root/search_facility_logs
Log Directory /root/search_facility_logs
Enter Start Date(yyyy-mm-dd): 2025-09-14
Enter Start Hour(00..23) [Optional]: 00
Enter End Date(yyyy-mm-dd): 2025-09-14
Enter End Hour(00..23): 23
Enter Mac Address(xxxx.xxxx.xxxx): 7B11.9A3C.0005
Enter Message Type(ServiceAccounting/SessionAccounting) [Optional]: 
INFO: No message type provided. Both ServiceAccounting and SessionAccounting will be used as search criteria.
*********************************************** Session ID **********************************************
Enter Session ID [Optional]: 00604beb
********************************************* Final Result *********************************************
Final output gets stored in file named search_results present under /root/search_facility_logs
*********************************************************************************************************

Configure package level logging

Configure core packages to log only error-level messages to filters out high-volume or debug data. This reduces log noise, optimizes Persistent Volume Claim (PVC) storage, and minimizes I/O overhead. This configuration helps to identify system errors quickly by generating relevant log entries.

Follow these steps to configure package level logging:

Procedure


Step 1

Log in to the Ops-Center CLI and enter the config command.

Step 2

Set the logging level for the core Cisco package.

Example:

debug logging logger com.cisco
  level error
exit

Step 3

Set the logging level for the RADIUS package.

debug logging logger com.cisco.radius
  level error
exit

Step 4

commit the changes.


Separation of accounting retry messages logging for OCS and PMZ

Feature description

Feature Name

Release Information

Description

Separation of accounting retry messages logging for OCS and PMZ

2025.03.0

This feature enables a separate accounting retry message logs for Online Charging System (OCS) servers and Passive/Offline Charging System (PMZ) servers. By adding a server-type parameter in the Ops Center configuration, the system organizes logs based on server type. This update improves log traceability and troubleshooting by distinguishing between success and failure logs. This enhances operational efficiency and system management.

This feature separates accounting retry message logs for OCS and PMZ servers. The system creates dedicated log files for each server type and further classifies them into "retry success" and "retry failure" categories. By configuring a new server-type property, the system directs logs to the appropriate files. This structured logging approach simplifies troubleshooting and improves clarity in log data management, making it easier to identify and resolve issues.

How this feature works

  • The system adds a server-type parameter to the RADIUS server configuration. Set "online" for OCS or "offline" for PMZ.

  • On each accounting retry, the system checks the server-type and writes logs to the corresponding OCS or PMZ files.

  • Each server type uses two log files: one for retry successes and one for retry failures.

  • If you do not set the server-type, the system defaults to OCS (online) log files.

  • The system manages log files with automatic rotation based on size and file count.

Configuration

Procedure


Step 1

Set the server-type for each RADIUS server.

Example:

radius server-group grp1
 servers WB_12100
  server-type online
exit

servers PassiveMZ-12998
  server-type offline
exit

Note


Assign server-type online for OCS servers and server-type offline for PMZ servers to ensure logs are categorized correctly.

Note


Ensure CEE namespace is deployed to support Persistent Volume.

Step 2

Enable persistent storage to retain the log files.

pcf(config)# k8s use-volume-claims true
pcf(config)# db global-settings volume-storage-class local

Step 3

Ensure consolidated-aaa-logging-0 pod is not added under disable-pods.

pcf(config)# show full-configuration pods-management disable-pods
% No entries found.

Step 4

Verify the log file updates according to the configured server -type.

kubectl exec -it -n pcf consolidated-aaa-logging-0 -- bash
cd /data/consolidated-aaa-logging/
ls
ocs_consolidated-retryandsuccess.csv
ocs_consolidated-retryandfailure.csv
pmz_consolidated-retryandsuccess.csv
pmz_consolidated-retryandfailure.csv

Use cases

These use cases show the configuration for logging of proxy accounting retry messages for OCS and PMZ servers.

No Log for Successful First Attempt: The system does not generate a log entry when an accounting message successfully reaches the primary OCS or PMZ server on the first attempt.

radius server-group grp1
  servers WB_12100
    primary    10.1.43.142
    secondary  10.1.43.140
    nas-ip     11.11.118.69
    timeout-seconds      5 
    server-type online
    retries    3
  exit

  servers PassiveMZ-12998
    primary    10.1.45.171
    secondary  10.1.45.170
    nas-ip     11.11.118.69
    timeout-seconds      5
    server-type offline
    retries    3
  exit

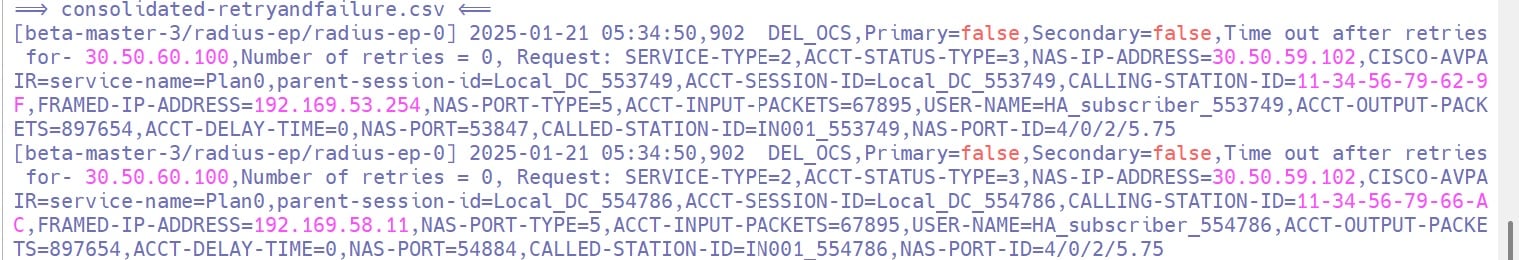
Log for Failure After All Retries: The system generates a log entry in ocs_consolidated-retryandfailure.csv, pmz_consolidated-retryandfailure.csv when an accounting message fails to reach both primary and secondary OCS or PMZ servers after all retries.

radius server-group grp1
  servers WB_12100
    primary    10.1.43.142
    secondary  10.1.43.140
    nas-ip     11.11.118.69
    timeout-seconds      5
    server-type online
    retries    3
  exit

  servers PassiveMZ-12998
    primary    10.1.45.171
    secondary  10.1.45.170
    nas-ip     11.11.118.69
    timeout-seconds      5
    server-type offline
    retries    3
  exit

This is a sample log entry for OCS server in Log for Failure After All Retries scenario.

2025-06-16 18:13:25,940  WB_12100,Primary=false,Secondary=false,Time out after retries for- 10.1.43.140,
Number of retries = 3, Request: FRAMED-IP-ADDRESS=192.168.3.10,CALLING-STATION-ID=0005.9A3C.2A02,NAS-PORT-TYPE=5,
USER-PASSWORD=xxxxxxxxx,USER-NAME=0005.9A3C.2A02,ACCT-STATUS-TYPE=1,NAS-IP-ADDRESS=11.11.118.69,
NAS-PORT=0,CISCO-AVPAIR=parent-session-id=00011,service-name=A0F0050M050M000005MQ,portbundle=enable,
ACCT-SESSION-ID=child_00011,NAS-PORT-ID=0/0/0/701

This is a sample log entry for PMZ server in Log for Failure After All Retries scenario.

2025-06-16 18:13:15,960  PassiveMZ-12998,
Primary=false,Secondary=false,Time out after retries for- 10.1.45.170,Number of retries = 3,
Request: FRAMED-IP-ADDRESS=192.168.3.10,CALLING-STATION-ID=0005.9A3C.2A02,
NAS-PORT-TYPE=5,USER-PASSWORD=xxxxxxxxx,USER-NAME=0005.9A3C.2A02,ACCT-STATUS-TYPE=1,
NAS-IP-ADDRESS=11.11.118.69,NAS-PORT=0,CISCO-AVPAIR=parent-session-id=00011,
service-name=A0F0050M050M000005MQ,portbundle=enable,
ACCT-SESSION-ID=child_00011,NAS-PORT-ID=0/0/0/701

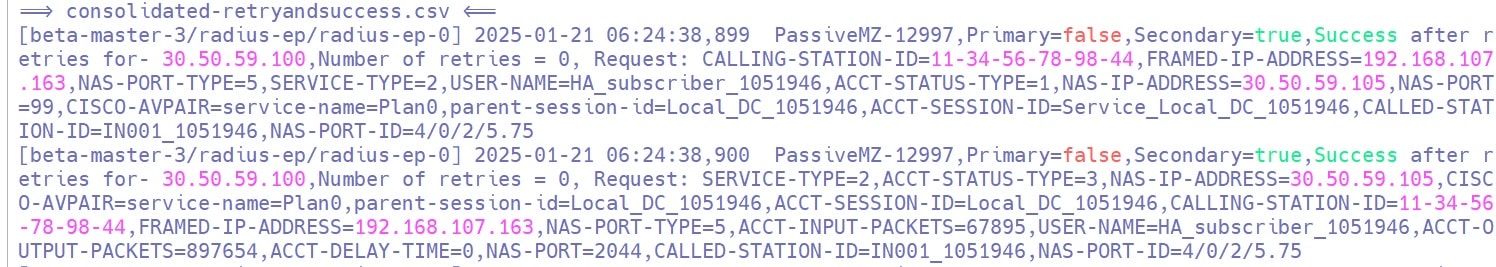
Log for Success on Secondary After Primary Fails: The system generates a log entry in ocs_consolidated-retryandsuccess.csv, pmz_consolidated-retryandsuccess.csv when an accounting message fails to reach the primary, but reaches the secondary OCS or PMZ server after all retries.

radius server-group grp1
  servers WB_12100
    primary    10.1.43.142
    secondary  10.1.43.140
    nas-ip     11.11.118.69
    timeout-seconds      5
    server-type online
    retries    3
  exit

  servers PassiveMZ-12998
    primary    10.1.45.171
    secondary  10.1.45.170
    nas-ip     11.11.118.69
    timeout-seconds      5
    server-type offline
    retries    3
  exit

This is a sample log entry for OCS server in Log for Success on Secondary After Primary Fails scenario.

2025-06-17 09:01:36,934  WB_12100,Primary=false,
Secondary=true,Success after retries for- 10.1.43.140,
Number of retries = 0, Request: FRAMED-IP-ADDRESS=192.168.3.10,
CALLING-STATION-ID=0005.9A3C.1A01,NAS-PORT-TYPE=5,USER-PASSWORD=xxxxxxxxx,
USER-NAME=0005.9A3C.1A01,ACCT-STATUS-TYPE=1,NAS-IP-ADDRESS=11.11.118.69,
NAS-PORT=0,CISCO-AVPAIR=parent-session-id=00011,service-name=A0F0050M050M000005MQ,
portbundle=enable,
ACCT-SESSION-ID=child_00011,NAS-PORT-ID=0/0/0/701

This is a sample log entry for PMZ server in Log for Success on Secondary After Primary Fails scenario.

2025-06-17 09:01:38,013  PassiveMZ-12998,Primary=false,
Secondary=true,Success after retries for- 10.1.45.170,Number of retries = 0,
 Request: FRAMED-IP-ADDRESS=192.168.3.10,CALLING-STATION-ID=0005.9A3C.1A01,
NAS-PORT-TYPE=5,USER-PASSWORD=xxxxxxxxx,USER-NAME=0005.9A3C.1A01,
ACCT-STATUS-TYPE=1,NAS-IP-ADDRESS=11.11.118.69,NAS-PORT=0,CISCO-AVPAIR=parent-session-id=00011,
service-name=A0F0050M050M000005MQ,portbundle=enable,
ACCT-SESSION-ID=child_00011,NAS-PORT-ID=0/0/0/701 

Log for Success After Retries to Primary: The system generates a log entry in ocs_consolidated-retryandsuccess.csv, pmz_consolidated-retryandsuccess.csv when an accounting message is delivered to the primary OCS or PMZ server after one or more retries.

radius server-group grp1
  servers WB_12100
    primary    10.1.43.142
    secondary  10.1.43.140
    nas-ip     11.11.118.69
    timeout-seconds      5
    server-type online
    retries    3
  exit

  servers PassiveMZ-12998
    primary    10.1.45.171
    secondary  10.1.45.170
    nas-ip     11.11.118.69
    timeout-seconds      5
    server-type offline
    retries    3
  exit

This is a sample log entry for OCS server in Log for Success After Retries to Primary scenario.

2025-06-13 18:52:25,632 WB_12100,Primary=true,Secondary=false,
Success not at first time - for- 10.1.43.142,Number of retries = 2,
 Request: FRAMED-IP-ADDRESS=192.168.3.10,CALLING-STATION-ID=0005.9A3C.4A04,
NAS-PORT-TYPE=5,USER-PASSWORD=xxxxxxxxx,USER-NAME=0005.9A3C.4A04,
ACCT-STATUS-TYPE=1,NAS-IP-ADDRESS= 11.11.118.69,NAS-PORT=0,CISCO-AVPAIR=parent-session-id=00011,
service-name=A0F0050M050M000005MQ,portbundle=enable,
ACCT-SESSION-ID=child_00011,NAS-PORT-ID=0/0/0/701

This is a sample log entry for PMZ server in Log for Success After Retries to Primary scenario.

2025-06-13 19:06:08,883 PassiveMZ-12998,Primary=true,
Secondary=false,Success not at first time - for- 10.1.45.171,
Number of retries = 2, Request: FRAMED-IP-ADDRESS=192.168.3.10,
CALLING-STATION-ID=0005.9A3C.4A04,NAS-PORT-TYPE=5,USER-PASSWORD=xxxxxxxxx,
USER-NAME=0005.9A3C.4A04,ACCT-STATUS-TYPE=1,NAS-IP-ADDRESS= 11.11.118.69,
NAS-PORT=0,CISCO-AVPAIR=parent-session-id=00011,service-name=A0F0050M050M000005MQ,portbundle=enable,
ACCT-SESSION-ID=child_00011,NAS-PORT-ID=0/0/0/701

Log for Full Queue: The system generates a log entry when the proxy queue is full and cannot process additional messages.

radius server-group grp1
  servers WB_12100
    primary    10.1.43.142
    secondary  10.1.43.140
    nas-ip     11.11.118.69
    timeout-seconds      5
    thread-pool-size 300
    server-type online
    max-proxy-queue-size 50000
    retries    3
  exit

  servers PassiveMZ-12998
    primary    10.1.45.171
    secondary  10.1.45.170
    nas-ip     11.11.118.69
    timeout-seconds      5
    thread-pool-size 300
    server-type offline
    max-proxy-queue-size 50000
    retries    3
  exit

This is a sample log entry for OCS server in Log for Full Queue scenario.

2025-07-05 14:59:10,109 WB_12100,Primary=false, 
Secondary=false,Queue Full for - 10.1.43.142,Number of retries = 0,
 Request: FRAMED-IP-ADDRESS=192.168.3.10,CALLING-STATION-ID=0005.9A3C.5A05,
NAS-PORT-TYPE=5,USER-PASSWORD=xxxxxxxxx,USER-NAME=0005.9A3C.5A05,ACCT-STATUS-TYPE=3,
NAS-IP-ADDRESS=11.11.118.69,NAS-PORT=0,CISCO-AVPAIR=parent-session-id=00011,
service-name=A0F0050M050M000005MQ,portbundle=enable,ACCT-SESSION-ID=child_00011,
NAS-PORT-ID=0/0/0/701

This is a sample log entry for PMZ server in Log for Full Queue scenario.

2025-07-05 14:59:10,108 PassiveMZ-12998,Primary=false,
 Secondary=false,Queue Full for - 10.1.45.171,Number of retries = 0, 
Request: FRAMED-IP-ADDRESS=192.168.3.10,CALLING-STATION-ID=0005.9A3C.5A05,
NAS-PORT-TYPE=5,USER-PASSWORD=xxxxxxxxx,USER-NAME=0005.9A3C.5A05,
ACCT-STATUS-TYPE=3,NAS-IP-ADDRESS=11.11.118.69,NAS-PORT=0,CISCO-AVPAIR=parent-session-id=00011,
service-name=A0F0050M050M000005MQ,portbundle=enable,
ACCT-SESSION-ID=child_00011,NAS-PORT-ID=0/0/0/701

This is a sample log file for Grafana GUI User Login Details:


Grafana user logging details are captured in Grafana pod which will be present under CEE namespace
$ kubectl get pods -A|grep graf
cee               grafana-bc8df4c5d-zxhb6                                       2/2     Running   3 (16d ago)     28d
cee               grafana-dashboard-metrics-9d666f59-m67zg                      1/1     Running   0               28d
pcf               grafana-dashboard-cdl-pcf-764ccc76f9-l29jd                    1/1     Running   0               16d
pcf               grafana-dashboard-etcd-pcf-77664d6867-27fvb                   1/1     Running   0               16d
pcf               grafana-dashboard-pcf-748fb659bd-9sfqj                        1/1     Running   0               16d
Luser@rid8043277-aellendu-1-master1:~$ 

NOTE: The above Grafana pods logs user logging details.

Sample Logs:
-->If Grafana ingress is opened in browser:

logger=context userId=0 orgId=0 uname= t=2025-10-24T11:10:29.611429757Z level=info msg="Request Completed" method=GET path=/ status=302 remote_addr=10.1.14.204 time_ms=0 duration=479.628µs size=29 referer= handler=/ status_source=server

-->If logged in with admin credentials

logger=context userId=2 orgId=1 uname=admin t=2025-10-24T11:13:54.213746926Z level=info msg="Request Completed" method=GET path=/api/live/ws status=-1 remote_addr=11.11.76.195 time_ms=20 duration=20.484741ms size=0 referer= handler=/api/live/ws status_source=server

-->If admin user logout is performed

logger=http.server t=2025-10-24T11:15:39.54041156Z level=info msg="Successful Logout" userID=2
logger=context userId=2 orgId=1 uname=admin t=2025-10-24T11:15:39.540592971Z level=info msg="Request Completed" method=GET path=/logout status=302 remote_addr=11.11.76.195 time_ms=53 duration=53.590989ms size=29 referer="https://grafana.10.86.70.223.nip.io/?orgId=1" handler=/logout status_source=server

Enhanced MongoDB pod log for debugging

Feature history

Feature Name

Release Information

Description

Enhanced MongoDB pod logging for debugging

2026.01.0

This feature enhances MongoDB pod logging within the Cisco Policy Controller (CPC) application to address insufficient log retention, excessive disk consumption, and inefficient debugging in production environments. It manages local pod logs with rotation, and forwards logs to external servers for centralized analysis and long-term archival. This approach significantly improves troubleshooting capabilities and overall observability for operational teams.

This feature enhances MongoDB pod logging within the CPC application. It resolves critical issues caused by insufficient log retention in production environments. In the current setup, logs are only available for a few hours, which is inadequate for effective debugging and root cause analysis. This enhancement addresses three key problems: excessive disk space consumption caused by unmanaged logs, debugging inefficiency due to limited log data, and the lack of robust centralized observability needed for comprehensive analysis and archival.

How MongoDB log forwarding works

MongoDB manages logs through both local log management and external forwarding:

  • Local pod log management and on-node access

    • MongoDB application logs are generated and managed locally within each pod's filesystem, which helps prevent logs from consuming excessive disk space within the pod.

    • Systemd Journald collects all logs generated by pods on a Kubernetes node and acts as an intermediate storage layer on the node.

    • Systemd Journald is configured to allocate a portion of the node's disk space for log storage, allowing for a significantly longer retention period typically 2 to 3 days of log history on the node, depending on disk size and log volume.

    • On-node storage is crucial for immediate debugging. It allows operational teams to access logs directly on the affected node without relying solely on external systems.

  • External log forwarding for centralized analysis

    • Once Systemd Journald collects logs, they are reliably and efficiently transferred to external log servers. This process integrates with the existing CEE log forwarding infrastructure.

    • Logs are distributed to several external logging destinations, including platforms such as Splunk, Fluentd, and syslog. This enables long-term archival, advanced analytics, and centralized monitoring across the entire environment.

    • Log forwarding supports various transport protocols for secure transmission.

Accessing MongoDB logs

MongoDB logs can be accessed by using two methods:

  • On-node debugging: Retrieve logs directly from the Kubernetes node where your MongoDB pod is running.

    • Use crictl to list all containers and filter for the MongoDB pod.

      sudo crictl ps -a | grep "mongo "
    • Use journalctl to retrieve logs for the specific container.

      sudo journalctl UNIT=cri CONTAINER_ID=<trimmed_container_id> --directory=/var/log/journal --output=short-iso-precise

      Note


      When using journalctl, the logs include additional metadata, such as the node name and the container ID. This provides more context compared to raw pod logs.


  • Centralized log analysis: For long-term archival, advanced searching, and correlation across multiple services, forward logs to external systems.

    • Centralized logging platforms such as Splunk, Fluentd dashboards, or syslog servers provide powerful capabilities for search, filtering, visualization, and alerting.

    • For more information about forwarding logs to external systems, see the section Log forwarding to external servers.

Known limitations
  • Variable log retention: The duration that logs are retained on a node (for example, 2 to 3 days) depends on the volume of logs generated by the applications and the total disk space that Journald can use. A high volume of traffic or verbose logging reduces the retention period.

  • No user interface changes: This feature involves backend logging infrastructure enhancements. The application does not introduce new user interface elements, dashboards, or configuration options.

Supplementary log forwarding for cnAAA

Feature history

Feature Name

Release Information

Description

Supplementary log forwarding for cnAAA

2026.01.0

The cnAAA feature automates log forwarding for critical logs. It identifies these logs, collects them, formats the entries, and transfers them securely to a remote server using scheduled cron jobs and password-less SSH.

This feature introduces an automated and secure log forwarding mechanism for the consolidated-aaa-logging pod to ensure complete log collection. It addresses instances where primary log forwarding methods, such as Fluent Bit or syslog, might miss critical engine or audit logs. The system transfers all consolidated log files (consolidated-engine-*, consolidated-api-*, consolidated-app-*) to a designated remote server using scheduled cron jobs and passwordless SSH key-based authentication. This provides essential data for troubleshooting and compliance.

Log forwarding mechanism

The log forwarding mechanism uses the log-copy-startup.sh script that performs these actions:

  • Log identification: Scans the configured source directory within the AAA logging pod for .log and .log.gz files.

  • Log transfer: The script uses a transfer cache to identify and securely transfer only new or modified logs to a specified remote log server, preventing duplicate transfers.

  • Passwordless authentication: The system automatically generates an RSA SSH key pair (/home/appuser/.ssh/id_rsa).


    Note


    To enable secure, passwordless SCP transfers, manually copy the public key to the destination server during the first execution.


  • Automation: The transfer process can be fully automated using scheduled cron jobs, enabling transfers at defined intervals.

  • Error handling: Manages errors during staging and transfer and logs them for troubleshooting.

  • Operational logging: Logs all scheduled and manual executions to data/consolidated-aaa-logging/external-scp-copy.log. This file automatically rotates to maintain a size under 10 MB by retaining the last 1000 lines.

(Optional) Cron job automation

Automated transfers are disabled by default. Use these parameters to enable and schedule transfers:

  • enable-cronjob {true | false: By default, this automation is disabled. To enable it, set the enable_cronjob parameter in the Ops-Center CLI.


    Note


    It is recommended to configure an explicit schedule when enabling the cron job. If you set enable-cronjob to true without defining cron-schedule values, the log copy operation runs every minute.


  • cron-schedule minute: Specifies the hour field for the cron schedule. The range is 0 to 23. For example, use 2 for 2 AM.

  • cron-schedule day-of-month : Specifies the day of the month for the cron schedule. The range is 1 to 31.

  • cron-schedule month: Specifies the month for the cron schedule. The range is 1 to 12.

  • cron-schedule day-of-week: Specifies the day of the week for the cron schedule. The range is 0 to 6, where 0 is Sunday.

Configure log forwarding mechanism in Ops-Center

Before you begin

Complete these manual steps on the destination server before the log forwarding mechanism can function.

  1. Configure the SSH port on the destination server:

    1. Edit the SSH daemon configuration file:

      sudo vi /etc/ssh/sshd_config
    2. Add or modify the Port directive (e.g., Port 2222).

    3. Restart the SSH service:

      sudo systemctl restart sshd
  2. Copy the public SSH key generated by the log-copy-startup.sh script to the authorized_keys file on the destination server. This enables password-less transfers. This is a one-time setup.

    1. The script generates the key pair at /home/appuser/.ssh/id_rsa (private) and /home/appuser/.ssh/id_rsa.pub (public).

    2. Use the ssh-copy-id command from the AAA logging pod to copy the public key:

      sudo ssh-copy-id -i /home/appuser/.ssh/id_rsa.pub -p <DEST_PORT> <DEST_USER>@<DEST_HOST>
      kubectl exec -it consolidated-aaa-logging-0 -n <CPC-NAMEPSACE> -- bash
    3. The script displays setup instructions in the external-scp-copy.log file when it generates a new key. The key persists across pod restarts because the system stores it in a PVC.

If you use a port other than the default port 22, ensure that the port is open on the destination server.

Follow these steps to configure the log forwarding mechanism:

Procedure


Step 1

Log in to the cnAAA Ops-Center and enter the config command.

Step 2

Set the destination server details.

  • Set the destination IP address .

    debug logging external-scp-server dest-ip <dest-ip>
  • Set the directory path on the remote server where logs will be stored.

    debug logging external-scp-server dest-path <dest-path-on-remote-server>
  • Set the destination port of the remote server.

    debug logging external-scp-server dest-port <port>
  • Set the destination user-name.

    debug logging external-scp-server dest-username <username>

Step 3

Define the source log directory and SSH key.

  • Set the local directory path on the cnAAA node that contains the logs to transfer.

    debug logging external-scp-server source-directory <source-path-of-logs>

Step 4

Enable or disable the automated scheduled execution of log transfers. It is disabled by default.

To enable

debug logging external-scp-server enable-cronjob true

To disable

debug logging external-scp-server enable-cronjob false

If enabled, define the cron expression to schedule the log transfer frequency.

debug logging external-scp-server cron-schedule minute <minute>
debug logging external-scp-server cron-schedule hour <hour>
debug logging external-scp-server cron-schedule day-of-month <day-of-month>
debug logging external-scp-server cron-schedule month <month>
debug logging external-scp-server cron-schedule day-of-week <day-of-week>

Step 5

Commit the changes to apply the configuration.

commit

Step 6

Verify the log forwarding configuration.

show running-config debug logging external-scp-server

Configurations without a cron job.

pcf(config)# debug logging external-scp-server dest-ip 192.168.1.100
pcf(config)# debug logging external-scp-server dest-port 22
pcf(config)# debug logging external-scp-server dest-username scpuser
pcf(config)# debug logging external-scp-server dest-path /remote/logs
pcf(config)# debug logging external-scp-server source-directory /var/logs/local
pcf(config)# debug logging external-scp-server enable-cronjob false

Configuration for every 2 minutes: This schedules transfers every 2 minutes.

pcf(config)# debug logging external-scp-server dest-ip 10.84.117.121
pcf(config)# debug logging external-scp-server dest-port 2222
pcf(config)# debug logging external-scp-server dest-username root
pcf(config)# debug logging external-scp-server dest-path /root/
pcf(config)# debug logging external-scp-server source-directory /data/consolidated-aaa-logging/
pcf(config)# debug logging external-scp-server enable-cronjob true
pcf(config)# debug logging external-scp-server cron-schedule minute */2

Configurable log size and PVC for consolidated logs

Feature history

Feature Name

Release Information

Description

Configurable size, index and PVC for logs

2026.01.0

This cnAAA feature provides flexible log management for consolidated-aaa-logging-0 pods. Administrators can use the Ops-Center CLI to configure log size, index, duration, and Persistent Volume Claim (PVC) storage. This CLI configuration provides a better control over disk usage and rotation for OCS, BNG, and audit logs, with settings persisting across system restarts.

This feature allows you to configure log size, and uses a persistent volume claim (PVC) to store logs within the cnAAA environment. The consolidated-aaa-logging-0 pod can manage log rotation and disk usage flexibly. The solution introduces configuration through the CLI in the Ops-Center. Administrators can adjust logging parameters such as log retention policies, and allocate storage according to specific requirements, log volume, and compliance needs.

Key configurable parameters These settings configure log rotation parameters for three log categories: ocs-log, bng-log, audit-logapi-log, engine-log, and app-log.

Reports

  • OCS RADIUS traffic (managed by ocs-log configuration):

    • ocs_consolidated-retryandsuccess.csv

    • ocs_consolidated-retryandfailure.csv

    • pmz_consolidated-retryandsuccess.csv

    • pmz_consolidated-retryandfailure.csv

  • BNG BackOffRetry CoA Failure traffic (managed by bng-log configuration):

    • coaBackOffFailureReport.csv

Logs

  • API (unified request and response logs for CRUD operations):

    • consolidated-api.log

  • APP (for the Radius EP and Engine pod logs):

    • consolidated-app.log

  • Engine (provides detailed information of each RADIUS transaction):

    • consolidated-engine.log

  • Audit (managed by audit-log configuration):

    • bng-device-audit.log

    • qns-custrefdata_audit.log

    • qns-audit-pb.log

    • qns-audit.log

    • qns-pb-publish-svn-diff.log

    • policybuilder.log

Total storage volume (storage-size): configurable for the PVC used by the consolidated-aaa-logging pod.

You can configure these options for BNG, OCS, and Audit logs:

  • max-index: the maximum number of rotated log files to retain.

  • max-file-size: the maximum size of a single log file before rotation.

You can configure below options for API, app and engine logs:

  • maxfilesize: the maximum size allowed for each individual log file (in MB).

  • maxhistory: how long logs are retained before deletion (in minutes or hours).

  • totalcapsize: the total storage allocated for each log type (in GB).


Note


All configured settings (max-index, maxhistory, totalcapsize, max-file-size, and storage-size) persist across pod restarts, node reboots, and cnAAA upgrades, ensuring consistent log management.


Log sizing configuration

Configure log sizing through the Ops-Center provides granular control over storage volume and retention periods for various service logs to prevent disk overflow.

[beta/beta-cncps] pcf(config)# debug logging sizing [log-type/storage-size]

Note


Supported log-type: api-log, app-log, audit-log, bng-log, engine-log, ocs-log.


Table 3. Service logs (API, application, engine)
Log type Parameter Range Default Unit
api-log maxfilesize 10 - 300 200 MB
maxhistory 1 - 72 72 Hours
totalcapsize 1 - 1000 300 GB
engine-log maxfilesize 10 - 300 200 MB
maxhistory 1 - 4320 4320 Minutes
totalcapsize 1 - 1000 300 GB
app-log maxfilesize 10 - 300 200 MB
maxhistory 1 - 4320 4320 Minutes
totalcapsize 1 - 1000 500 GB
Table 4. Infrastructure and compliance logs (Audit, BNG, OCS)

Log type

Parameter

Range

Default

Unit

audit-log max-file-size 10 - 300 200 MB
max-index 15 - 21 15 NA
bng-log max-file-size 10 - 300 200 MB
max-index 15 - 21 15 NA
ocs-log max-file-size 10 - 300 200 MB
max-index 15 - 21 15 NA
Table 5. Global storage
Parameter Range Default Unit
storage-size 3 - 1000 3 GB

Operational behavior and verification

  • Engine and application logs: Rotate every minute (consolidated-engine.YYYY-MM-DD-Hours-Minutes.0.log.gz).

  • API Logs: Rotate hourly (consolidated-api.YYYY-MM-DD-Hours.0.log.gz).

Configure log management parameters in Ops-Center

Before you begin

  • Shutdown the system to configure the storage-size parameter.

Procedure


Step 1

Log in to the Ops-Center and enter config command.

config

Step 2

Configure total storage volume to determine the overall disk space allocated for logs.

debug logging sizing storage-size <value_in_GB>

Caution


Configure the storage-size parameter only when the system is in a shutdown state. Once configured, the size cannot be reduced. It can only be increased. The default and minimum value is 3 GB.

Step 3

Configure OCS RADIUS traffic log parameters to control log rotation.

  • Configure the max-index value to specify the maximum number of rotated log files to retain.

    debug logging sizing ocs-log max-index <value>
  • Configure the max-file-size value to specify the maximum size of a single log file before rotation.

    debug logging sizing ocs-log max-file-size <value_in_MB>
    

Step 4

Configure BNG RADIUS traffic log parameters to control log rotation.

  • Configure the max-index value to specify the maximum number of rotated log files to retain.

    debug logging sizing bng-log max-index <value>
  • Configure max-file-size value to specify the maximum size of a single log file before rotation.

    debug logging sizing bng-log max-file-size <value_in_MB>

Step 5

Configure audit-log parameters to control log rotation for audit-related logs.

  • Configure the max-index value to specify the maximum number of rotated log files to retain.

    debug logging sizing audit-log max-index <value>
  • Configure the max-file-size value to specify the maximum size of a single log file before rotation.

    debug logging sizing audit-log max-file-size <value_in_MB>

Step 6

Configure api-log parameters to control log rotation for api-related logs.

  • Configure the maxfilesize value to specify the maximum size of the log file before rotation.

    debug logging sizing api-log maxfilesize <value_in_MB>
  • Configure the maxhistoryvalue to specify the maximum retention period for logs.

    debug logging sizing api-log maxhistory <value>
  • Configure the totalcapsize value to specify the total storage cap for API logs.

    debug logging sizing api-log totalcapsize <value_in_GB>

Step 7

Configure app-log parameters to control log rotation for app-related logs.

  • Configure the maxfilesize value to specify the maximum file size before rotation .

    debug logging sizing app-log maxfilesize <value_in_MB>
  • Configure the maxhistory value to specify the maximum retention period for logs.

    debug logging sizing app-log maxhistory <value>
  • Configure the totalcapsize value to specify the total storage cap for application logs.

    debug logging sizing app-log totalcapsize <value_in_GB>

Step 8

Configure engine-log parameters to control log rotation for app-related logs.

  • Configure the maxfilesize value to specify the maximum file size before rotation.

    debug logging sizing engine-log maxfilesize <value_in_MB>
  • Configure the maxhistory value to specify the maximum retention period for logs.

    debug logging sizing engine-log maxhistory <value>
  • Configure the totalcapsize value to specify the total storage cap for application logs.

    debug logging sizing engine-log totalcapsize <value_in_GB>

Step 9

commit the changes and verify the current configurations by using the show running-config command.

show running-config debug logging sizing


Caution


Ensure that the combined totalcapsize of the engine, API, and app logs does not exceed the configured storage-size.


Note


  • The recommended maxhistory for API logs is 24 hours and for app, engine logs it is 1440 minutes. The recommended maxfilesize is 300 MB for all log types.

  • The system may store data beyond the configured maxhistory period if the totalcapsize for that log type is not reached.


Example:


debug logging sizing storage-size 200
debug logging sizing ocs-log max-index 20
debug logging sizing ocs-log max-file-size 250
debug logging sizing bng-log max-index 20
debug logging sizing bng-log max-file-size 250
debug logging sizing audit-log max-index 20
debug logging sizing audit-log max-file-size 250
debug logging sizing api-log maxfilesize 250
debug logging sizing api-log maxhistory 48
debug logging sizing api-log totalcapsize 300
debug logging sizing app-log maxfilesize 250
debug logging sizing app-log maxhistory 2880
debug logging sizing app-log totalcapsize 500
debug logging sizing engine-log maxfilesize 250
debug logging sizing engine-log maxhistory 2880
debug logging sizing engine-log totalcapsize 300

Log forwarding to external servers

Feature History

Feature Name

Release Information

Description

Log forwarding to external servers

2026.01.0

This feature forwards pod and application logs to external Syslog, Splunk, and Fluentd servers by using CEE and CPC Ops-Center configurations. It supports IPv4 and IPv6 addresses to provide centralized log management and resolve multi-line rendering issues.

It forwards audit logs to an external syslog server.

The Log Forwarding feature allows CPC to export pod logs (application and MongoDB logs) to external Syslog, Splunk, and Fluentd servers. This feature supports both IPv4 and IPv6 addressing to accommodate diverse customer network environments. It also forwards audit log to the external syslog server.

The system uses two management interfaces for log forwarding:

  • CEE Ops-Center forwards general logs to Syslog, Splunk, and Fluentd.

  • The CPC Ops-Center forwards application logs to Splunk, which helps resolve multi-line logging issues.

Configure log forwarding in the CEE and CPC Ops-Centers

Before you begin

  • Configure reachability alerts before setting up the external server. This allows the system to monitoring the connection immediately when it is activated.

    cee(config)# alerts rules group fluentbit.rules rule fluent-proxy-output-retries-failed expression "rate(fluentbit_output_retries_failed_total{pod=~\"fluent-proxy.*\"}[5m]) > 0" duration 5m severity major type "Communications Alarm" annotation description value "Fluent-proxy {{ $labels.namespace }}/{{ $labels.pod }} output retries failed for target: {{ $labels.name }}"
  • Log forwarding is disabled by default. This functionality is enabled only after the configuration is commited.

  • To verify connectivity, check that the external server is reachable using the configured IPv4 or IPv6 address.

Procedure


Step 1

Log in to Ops-Center and enter the configuration mode.

config

Step 2

The CEE Ops-Center supports forwarding to three types of external collectors. Configure the collector as per the requirement.

  1. Configure the Syslog configuration details.

    cee(config)# logging syslog host 192.0.2.10 syslog-message-key MESSAGE workers 4 syslog-hostname-key _HOSTNAME syslog-appname-key CONTAINER_NAME
  2. Configure the Splunk configuration details.

    cee(config)# logging splunk host 192.0.2.10 port 8088 auth-token <your_token> disable-tls-verification true
  3. Configure the Fluentd configuration details.

    cee(config)# logging fluent host 192.0.2.10 port 24224 protocol forward enable

Step 3

commit the changes and verify the status.

  • Verify the CEE Syslog

    show running-config logging syslog
  • Verify the CEE Fluentd

    show running-config logging fluent
  • Verify the CEE Splunk

    show running-config logging splunk
  • Verify the CEE alerts

    show running-config alerts rules group fluentbit.rules

Step 4

Use the CPC Ops-Center CLI to resolve multi-line logging issues and ensure application logs forward correctly to Splunk.

  • Configure the Splunk details.

    pcf(config)# debug splunk hec-url https://198.51.100.20:8088 hec-token <your_token>

Step 5

commit the changes and verify the status.

  • Verify the CPC Splunk

    show running-config debug splunk

Note


If application logs are forwarded using CPC Ops-Center, exclude those logs from CEE Ops-Center to prevent duplication or redundancy in logging. For more information refer: https://www.cisco.com/c/en/us/td/docs/wireless/ucc/smi/cee-config-guide/ucc-5g-smi-cee-config-and-admin-guide/m_cisco-smi-cee-logging.html


Sample configuration:

show running-config logging syslog
Fri Oct  10 12:05:26.268 UTC+00:00
logging syslog host <Repo_Server_IP>
logging syslog syslog-hostname-key _HOSTNAME
logging syslog syslog-message-key MESSAGE
logging syslog syslog-appname-key CONTAINER_NAME
logging syslog workers 4
[alpha/alpha] cee#

[beta/beta-cncps-cee] cee# show running-config logging fluent
Fri Jan  23 04:21:43.429 UTC+00:00
logging fluent enable
logging fluent host <Repo_Server_IP>
logging fluent port 24224
logging fluent protocol forward

[beta/beta-cncps-cee] cee# show running-config logging splunk
Fri Jan  23 04:21:38.190 UTC+00:00
logging splunk host      <Repo_Server_IP>
logging splunk port      8088
logging splunk auth-token b847e79b-d45a-450e-8496-5f072dd9d205
logging splunk disable-tls-verification true

[alpha/alpha] cee# show running-config alerts rules group fluentbit.rules
Wed Dec  24 04:31:50.881 UTC+00:00
alerts rules group fluentbit.rules
 rule fluent-proxy-output-retries-failed
  expression "rate(fluentbit_output_retries_failed_total{pod=~\"fluent-proxy.*\"}[5m]) > 0"
  duration   5m
  severity   major
  type       "Communications Alarm"
  annotation description
   value "Fluent-proxy {{ $labels.namespace }}/{{ $labels.pod }} output retries failed for target: {{ $labels.name }}"
  exit
exit
exit

[unknown] pcf# show running-config debug splunk
Fri Jan 23 13:37:44.728 UTC+00:00
debug splunk hec-url https://10.81.68.212:8088
debug splunk hec-token 4e86ba95-615f-48dd-9711-a9a9d0b60487

Known limitations

  • The CPC Ops-Center configuration does not currently support alerts for external server reachability.

  • Enabling log forwarding through CEE Ops-Center deploys fluent-bit worker pod on each node and one fluent-bit proxy pod on one of the master node. This increases CPU and memory utilization.