Perform What-If Analysis

This section contains the following topics:

Failure scenarios

Failure scenarios are simulated events that

  • represent the loss or degradation of specific network elements such as links, nodes, or metrics

  • help planners assess how minor or major changes affect the network’s overall service and congestion, and

  • support decision-making by predicting outcomes when network conditions or topology are intentionally altered or disrupted.

A frequent question in the planning process is how to test the value of a minor change that may prevent the need for a larger one. For instance, instead of a huge upgrade, a planner may consider whether adding a single link between two sites can mitigate congestion in part of the network.

In Cisco Crosswork Planning, you can examine what happens if you change any aspect of the network model. For example:

  • What happens if a link or a node fails?

  • What happens if you change a metric?

  • What happens if you change the topology?

  • What happens if a new customer or service is added?

Perform failure analysis

One of the most useful features of Cisco Crosswork Planning is its ability to show the network behavior when objects fail. For example, your network might show that utilization remains well under 100% under normal operation. However, what happens when a failure occurs?

Cisco Crosswork Planning lets you perform failure analysis, which can be useful in long-term planning and short-term preparation. It simulates rerouting and changes in traffic utilization under individual failure events. For an example of how failure analysis is performed in Cisco Crosswork Planning, refer to Example: Performing failure analysis.

Complete these steps to fail or recover objects.

Procedure


Step 1

To fail a single object, click the > Fail option under the Actions column.

After failing an object, the menu option changes to Recover. Use this option to recover the failed objects.

Step 2

To fail or recover multiple objects:

  1. Select the required objects.

  2. Click More actions > Fail or More actions > Recover to fail or recover objects.

Step 3

Observe how traffic utilization and routing in the network plot change after objects are failed or recovered.


Example: Performing failure analysis

In this example, we determine the effects on the network if a single interface fails.

Procedure


Step 1

Open the plan file (see Open plan files). It opens in the Network Design page.

Step 2

In the network plot (see Network plot before failing the interface), observe that all traffic utilization is under 100%. You can tell this because none of the interfaces are red, which by default indicates over 100% utilization. Also, the Util sim column in the Interfaces table shows no values over 100.

Step 3

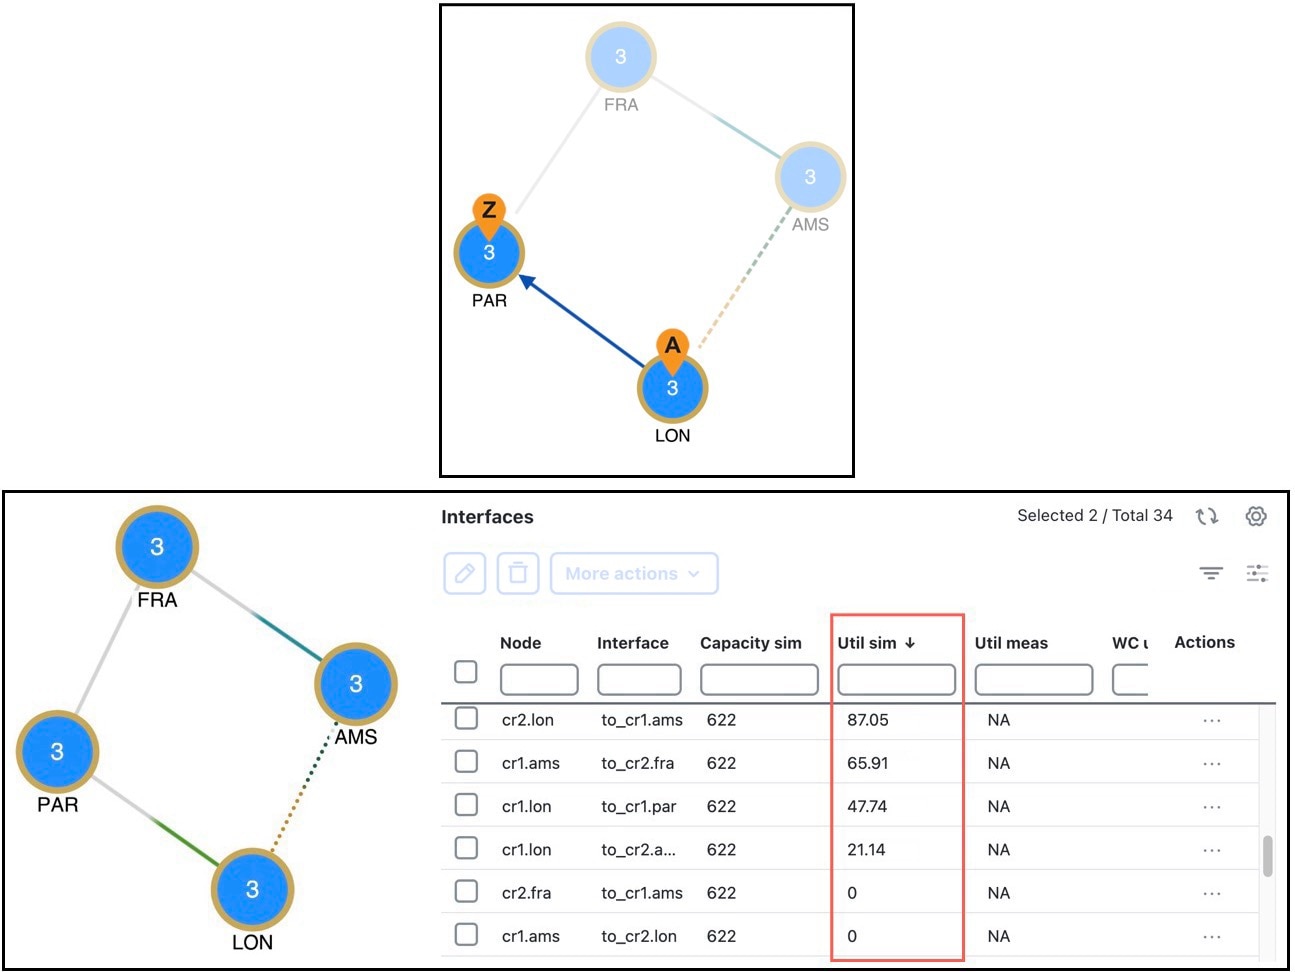
In the Interfaces table, select the cr1.lon-cr1.par interface (LON-PAR circuit) and choose > Filter to demands > Through all interfaces.
Step 4

Click the demand to see its route. The solid violet arrow indicates the demand path.

Figure 1. Network plot before failing the interface
Network plot before failing the interface

Step 5

In the interfaces table, select the cr1.lon-cr1.par interface and choose > Fail option under the Actions column. You can also use More actions > Fail.

Step 6

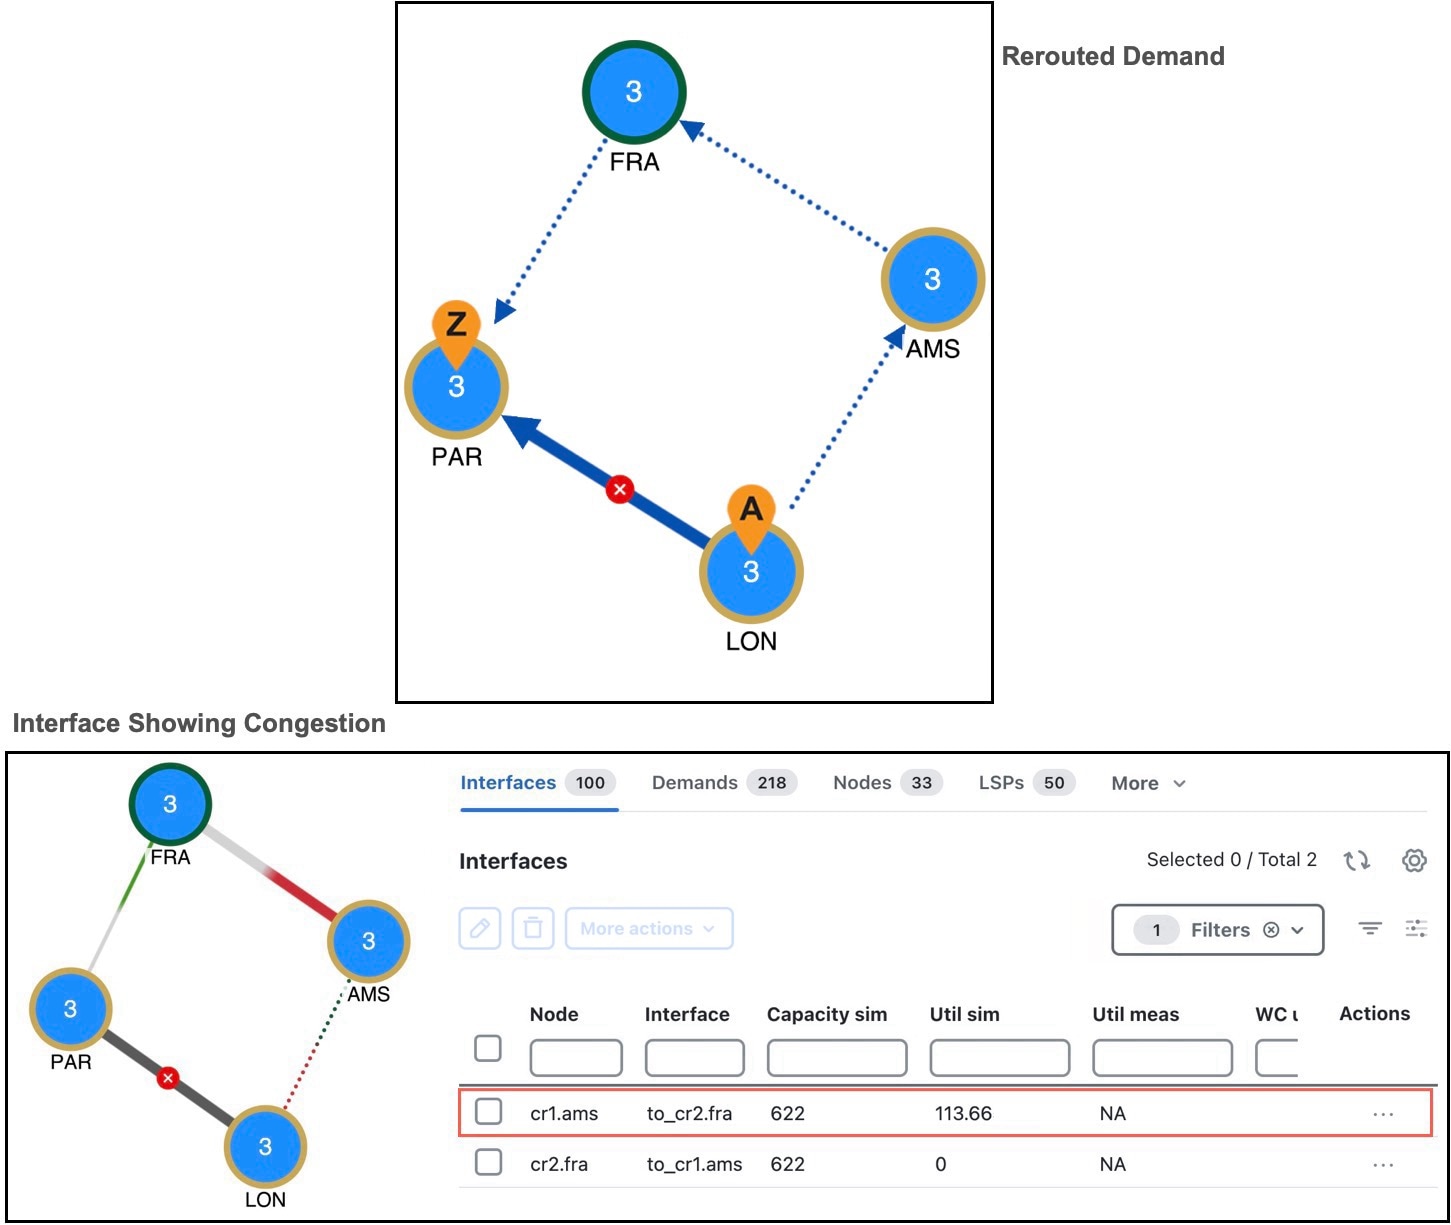
Notice how the demand has been rerouted (see Network plot after failing the interface). The dotted line shows the current demand path under failure.

The red cross on the link indicates a failure.

Step 7

Clear the filter in the Demands table and notice the difference in traffic utilization colors in the plot. For example, the AMS-FRA circuit (cr1.ams-cr2.fra interface) is now congested, as indicated by red color.

Figure 2. Network plot after failing the interface
Network plot after failing the interface

Step 8

To restore the failed circuit/interface, select it and choose > Recover option under the Actions column. You can also use More actions > Recover.


Perform impact analysis of topology changes

Being able to emulate and predict the impact of topology changes promotes Service Level Agreement (SLA) adherence and staff efficiency. Topology changes can affect traffic flows, congestion, and latency. Understanding these effects is valuable for operators, planners, and designers, and is critical for those with penalty clauses in customer SLAs.

Cisco Crosswork Planning lets you edit the network topology so that you can add, edit, and delete objects. Once topology changes are made, demands are rerouted, showing the resulting utilization changes in the new network. For an example of how adding a circuit between two sites can help in relieving the congestion, refer to Example: Performing impact analysis of topology changes.

Example: Performing impact analysis of topology changes

In this example, we see how adding a circuit between two sites ("wdc" and "nyc") helps in relieving the congestion.

Procedure


Step 1

Open the plan file (see Open plan files). It opens in the Network Design page.

Step 2

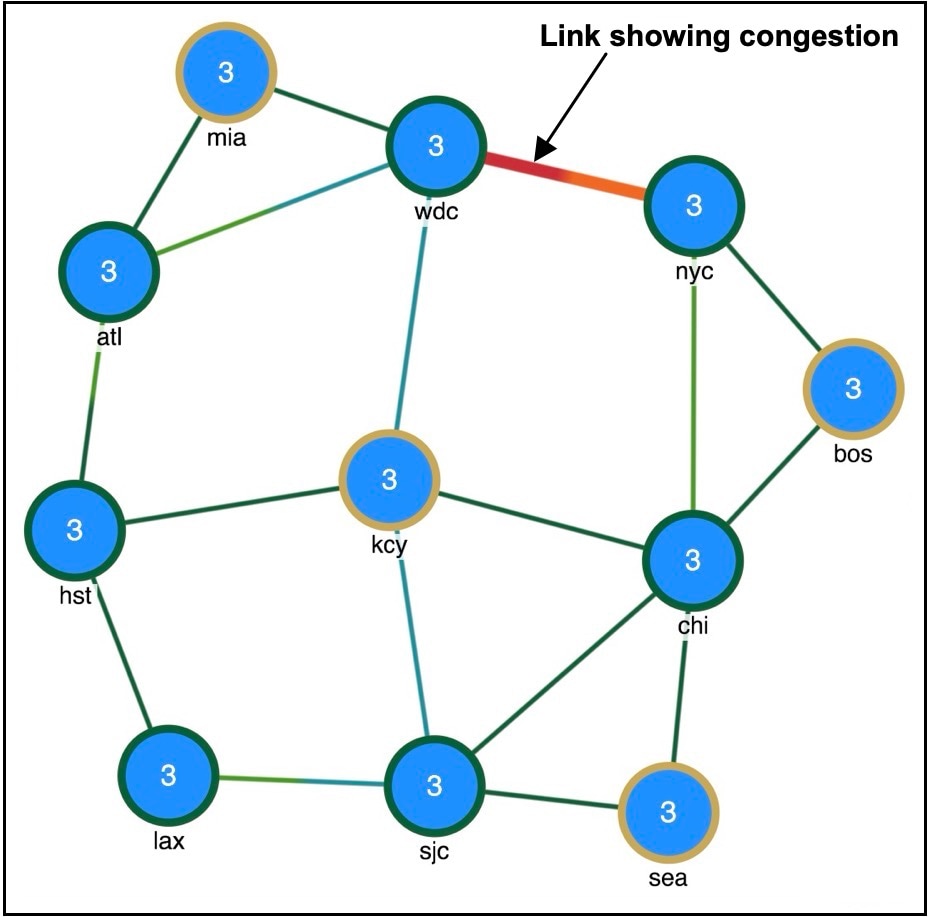
Observe that the link between the sites "wdc" and "nyc" is congested, as indicated by the red interface.

Figure 3. Network plot before adding a circuit
Network plot before adding a circuit

Step 3

Add a circuit between "wdc" and "nyc".

  1. From the toolbar, choose Actions > Insert > Circuit.

    OR

    Go to the Circuits table and click Add icon. If the Circuits tab is not visible, then click the Show/hide tables icon (Show/Hide Tables Icon), select the Circuits check box, and click Apply.
  2. In the Add Circuit page, enter these details:

    • Circuit name: Enter the name of the circuit.

    • Capacity: Enter the amount of total traffic this circuit can carry. The drop-down list includes the most widely used capacities.

    • Interface A and Interface B sections: Specify two interfaces that are connected by the circuit. In this case, for Interface A, choose the interface belonging to the site, "wdc". For Interface B, choose the one belonging to "nyc".

  3. Click Add.

Step 4

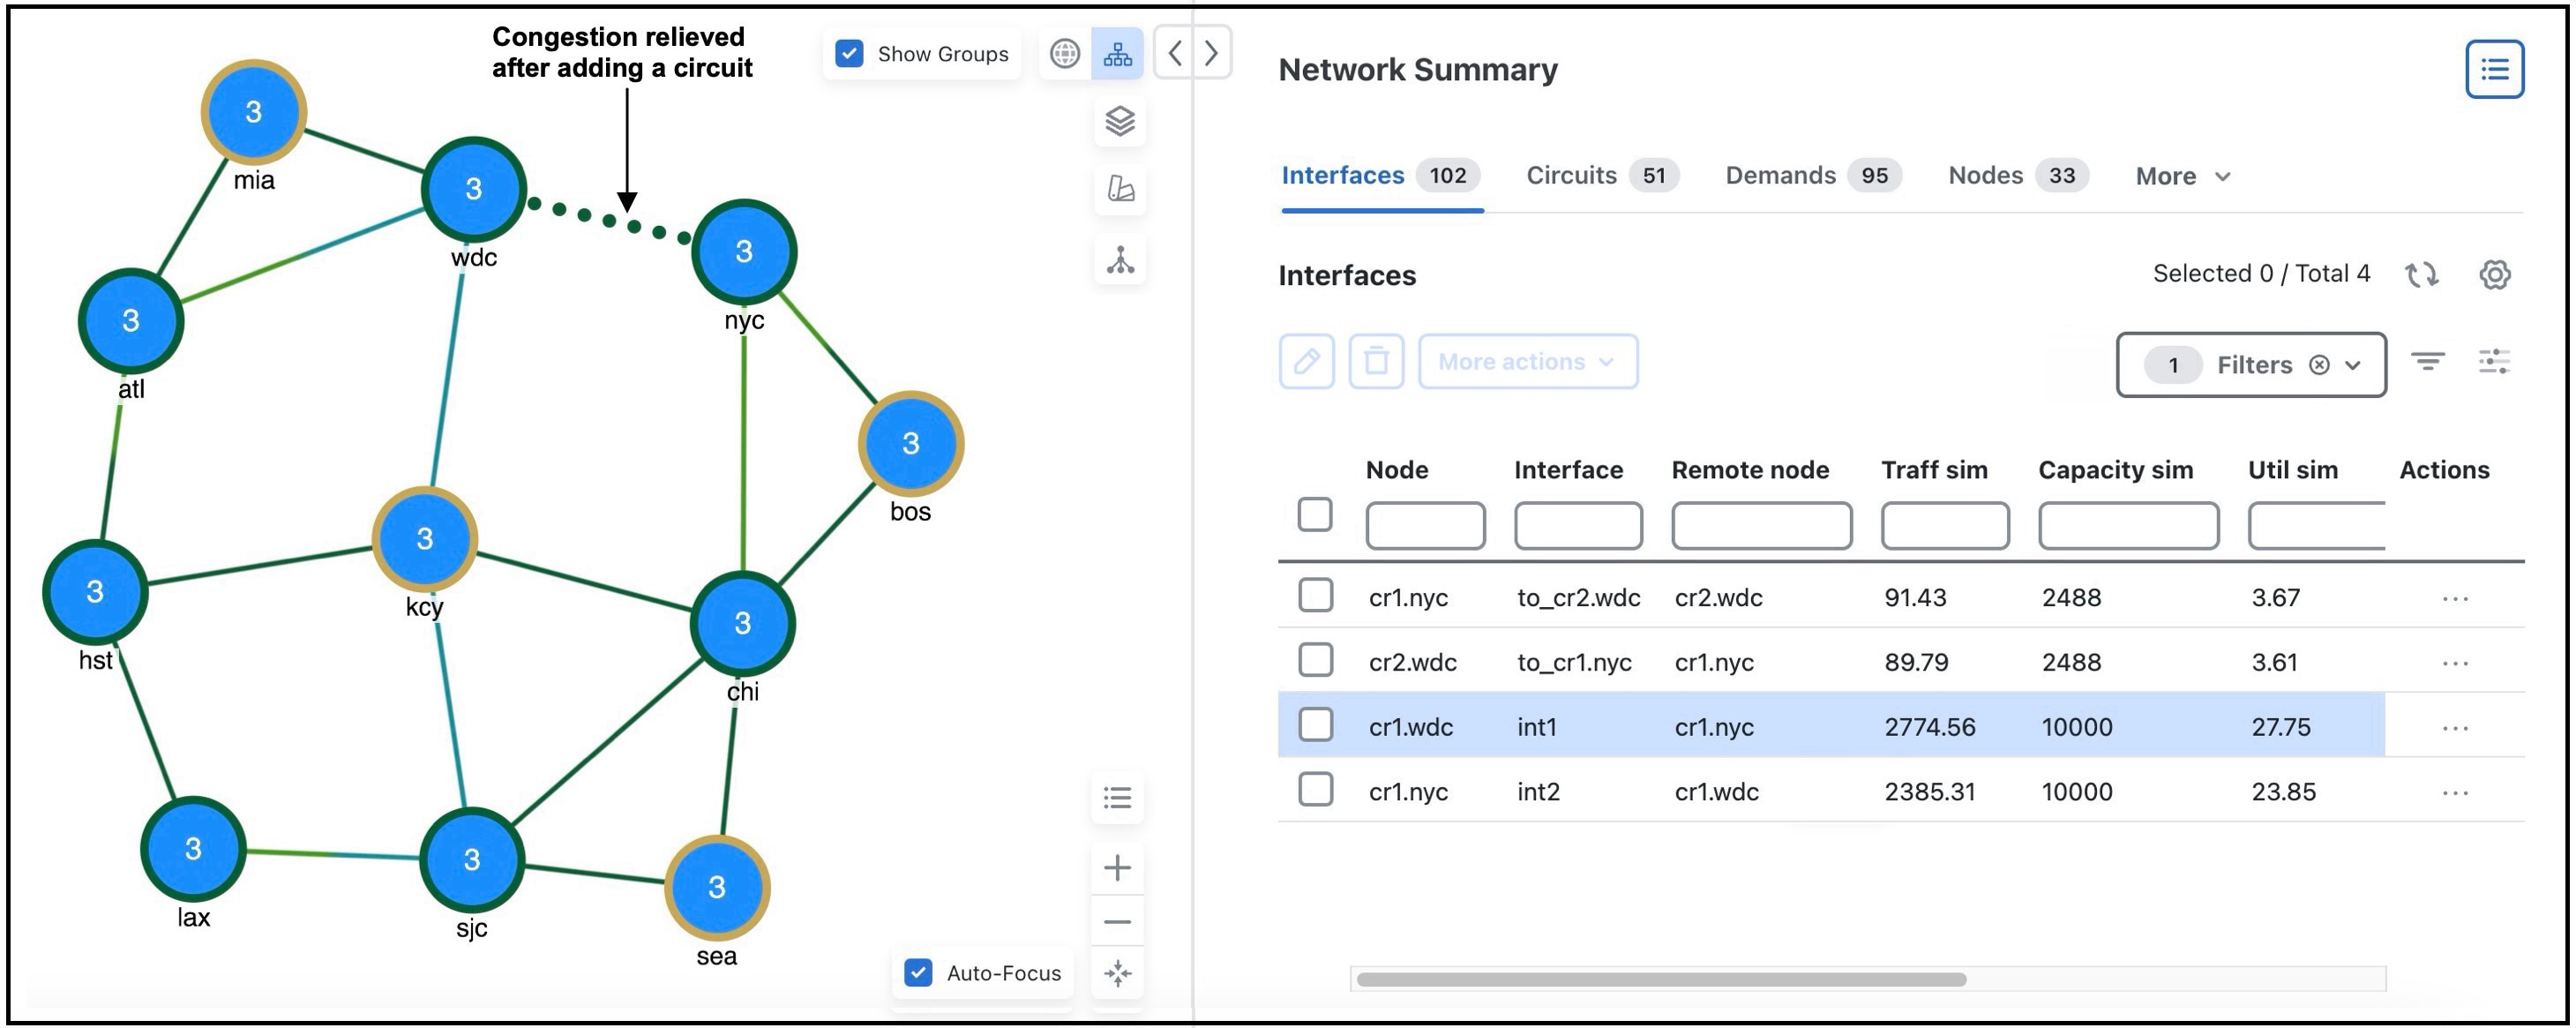
Notice the difference in the traffic utilization color in the link between "wdc" and "nyc". The dark green color indicates that the congestion is relieved. The dotted line indicates the presence of multiple circuits.

Figure 4. Network plot after adding a circuit
Network plot after adding a circuit

If congestion had not been relieved, a larger circuit or different metric could have been analyzed with a simple change to the circuit properties in the UI.

Perform impact analysis of metric changes

Cisco Crosswork Planning lets you update a metric and helps you analyze how it affects the network. For an example of how changing the IGP metric of an interface impacts the utilization, see Example: Impact analysis of metric changes.

To optimize the metric of multiple interfaces, use the Metric optimization and Tactical metric optimization tools. For details, refer to Optimize Metrics in the Network Core.

Example: Impact analysis of metric changes

In this example, we see how changing the IGP metric value of the interfaces (between "kcy" and "hst" sites) changes the traffic utilization.

Procedure


Step 1

Open the plan file (see Open plan files). It opens in the Network Design page.

Step 2

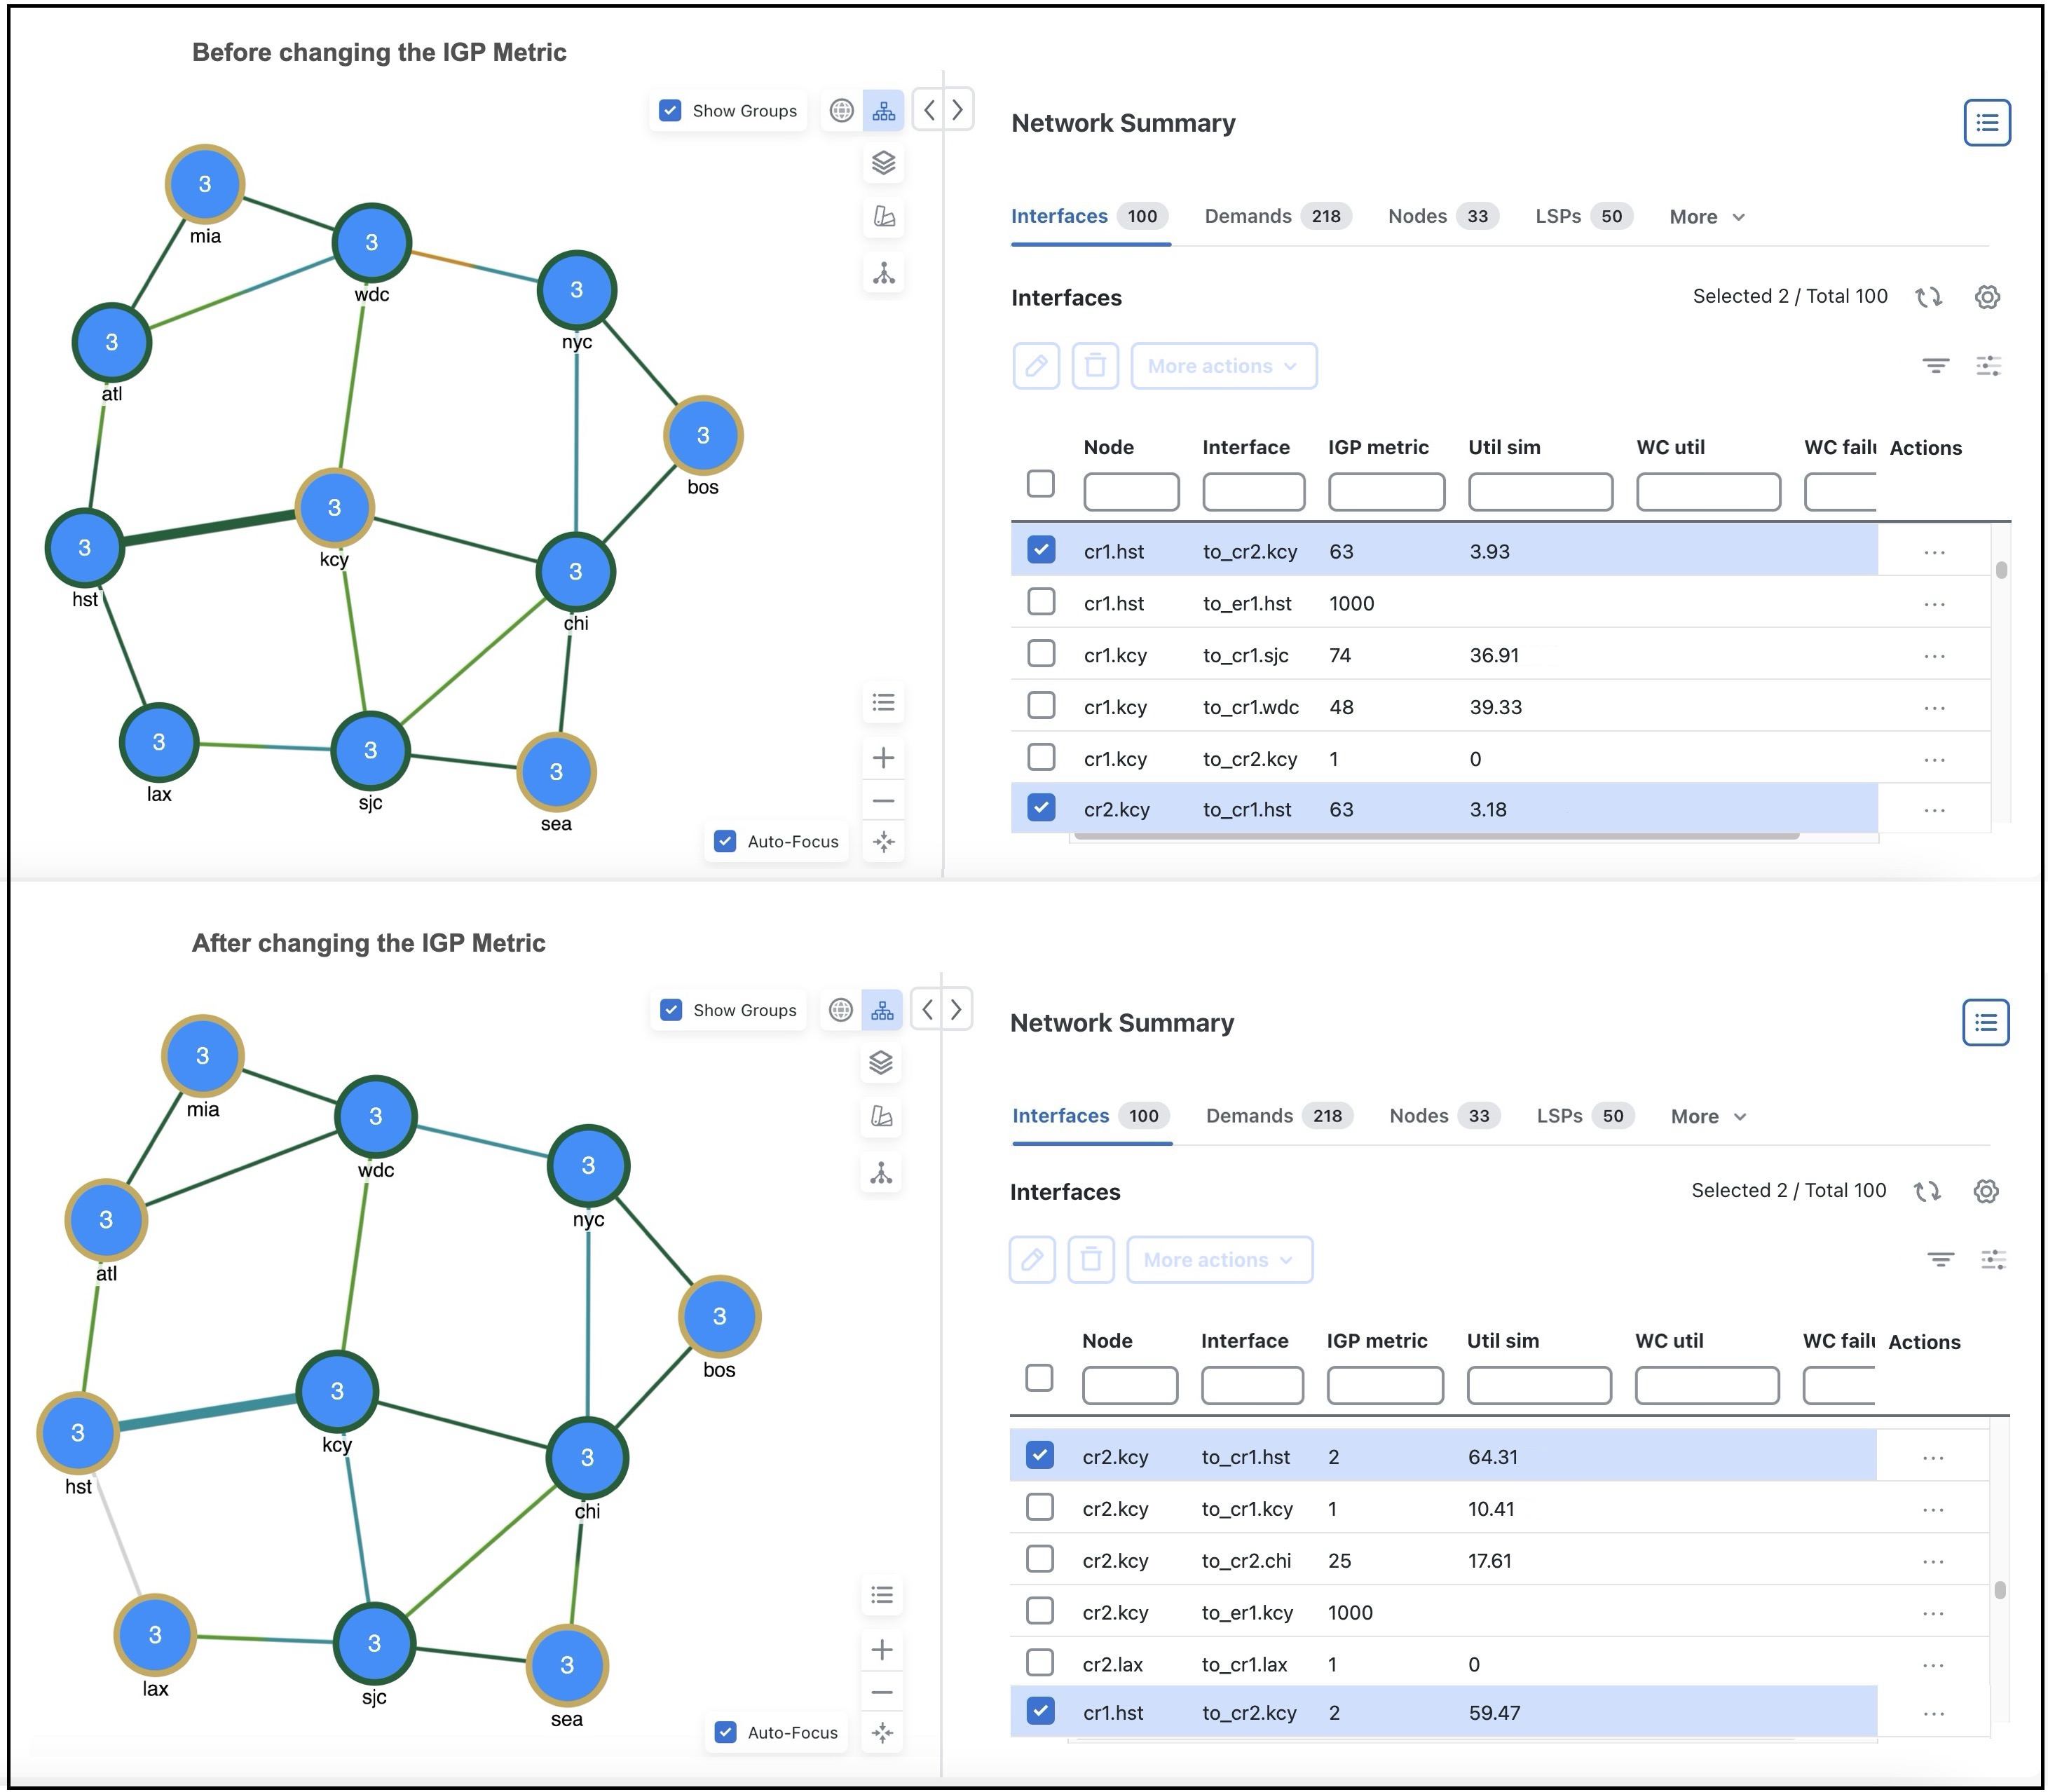
Notice that the color of the link between the sites "kcy" and "hst" is dark green. This color indicates that the traffic utilization is between 0% and 30%.

Figure 5. Impact of changing the IGP metric
Impact of changing the IGP metric

Step 3

Select this link. In the Interfaces table, the interfaces belonging to this circuit are selected.

Step 4

Click Edit icon.

Step 5

In the IGP metric field, change the value from 63 to 2.

Step 6

Notice that the color of the link between "kcy" and "hst" has changed to blue. This change indicates that the traffic utilization on these interfaces has increased.