Evaluate Impact of Worst-Case Failures

Simulation analysis tool

The Simulation analysis tool is a Cisco Crosswork Planning tool that

  • combines the simulation results of a large set of failure scenarios

  • determines how vulnerable a network is to congestion and high latency under different types of failures, and

  • enables you to allocate sufficient network capacity for any given failure scenario.

Simulation analysis is run across a set of failure scenarios that include selected objects, such as circuits, and traffic levels. Cisco Crosswork Planning calculates these failure scenarios across all service classes. Each scenario is simulated and produces several forms of analysis. The analysis depends on the network has QoS parameters and the options selected during simulation.

When the simulation completes, a report page appears showing a summary of each analysis and the simulations performed. This information updates every time you run a new simulation.

You can perform simulation analysis under different simulation convergence modes (Fast reroute, IGP and LSP reconvergence, Autobandwidth convergence, and Autobandwidth convergence (including failures)), depending on which stage of the network recovery after failure is being investigated. The default simulation mode is IGP and LSP reconvergence, and except where identified, the documentation describes this simulation mode.
Worst-case traffic utilization

Worst case traffic utilization is the highest utilization that a particular interface experiences over all the failure sets and traffic levels that you select.

Analysis behavior

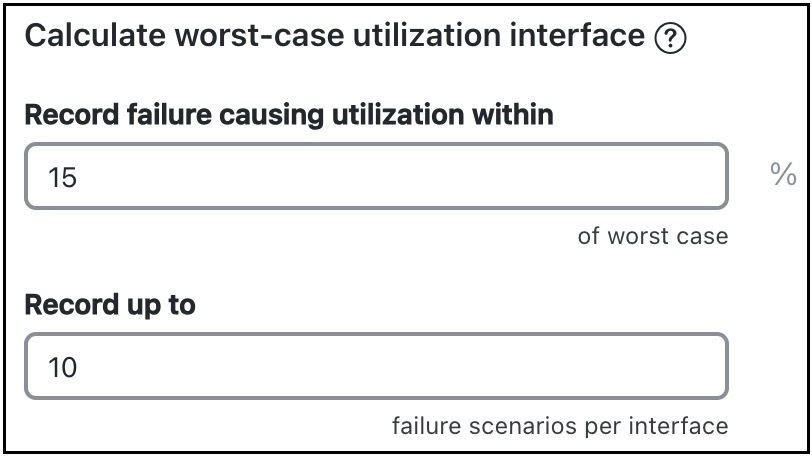
Cisco Crosswork Planning determines which combination of failures would cause this worst-case utilization. The default analysis is to identify up to 10 failures for the worst-case utilization on each interface in the network. Alternatively, you can record failures causing utilizations within a specified percent of the worst-case utilization.

To control the number of threads that Cisco Crosswork Planning processes in parallel when examining failure scenarios, set the Maximum number of threads field. For more information on how to run the simulation analysis, refer to Run simulation analysis.

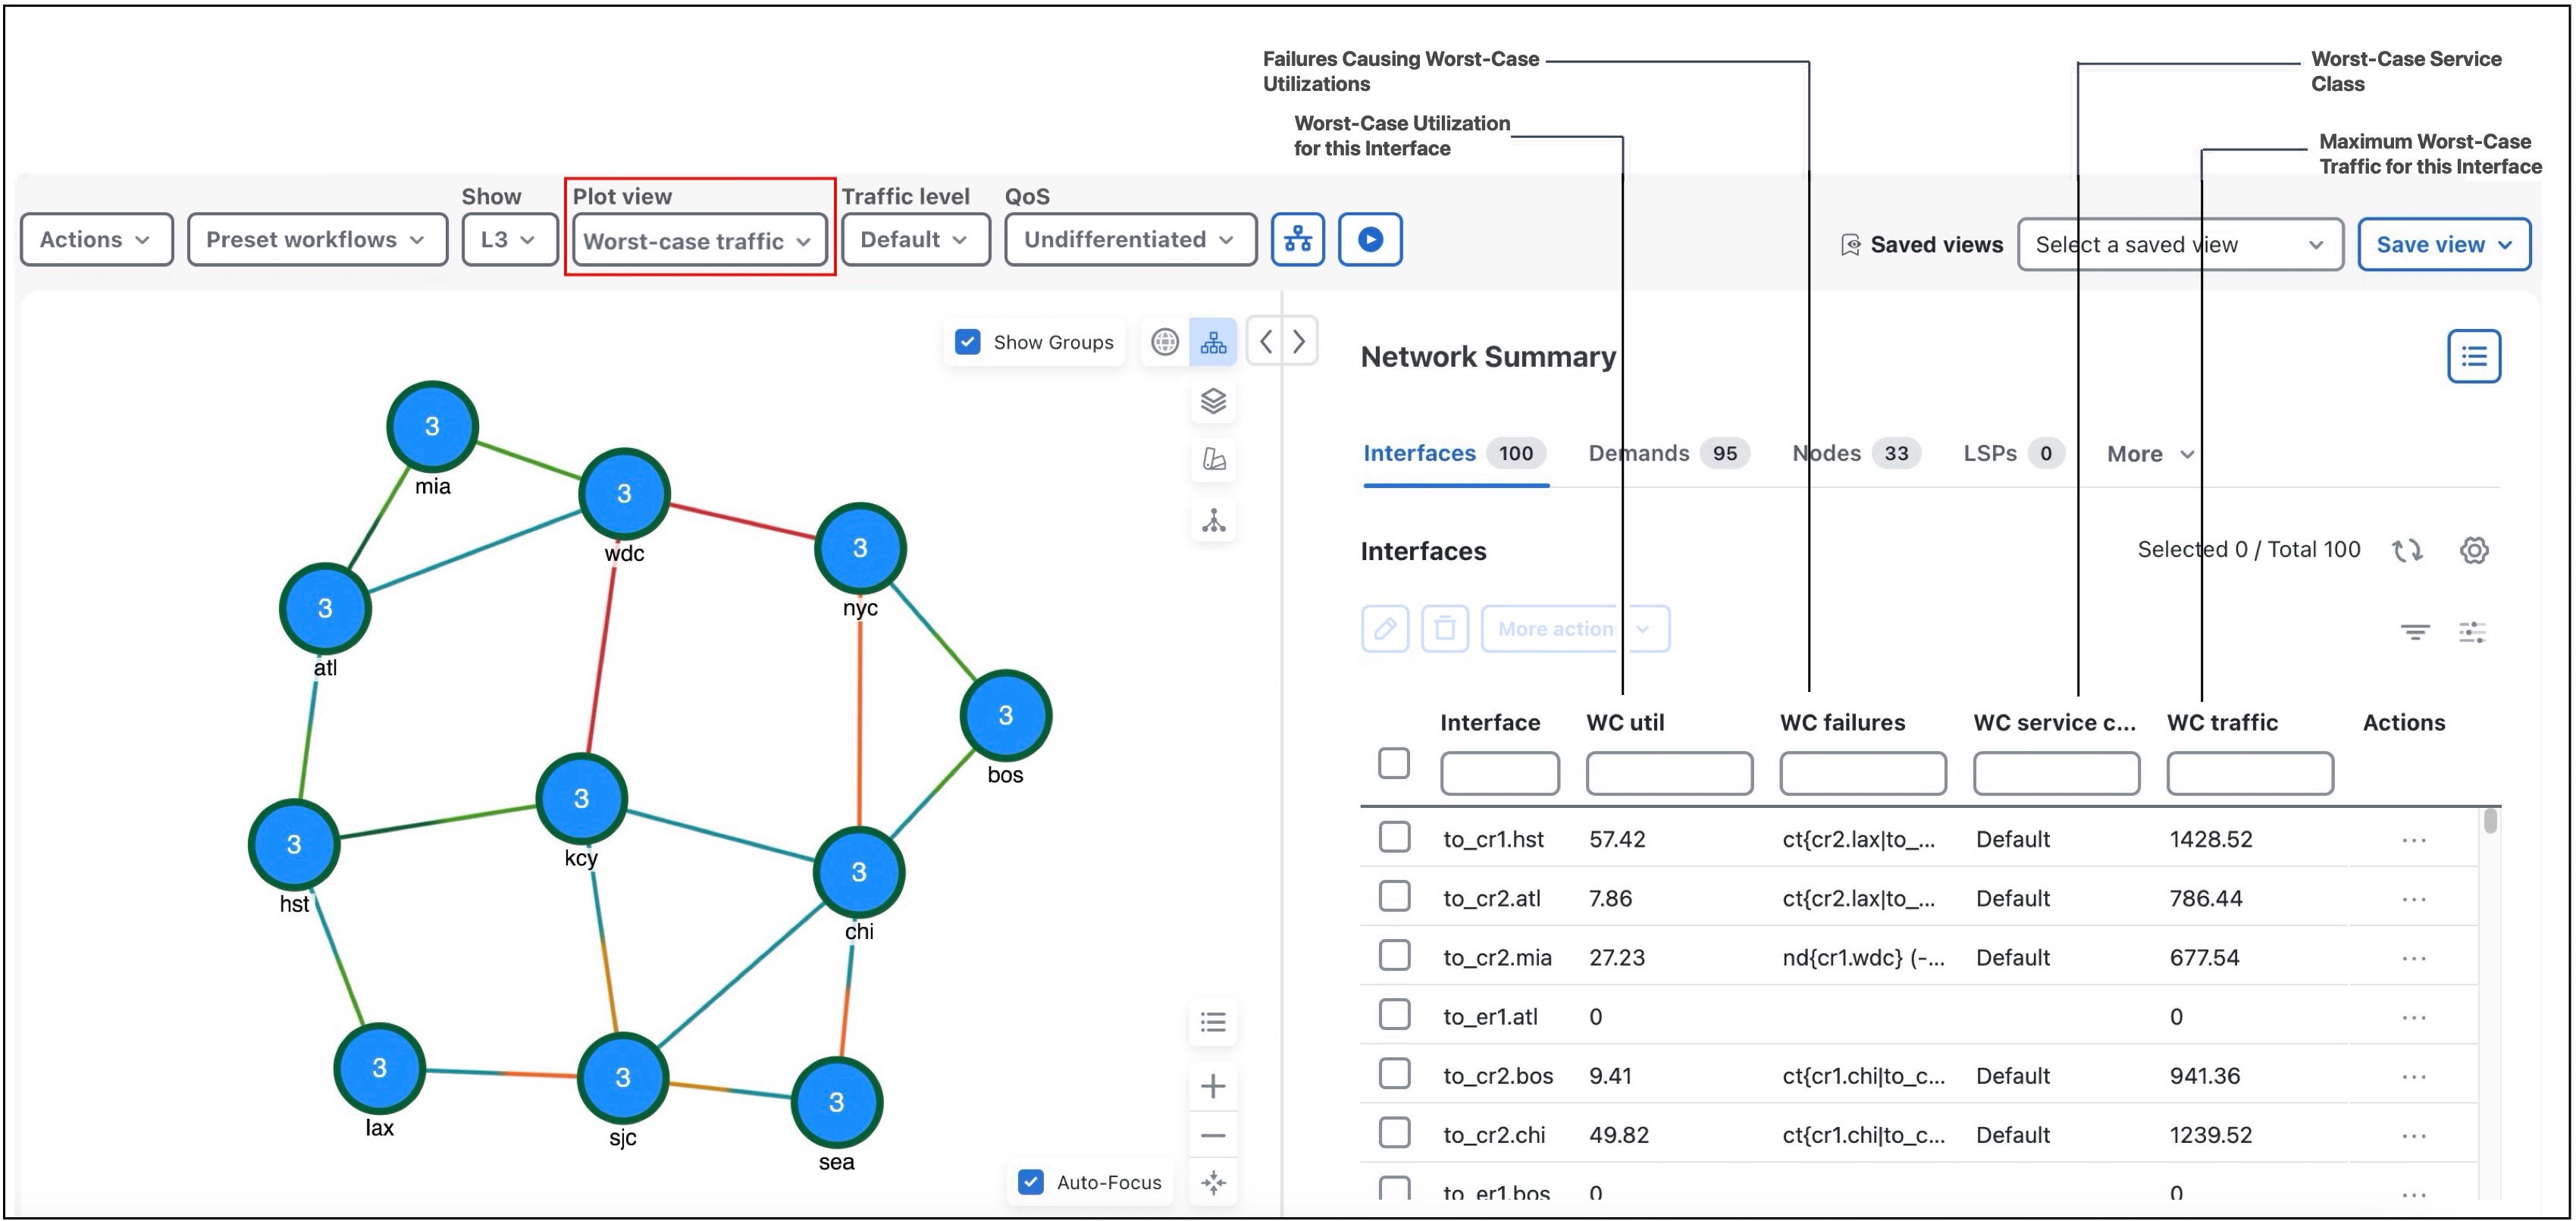
After finishing the analysis, Cisco Crosswork Planning switches to the Worst-Case traffic view and updates the plot to simultaneously display the worst-case utilization for all interfaces.

Figure 1. Worst-case traffic utilization
Worst-case traffic utilization

Updated table columns

In addition to Plot view changes, these columns are also updated in the Interfaces and Circuits tables after the Simulation analysis completes:

  • WC util: The worst-case utilization for that interface. The worst-case for a circuit is defined to be whichever of the worst cases of the two constituent interfaces results in the larger utilization. Thus, for circuits, this value is the larger of the WC util values for the two interfaces in the circuit.

  • WC traffic: The actual traffic (Mbps) through the interface under the worst-case scenario.

  • WC traff level: The traffic level under which this worst-case scenario occurs.

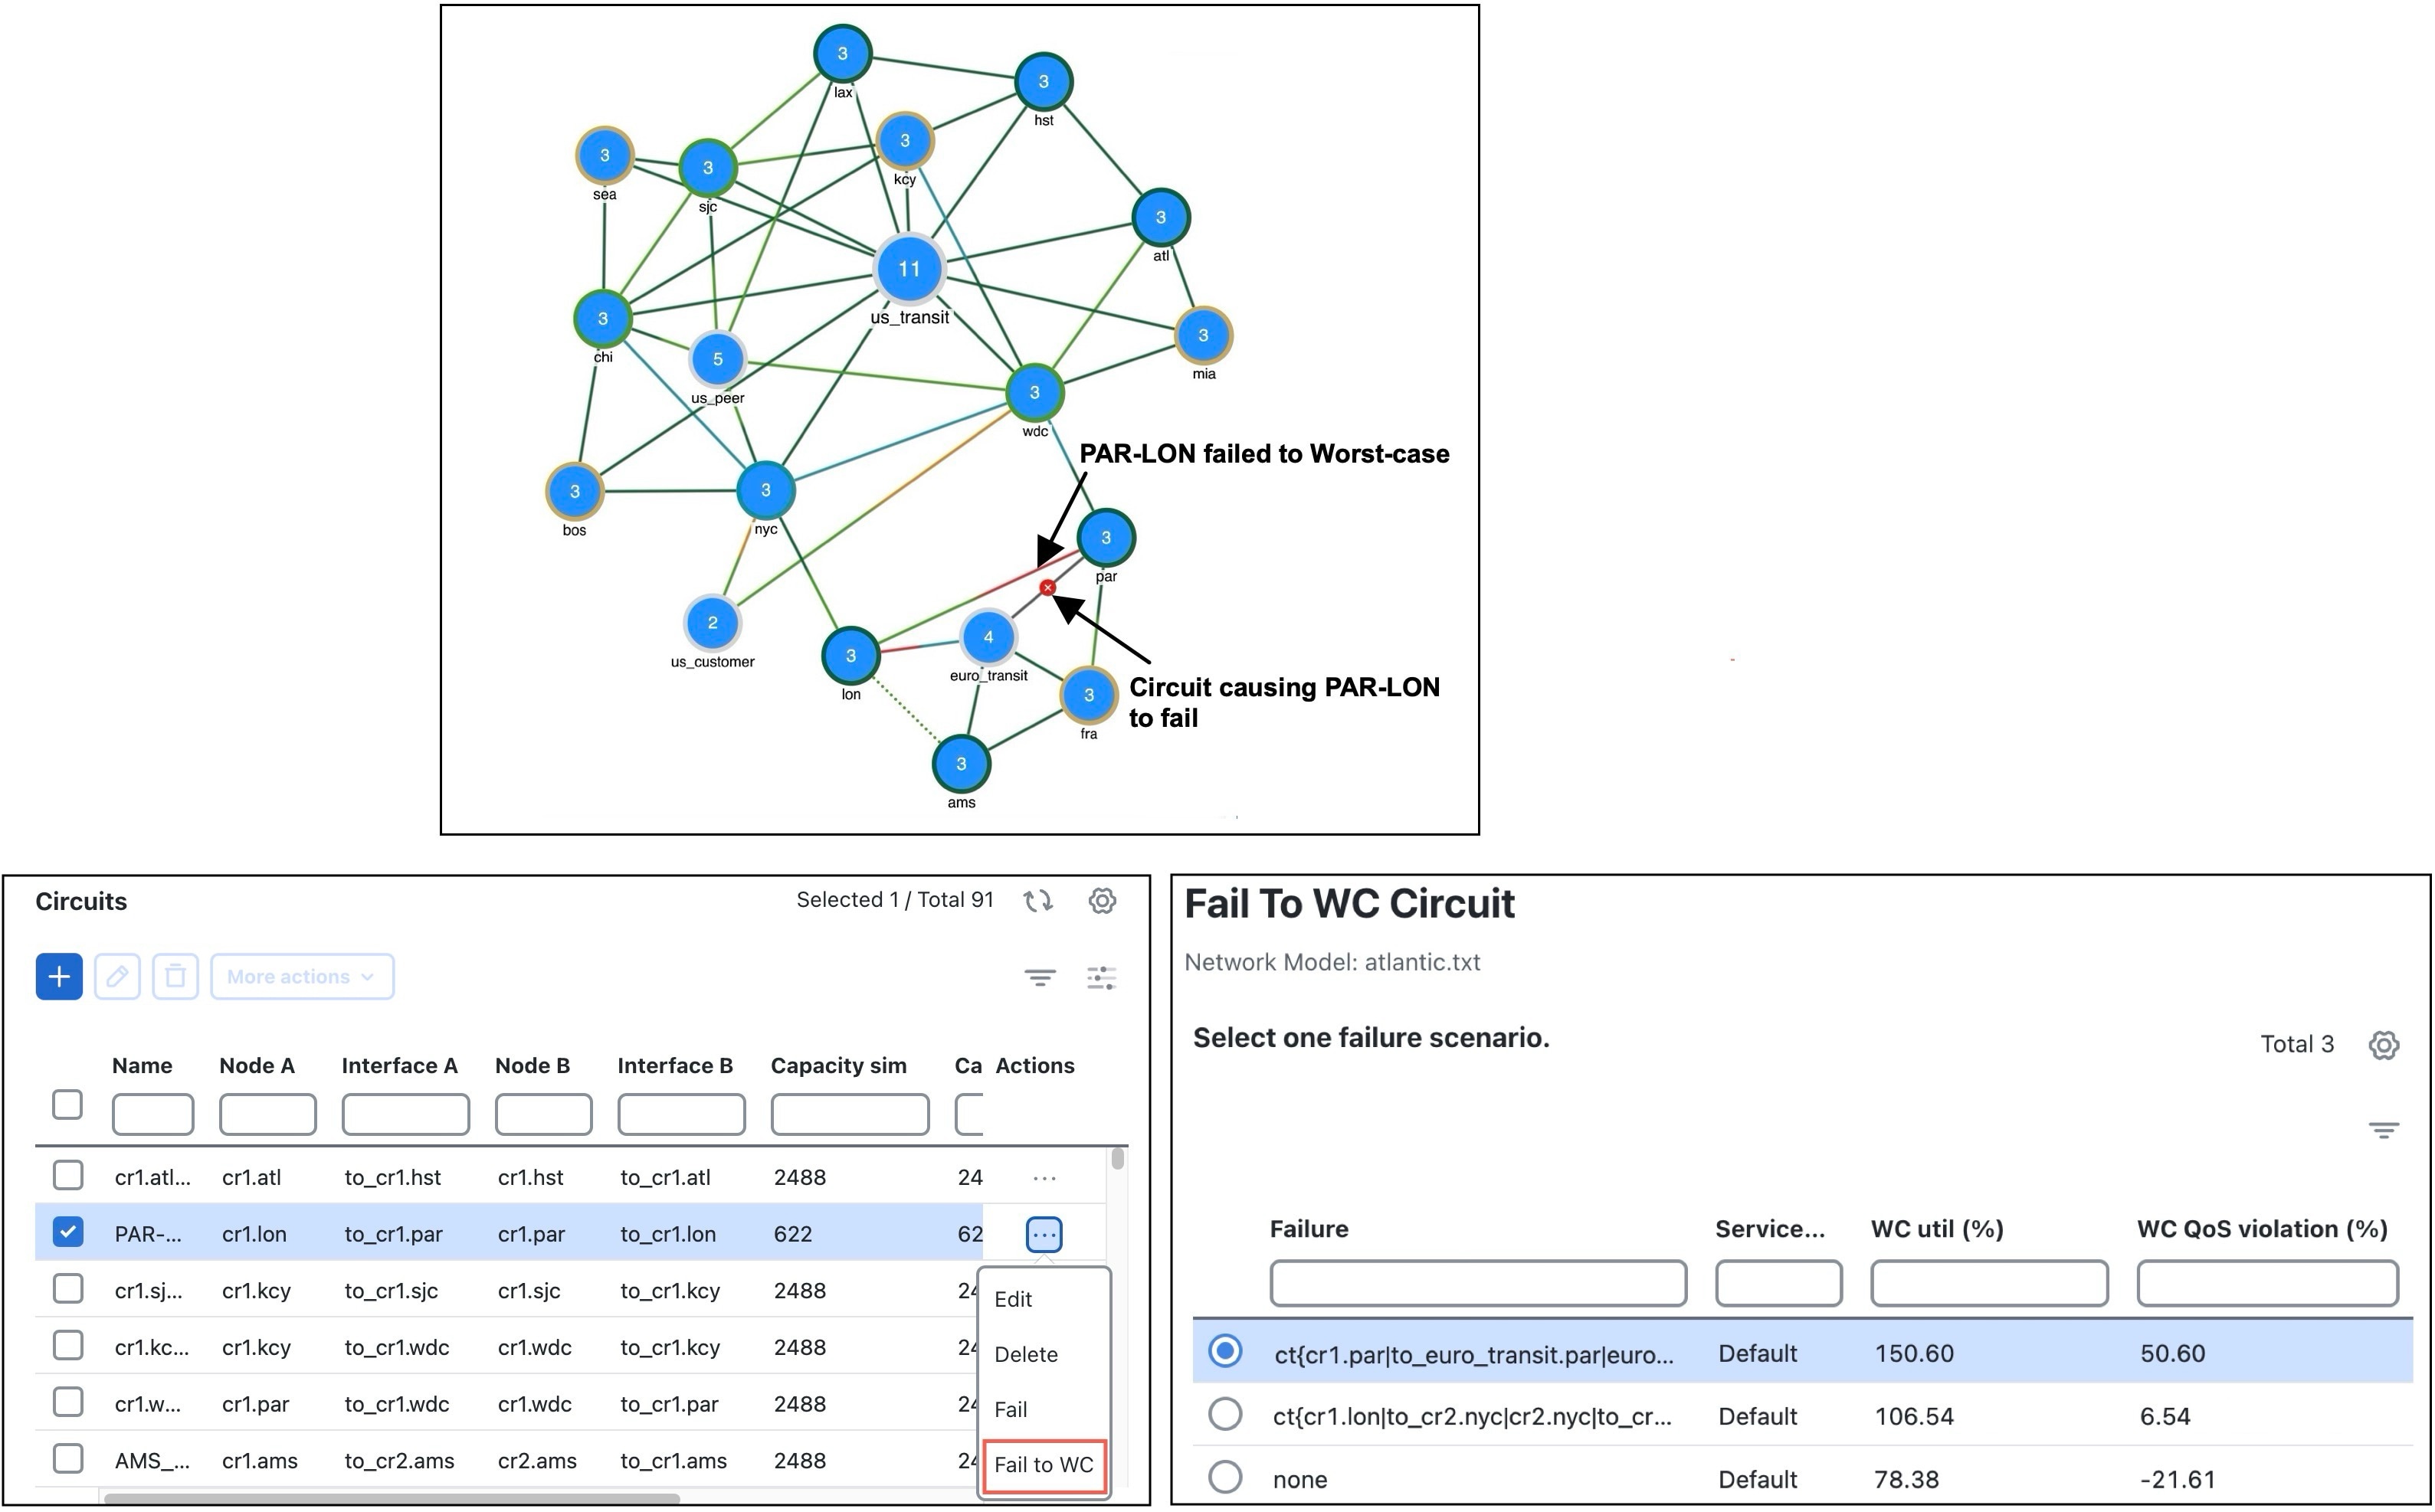
  • WC failure: List of one or more failures that cause the worst-case failure of the circuit. An easier way to read this list is to select an interface and use > Fail to WC.

    If you record failures causing utilizations within a given percent of worst case, this column shows QoS violations as a percent (refer to Worst-case QoS violation). If the number is positive, then the allotted capacity has been surpassed. If negative, the capacity has not been surpassed. For example, if a circuit has 10,000 Mbps capacity, and if the amount of traffic on it as a result of three different failures is 11,000, 8000, and 4000 Mbps, the utilizations are 10%, –20%, and –60%, respectively, and in descending order.

  • WC service class: The service class for which this worst-case scenario occurs.

For information on running a Simulation analysis with QoS, refer to Worst-case QoS violation.

For information on worst-case calculations for VPNs, refer to Simulate VPN.

Worst-case QoS violation

Cisco Crosswork Planning includes QoS bound (maximum available capacity) as part of the worst-case calculations. If there are no QoS parameters set, then the QoS bound is 100% and violations occur if utilization goes over that 100%. However, if a worst-case policy has been set on a service class or if interface queue parameters have been set, then worst-case QoS violations are calculated. In these instances, Cisco Crosswork Planning identifies the interface with the highest percentage of QoS violation as the worst-case possibility.

QoS violation parameters

These columns are updated:

  • WC QoS bound: The worst-case interface capacity available without violating these QoS requirements. This value is based on available capacity, traffic utilization, worst-case policies set on service classes, and interface queue parameters.

    The WC QoS bound (%) column identifies this same value as a percentage of the total capacity.

  • WC QoS violation: The worst-case traffic minus the worst-case capacity permitted (WC QoS bound). A violation occurs if the QoS capacity allotted through worst-case policies for service classes is exceeded or if QoS capacity allotted through interface queue parameters is exceeded. If the number appearing in the WC QoS violation column is positive, then the allotted capacity has been surpassed. If negative, the capacity has not been surpassed.

    The WC QoS violation (%) column identifies this same value as a percentage of total capacity.

  • WC service class: The service contributing to the worst-case QoS violation.

To see the cause of worst-case QoS violations, select a circuit and use > Fail to WC. The page that appears lists all causes of this circuit's worst-case utilization and its worst-case QoS violations. Choose the worst-case failure to view, and click Submit.

For more information on...

See...

  • QoS parameters and QoS calculations

  • Set worst-case policies on service classes

  • Set interface queue parameters

Simulate Quality of Service (QoS)

Worst-case QoS calculations for VPNs

Simulate VPN

Fail circuits to worst-case utilization

Use this task to selectively view each failure scenario that causes the worst-case utilization or worst-case QoS violation for a single interface after running simulation analysis.

If there are multiple possibilities for a worst-case failure, or if there is a range of failures within a percentage of the worst-case failure (listed in the WC failures column), the Fail to WC page lists each failure, its worst-case utilization percent, and its QoS violation percent (refer to Failure of a single circuit to its worst-case).


Note


If you choose an interface, you are actually failing its associated circuit to its worst case.

Procedure


Step 1

In the Worst-case traffic view, select the desired interface or circuit from their respective tables.

Step 2

From the Actions column, choose > Fail to WC.

The Fail to WC Interface (or Circuit) page appears.

Step 3

Choose the failure scenario of interest (refer to Failure of a single circuit to its worst-case).

Step 4

Click Submit.


The network plot changes to show this particular failure scenario.

Figure 2. Failure of a single circuit to its worst-case
Failure of a single circuit to its worst-case

Worst-case demand latency

When running Simulation analysis (refer to Run simulation analysis), you have the option to simulate worst-case latency for each demand in the plan. Cisco Crosswork Planning calculates the maximum latency of each demand under the failure scenarios selected. The result does not depend on service classes or traffic levels because demand routing is independent of these plans. The simulation also records the failures that cause this maximum latency.

Worst-case demand latency configuration

These columns in the Demands table are updated when you check the Calculate demand worst-case latency check box (under the Calculate worst-case utilization interface section) while running the Simulation analysis tool:

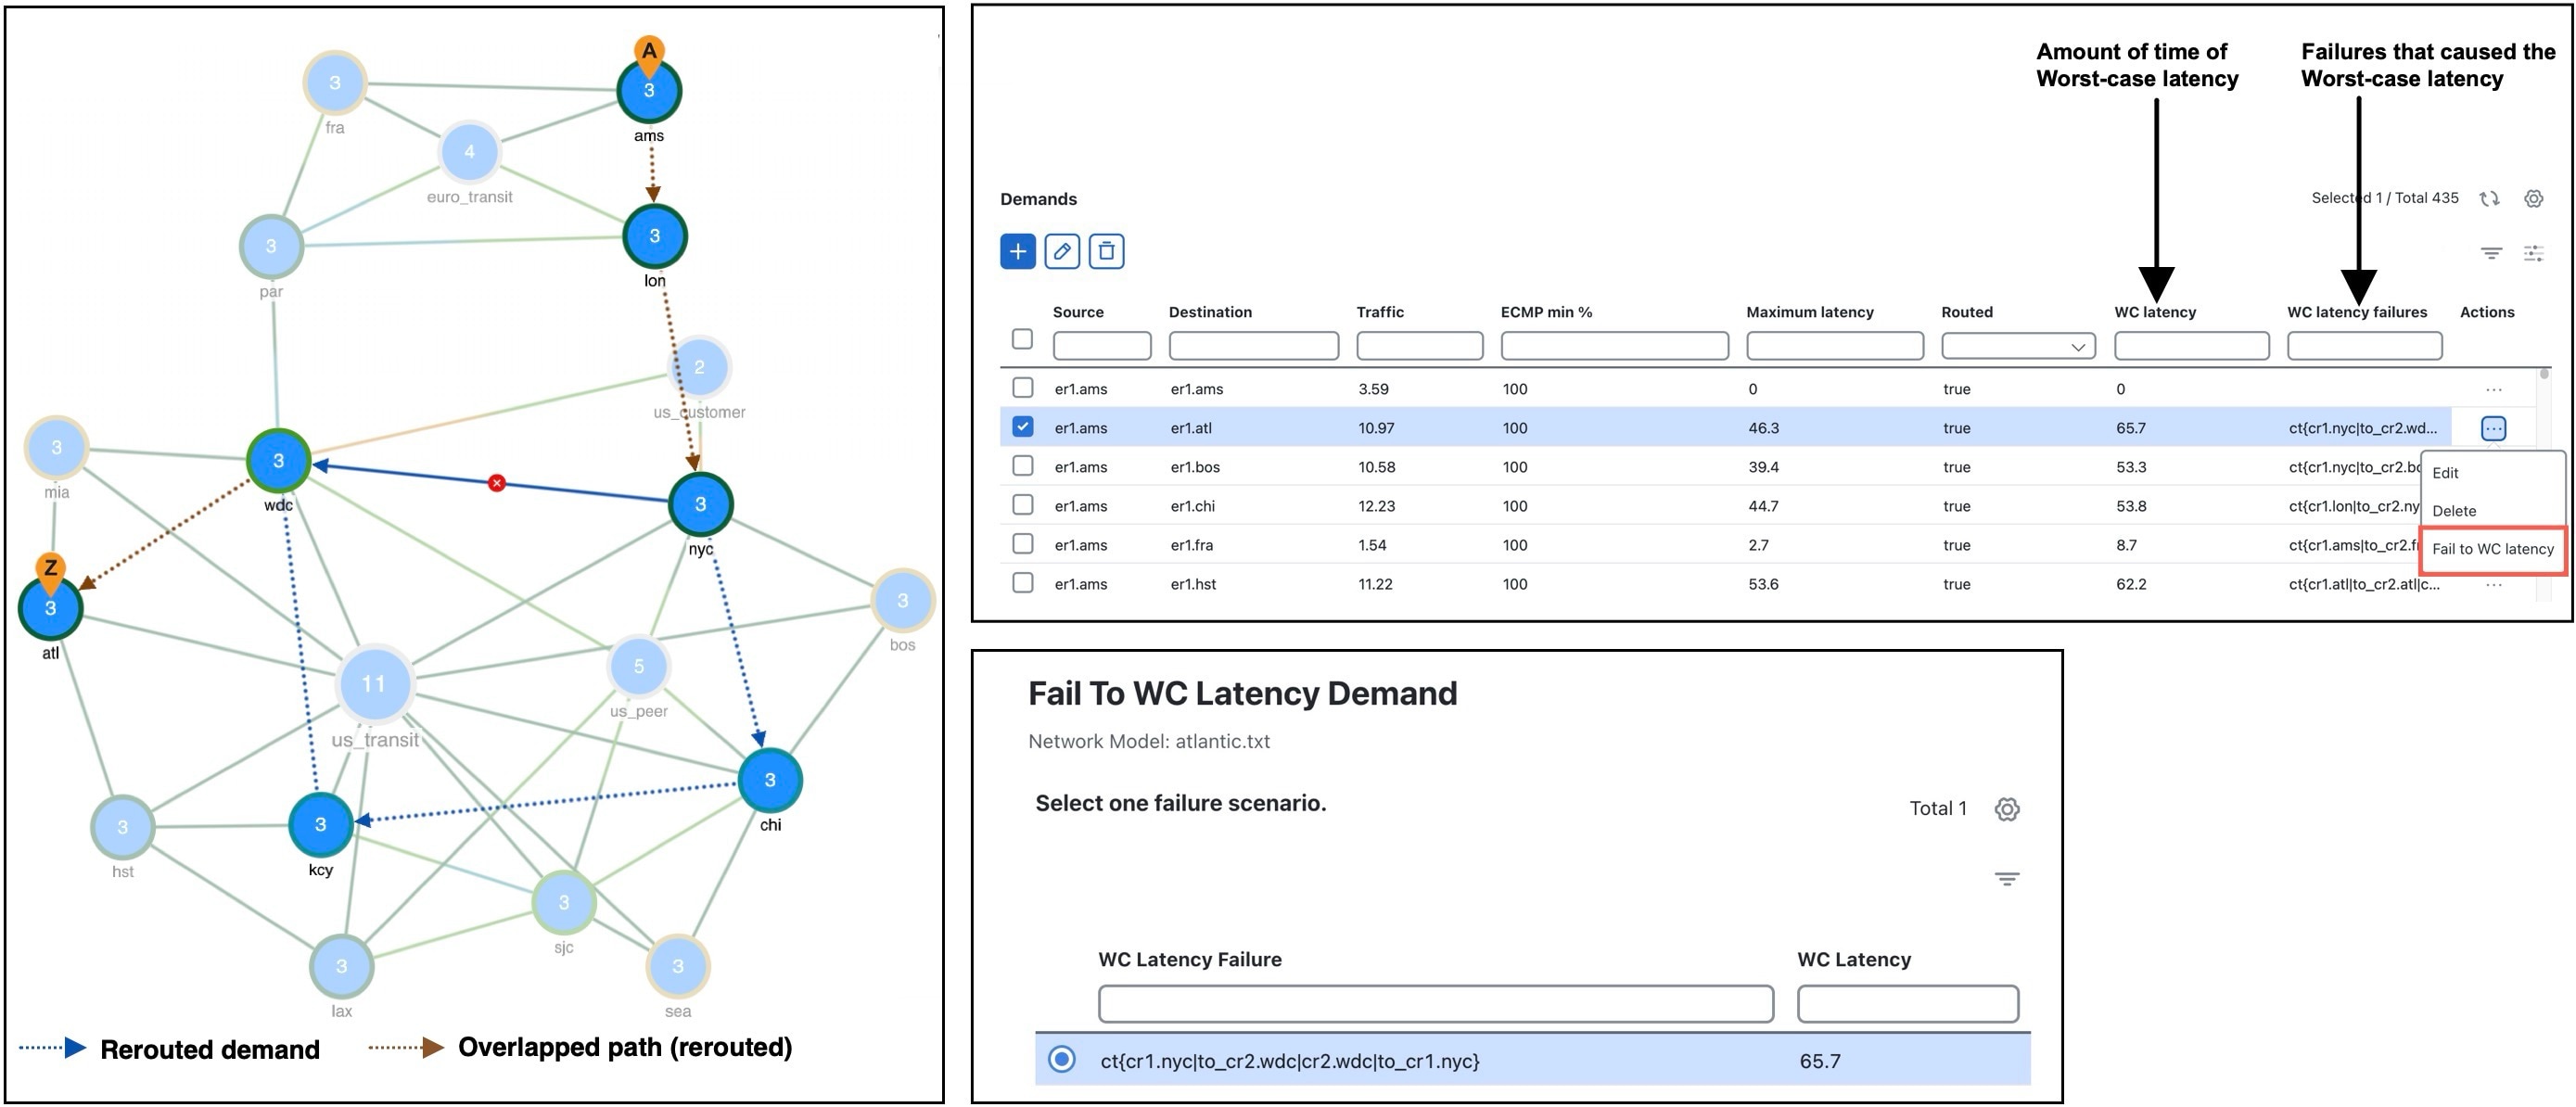
  • WC latency: The highest demand latency over all failure scenarios in the analysis.

  • WC latency failures: The failures that caused this worst-case latency. Up to 10 failures are identified.

Cisco Crosswork Planning captures the latencies of each demand for each failure case included in Simulation analysis using these two options:

  • Record failures causing demand latency within __ % of worst case: Records failures causing demand latency within the specified percentage range of the worst-case latency. Default is 0. If you enter 0, only the worst case latency failures are recorded.

  • Record up to __ failure scenarios on demand latency: Maximum number of failure scenarios to record per demand. Default is 1.

If you record failures causing demand latency within a given percent of worst case, the WC latency failures column shows the WC latency along with failure scenarios.

Fail demands to worst-case latency

Failing a demand to its worst-case latency allows you to analyze specific failure scenarios that cause the highest latency.

After running Simulation analysis to calculate demand worst-case latency, you have the option to fail a single demand to its worst-case latency. The failure scenarios causing the worst-case latency are listed in the WC latency failures column of the Demands table.


Note


If you have not selected the Calculate demand worst-case latency check box while running Simulation analysis and if the Plot view is not Worst-case traffic, you will not see the option to fail the demand to its worst-case latency.


Before you begin

  • Select the Calculate demand worst-case latency check box during simulation analysis (refer to Run simulation analysis).

  • Ensure the Plot view is set to Worst-case traffic.

Complete these steps to fail a demand to its worst-case latency.

Procedure


Step 1

In the Worst-case traffic view, select the desired demand from the Demands table.

Step 2

From the Actions column, choose > Fail to WC latency.

The Fail to WC Latency Demand page appears.

Step 3

Select the failure scenario of interest (refer to Example of worst-case demand latency).

Step 4

Click Submit.


The network plot changes to show this particular failure scenario.

Figure 3. Example of worst-case demand latency
xample of worst-case demand latency

Run simulation analysis

Use this task to run a simulation analysis to understand how failures affect network utilization, latency, and capacity.

The Simulation analysis tool supports four failure analysis options: worst-case utilization on interfaces, worst-case VPN utilization and latency, worst-case demand latency, and failure impact.


Note


Recording worst-case demand latencies or VPN worst-case utilizations increases the time it takes to perform a worst-case analysis.

Procedure


Step 1

Open the plan file (refer to Open plan files). It opens in the Network Design page.

Step 2

From the toolbar, choose Actions > Tools > Simulation analysis. Alternatively, you can also choose Actions > Pre-set workflows > Evaluate impact of failures.

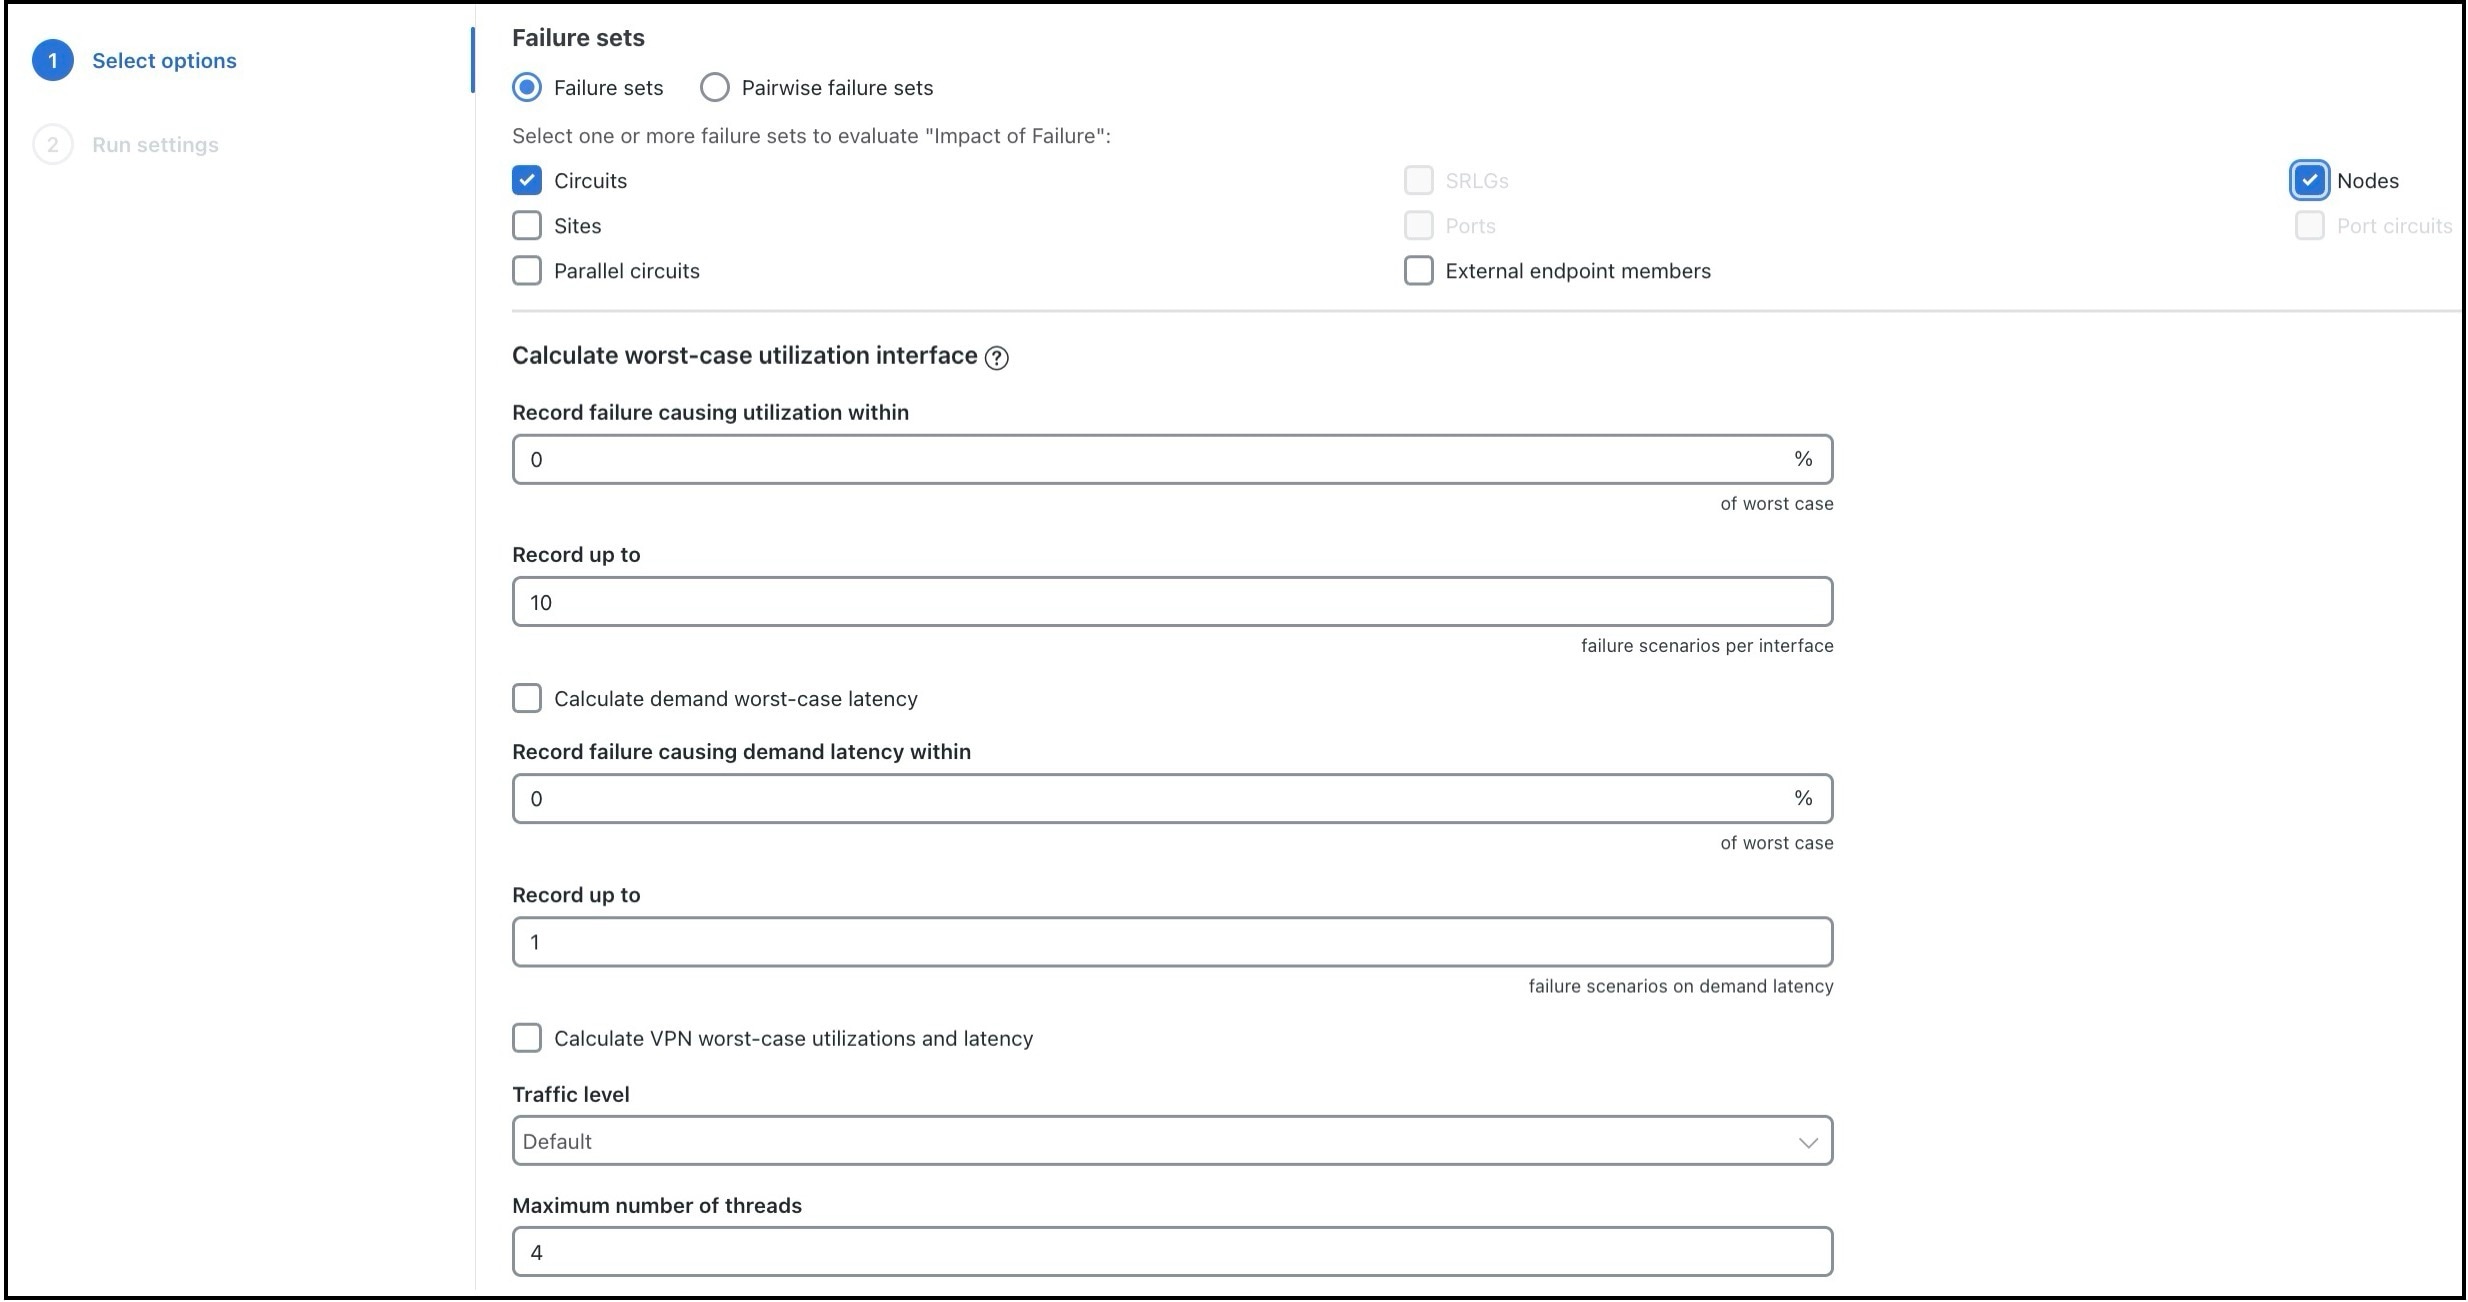
Figure 4. Simulation analysis options
Simulation analysis options

Step 3

In the Failure sets section, choose one or more failure sets.

To perform pairwise failure analysis, choose the Pairwise failure sets option and select the required objects. For more information, refer to Perform pairwise failure analysis.

Step 4

Configure these parameters as required:

  1. In the Record failures causing utilizations within __% of worst case field, enter 0 to record only worst-case failures, or enter a number to find all failures causing utilizations within that percentage range of the worst-case failure.

  2. In the Record up to __ failure scenarios per interface field, enter the maximum number of failure scenarios to record per interface. The default is 10.

    Example:

    If you record failures causing utilizations within 10% of the worst case, and the worst-case utilization for an interface is 90%, then Cisco Crosswork Planning records failures on this interface resulting in utilization of 81% or higher (90 -(90/10)). In this same scenario, if you record 10 failure scenarios per interface, and there are failures that could cause utilizations of 90%, 85%, 82%, and 76% for an interface, Cisco Crosswork Planning does not record the failure causing 76% utilization.
  3. Select whether or not to record demand worst-case latency calculations using the Calculate demand worst-case latency check box.

  4. In the Record failures causing demand latency within __ % of worst case field, enter 0 to record only worst case latency failures, or enter a number to find all failures causing demand latency within that percentage range of the worst-case latency.

  5. In the Record up to __ failure scenarios on demand latency field, enter the maximum number of failure scenarios to record per demand. The default is 1.

    Example:

    If you record failures causing demand latency within 10% of the worst case, and the worst-case latency for a demand is 100 ms, then Cisco Cisco Crosswork Planning records failure scenarios which have the latency of 90 ms or higher (100-(100/10)) on this demand. In this same scenario, if you record 5 failure scenarios per demand latency, and there are failures that could cause latency of 92 ms, 95 ms, 98 ms, and 80 ms for a demand, Cisco Cisco Crosswork Planning does not record the failure causing 80 ms demand latency.
  6. Select whether or not to record VPN worst-case utilizations and latencies using the Calculate VPN worst-case utilizations and latency check box. For more information, refer to Simulate VPN.

Step 5

Select one or more traffic levels.

Step 6

Enter the value of maximum number of threads in the Maximum number of threads field and click Next.

Step 7

On the Run Settings page, choose whether to execute the task now or schedule it for a later time. Choose one of these Execute options:

  • Now: Choose this option to execute the job immediately. The tool runs and changes are applied to the network model immediately. A summary report appears. You can access the report any time later using Actions > Reports > Generated reports option.

  • As a scheduled job: Choose this option to execute the task as an asynchronous job. Set these options:

    • Priority: Select the priority of the task.

    • Engine profiles: Select the engine profile as needed. This section lists all the available asynchronous engine profiles.

    • Schedule: Set the time at which you want to run the tool.

    The tool runs at the scheduled time using the selected engine profile. You can track the status of the job at any time using the Job Manager page (from the main menu, choose Job Manager). Once the job completes, import the output plan file into user space to visualize it. For more information, refer to Access output plan files from job manager.

    Note

     
    Ensure that you save the plan file before you schedule the job. Any unsaved changes in the plan file are not considered when you run the tool as a scheduled job.

Step 8

Submit your changes.


You can now use the Worst-case traffic view (from the Plot view drop-down, choose Worst-case traffic) to analyze the worst-case traffic utilization, worst-case QoS violation, and worst-case latency information. You can fail interfaces and nodes to their worst case, and fail demands to their worst-case latency. You can also use the Failure impact view view to identify the circuits that are responsible for worst-case traffic congestion.

Perform pairwise failure analysis

In addition to selecting the failure sets individually, the Simulation analysis tool allows you to select a pair of failure sets. This enables you to analyze a network model for instances when two concurrent failures may cause significant impact. You can select up to two failure sets for pairwise failure analysis and choose from several variations of pairwise failures to simulate.

Complete these steps to perform pairwise failure analysis.

Procedure


Step 1

In the Simulation analysis tool, choose the Pairwise failure sets option.

Step 2

Select up to two failure sets.

Step 3

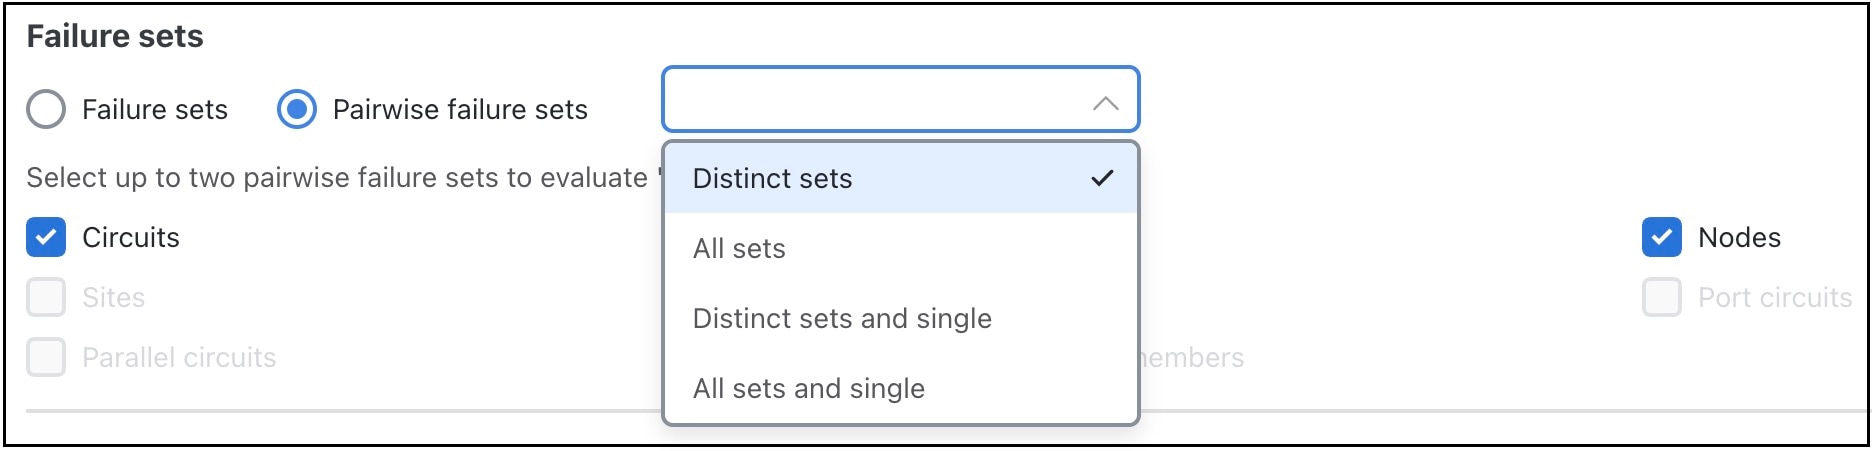
Choose one of the four options from the drop-down list.

Figure 5. Pairwise failure sets options
Pairwise failure sets options
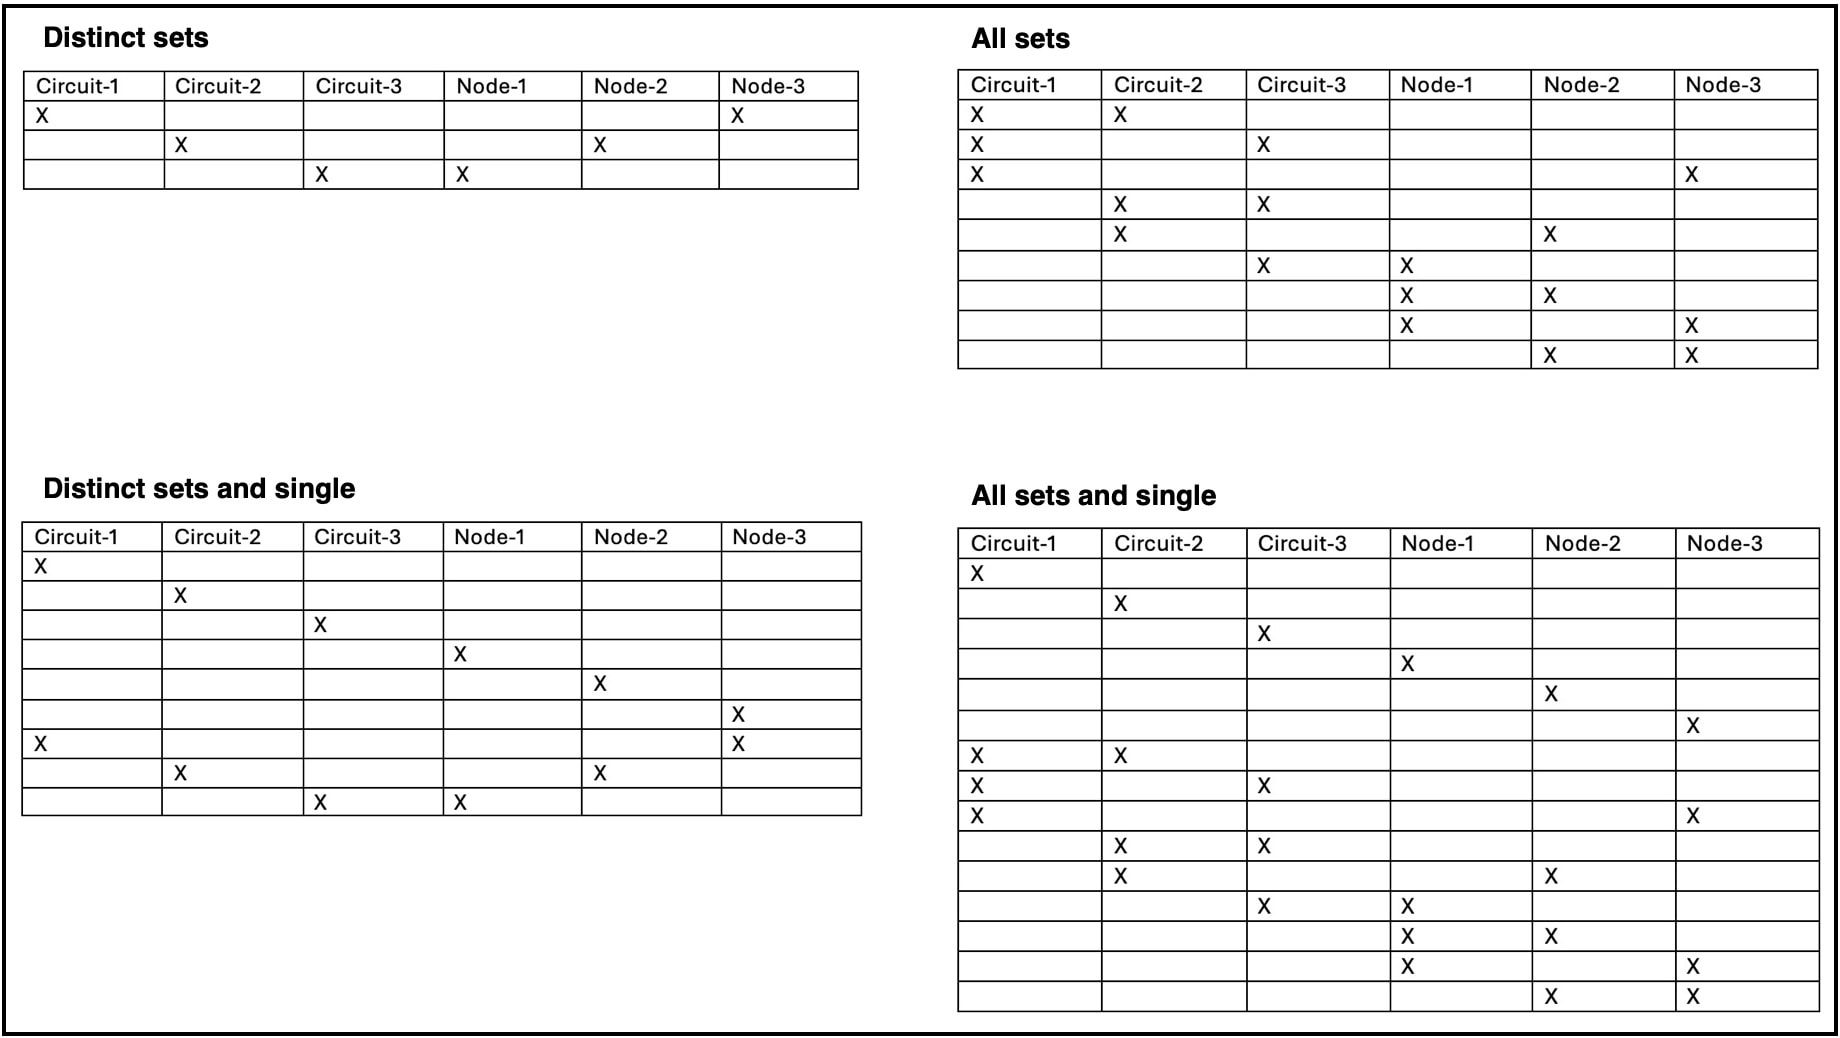
  • Distinct sets: This option creates pairwise failures using elements from distinct failure sets. For example, if you select circuit and node as failure sets, this option considers the combination of distinct sets (circuit, node) for pairwise failure analysis.

  • All sets: This option creates pairwise failures using elements from failure sets, including pairs of elements from the same failure set. For example, if you select circuit and node as failure sets, this option considers all combinations for failure analysis, that is, (node, node), (circuit, circuit), and (circuit, node).

  • Distinct sets and single: This option is similar to Distinct sets, but in addition to pairwise failures, it simulates the failure of individual elements in the failure sets. For example, if you select circuit and node as failure sets, this option considers combination of distinct sets and individual elements for failure analysis, that is, (circuit), (node), and (circuit, node).

  • All sets and single: This option is similar to All sets, but in addition to pairwise failures, it simulates the failure of individual elements in the failure sets. For example, if you select circuit and node as failure sets, this option considers all combinations of failure sets and individual elements for failure analysis, that is, (circuit), (node), (node, node), (circuit, circuit), and (circuit, node).

Note

 
  • The memory consumption and performance of the simulation analysis can be significantly impacted as the number of failure scenarios can grow dramatically with pairwise failure sets. For better performance, it is recommended to use the Distinct sets or Distinct sets and single options, rather than the All sets and All sets and single options.

  • Be cautious when using pairwise failure sets, as they execute significantly more failure scenarios compared to regular failure sets. For instance, in a 100-node scenario, regular failure sets would execute 100 scenarios, whereas pairwise failure sets (node, node) would result in 9,900 scenarios.


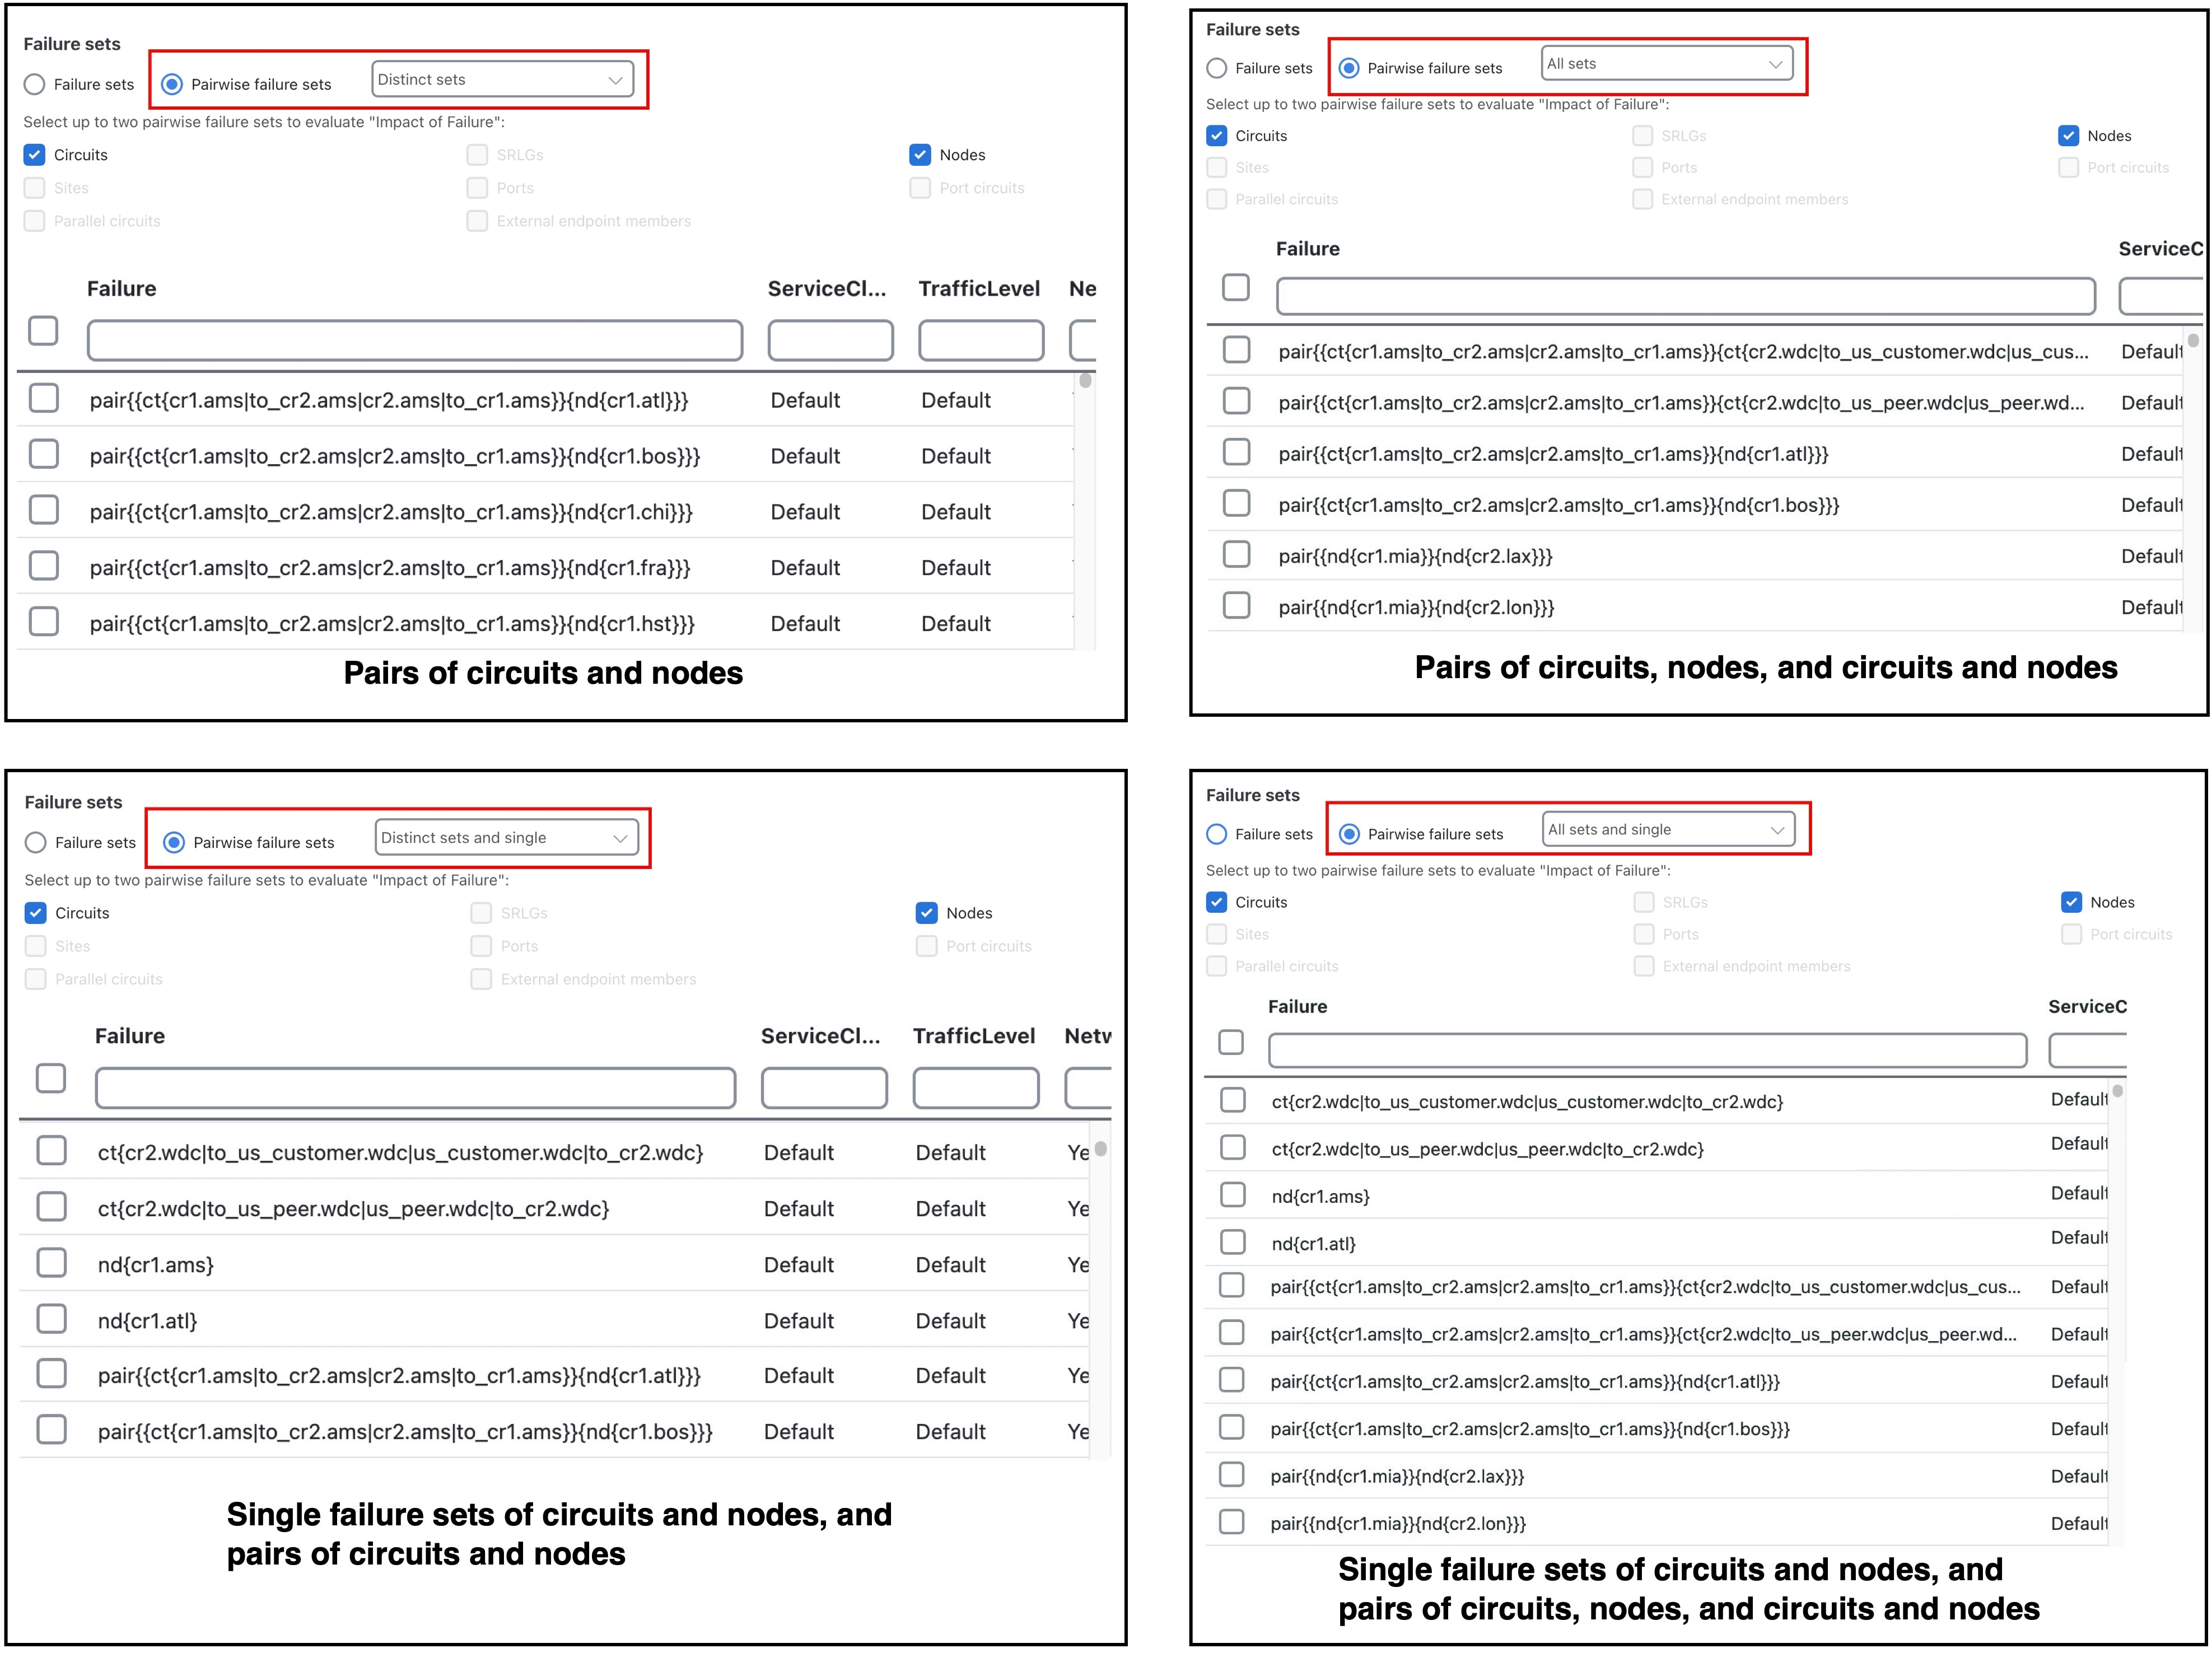
The Simulations tab in the generated report provides details of the list of single or paired objects considered in the failure analysis.

Figure 6. Pairwise failure sets selection and results
Pairwise failure sets selection and results

Pairwise failure analysis example

This example demonstrates how the selection of failure sets and pairwise failure options determines which failure scenarios the Simulation analysis tool evaluates.

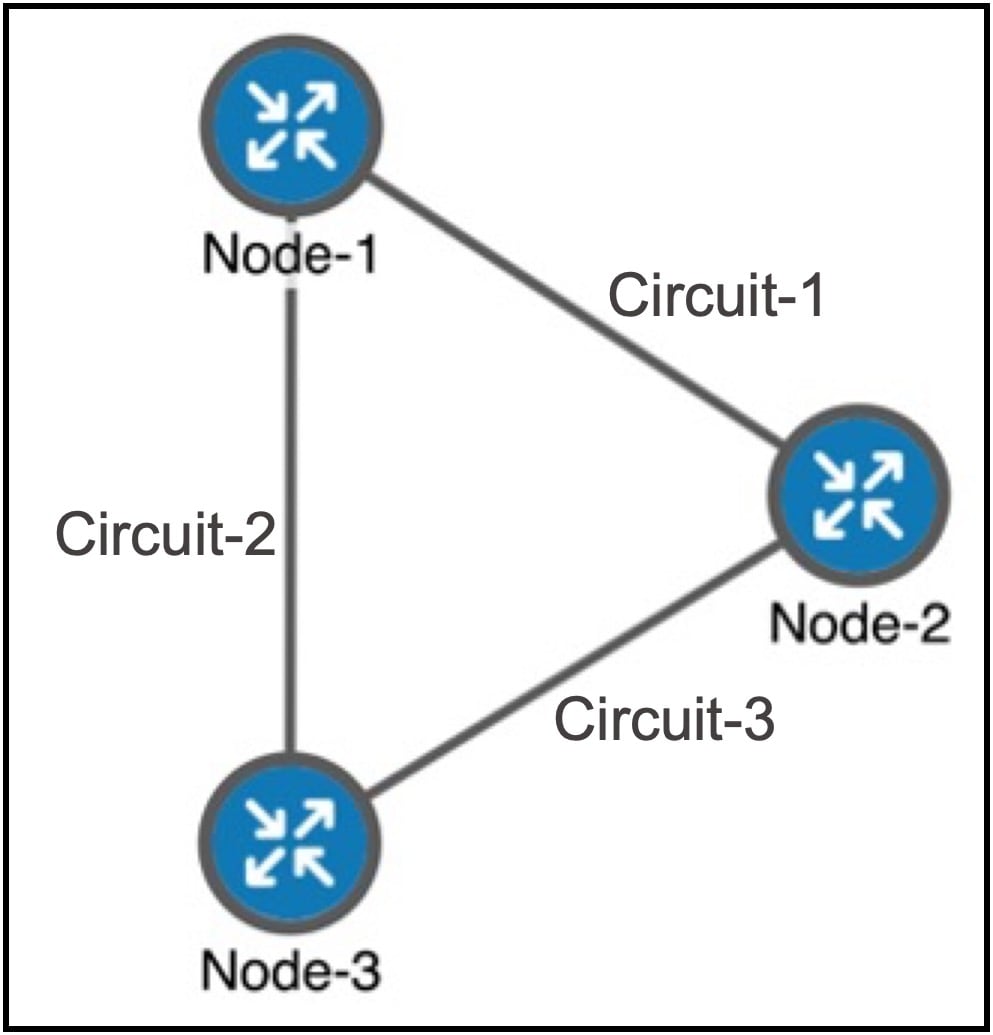
To illustrate how the pairwise failure options work, consider a simple network topology with:

  • Three nodes: Node-1, Node-2, Node-3

  • Three circuits (links): Circuit-1, Circuit-2, Circuit-3

Figure 7. Sample network topology
Sample network topology

This section examines the failure scenarios generated under these two conditions:

  • When only circuits are selected as failure sets

  • When both circuits and nodes are selected

Scenario 1: Pairwise failure analysis with only "Circuits" selected

When only "Circuits" are chosen as the failure set, the analysis focuses purely on failures involving Circuit-1, Circuit-2, and Circuit-3.

Pairwise failure option

Action

Generated failure scenarios

Distinct sets

Simulates the simultaneous failure of two distinct circuits.

(Circuit-1, Circuit-2), (Circuit-1, Circuit-3), (Circuit-2, Circuit-3)

All sets

Simulates the simultaneous failure of any two circuits.

Note

 
The results are same as the "Distinct sets" option because only one failure set was selected.

(Circuit-1, Circuit-2), (Circuit-1, Circuit-3), (Circuit-2, Circuit-3)

Distinct sets and single

Simulates individual circuit failures and the simultaneous failure of two distinct circuits.

  • Single failures: (Circuit-1), (Circuit-2), (Circuit-3)

  • Distinct pairs: (Circuit-1, Circuit-2), (Circuit-1, Circuit-3), (Circuit-2, Circuit-3)

All sets and single

Simulates individual circuit failures and all possible circuit pair failures.

Note

 
The results are same as the "Distinct sets and single" option because only one failure set was selected.
  • Single failures: (Circuit-1), (Circuit-2), (Circuit-3)

  • Distinct pairs: (Circuit-1, Circuit-2), (Circuit-1, Circuit-3), (Circuit-2, Circuit-3)

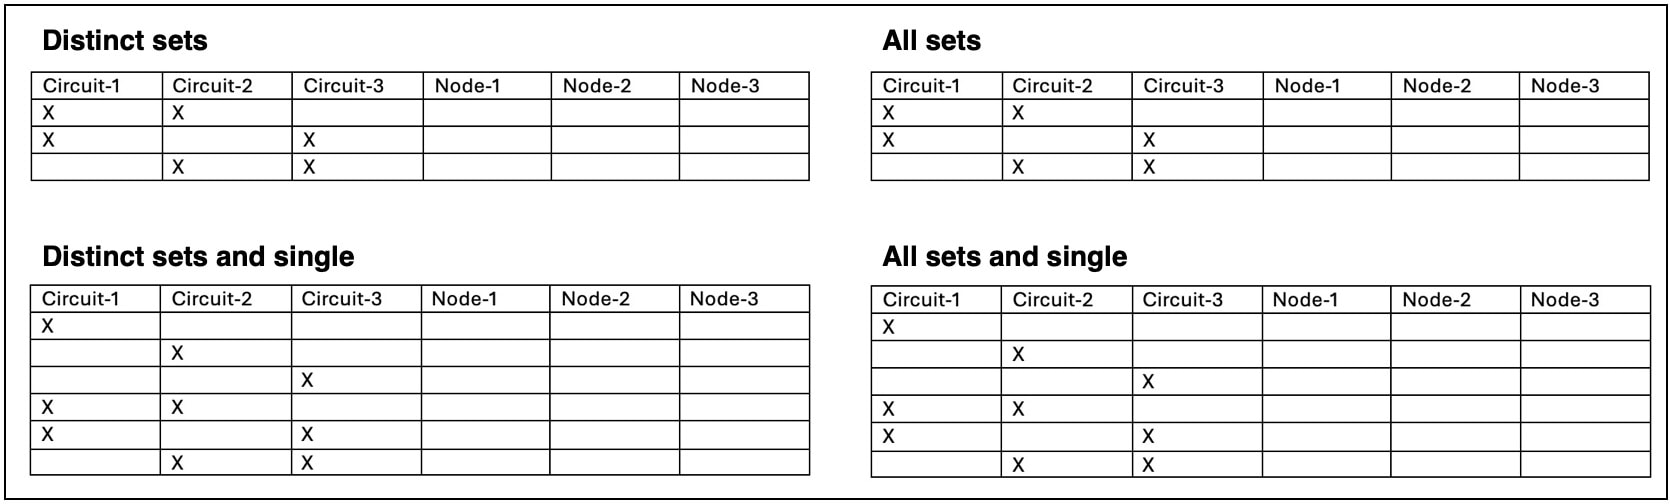
Figure 8. Summary of failure scenarios generated
Summary of failure scenarios generated
Scenario 2: Pairwise failure analysis with "Circuits" and "Nodes" selected

Selecting both "Circuits" (Circuit-1, Circuit-2, Circuit-3) and "Nodes" (Node-1, Node-2, Node-3) as failure sets significantly increases the number and types of failure combinations.

Pairwise failure option

Action

Generated failure scenarios

Distinct sets

Simulates the simultaneous failure of distinct circuit-node pairs.

In Sample network topology, Circuit-1 is not connected to Node-3. Similarly, Circuit-2 is not connected to Node-2, and Circuit-3 is not connected to Node-1. Therefore, these pairs are considered as distinct pairs in the failure scenarios.

(Circuit-1, Node-3), (Circuit-2, Node-2), (Circuit-3, Node-1)

All sets

Simulates the simultaneous failure of two elements chosen from the combined set of all circuits and all nodes. This includes:

  • Pairs of circuits

  • Pairs of nodes

  • Distinct circuit and node pairs

  • Circuit-Circuit pairs: (Circuit-1, Circuit-2), (Circuit-2, Circuit-3), (Circuit-1, Circuit-3)

  • Node-Node pairs: (Node-1, Node-2), (Node-2, Node-3), (Node-1, Node-3)

  • Distinct Circuit-Node pairs: (Circuit-1, Node-3), (Circuit-2, Node-2), (Circuit-3, Node-1)

Distinct sets and single

Simulates individual failures of circuits and nodes, and the simultaneous failure of distinct circuit-node pairs.

  • Single failures: (Circuit-1), (Circuit-2), (Circuit-3), (Node-1), (Node-2), (Node-3)

  • Distinct Circuit-Node pairs: (Circuit-1, Node-3), (Circuit-2, Node-2), (Circuit-3, Node-1)

All sets and single

Simulates individual failures of circuits and nodes, and the simultaneous failure of any two elements from the combined set of all circuits and all nodes.

This option generates the largest number of scenarios.

  • Single failures: (Circuit-1), (Circuit-2), (Circuit-3), (Node-1), (Node-2), (Node-3)

  • All pairs: (Circuit-1, Circuit-2), (Circuit-2, Circuit-3), (Circuit-1, Circuit-3), (Node-1, Node-2), (Node-2, Node-3), (Node-1, Node-3), (Circuit-1, Node-3), (Circuit-2, Node-2), (Circuit-3, Node-1)

Figure 9. Summary of failure scenarios generated
Summary of failure scenarios generated

Protect objects

To exclude an object from the list of those objects failed when performing a Simulation analysis, you can mark it as Protected in its Edit page. For example, if you want to run a Simulation analysis only on core nodes, you could first protect all edge nodes.

You can protect nodes, sites, circuits ports, port circuits, external endpoint members, and parallel circuits.

The image illustrates the process of configuring object protection in a simulation analysis, highlighting how to mark specific objects as protected to exclude them from failure lists.

Note


If you select an interface, you are actually protecting its associated circuit.

Procedure


Step 1

Open the plan file (refer to Open plan files). It opens in the Network Design page.

Step 2

Select one or more like objects from their respective tables.

Step 3

Click Edit icon.

Note


If you are editing a single object, you can also use the > Edit option under the Actions column.

Step 4

In the State field, check the Protected check box.

Step 5

Save the changes.


The selected objects are marked as Protected and will be excluded from Simulation analysis failure lists.

Simulation analysis report

Each time Simulation analysis is run, a report is automatically generated. To view the report, select Actions > Reports > Generated reports and then click the Simulation Analysis link in the right panel.

  • The Options tab displays the input parameters used for the simulation analysis.

  • The Summary tab details the options used in the analysis. It also summarizes the most important problems identified, such as QoS violations and latency bound violations.

  • The Max Utilization tab shows the impact of failures on maximum utilization in the form of a pie chart.

  • The Simulations table lists each simulation that was performed in the Simulation analysis.

Note that new reports replace the previous ones.

Table 1. Simulations table in simulation analysis report

Simulation Data Point

Description

Failure

Failure scenario used in the analysis.

ServiceClass

Service class used in the analysis.

TrafficLevel

Traffic level used in the analysis.

NetworkBreakpoint

Identifies whether there are network breaks resulting from the failures in this simulation. If multiple network breakpoints occur, the most serious one is listed.

  • Yes (Total): A break exists that completely partitions the network into two or more disconnected sections.

  • Yes (AS): A break exists that completely partitions an AS into two or more sections. However, routes exist between the sections of the AS through other ASes.

  • Yes (OSPF Area 0): A break exists that completely partitions Area 0 of an AS running OSPF. Under OSPF, traffic cannot route between the partitions even if a path is available through non-zero areas in the AS.

  • No: No break in the network.

NumUnroutedDemands

Number of demands that cannot be routed under this failure for any of the reasons identified by the network breakpoint.

UnroutedTraffic

Total amount of demand traffic that cannot be routed under this failure for any of the reasons identified by the network breakpoint.

MaxUtil

Maximum utilization over all interfaces in this simulation. Utilization is the traffic through the interface as a percentage of the capacity of the interface.

MaxQoSboundpercent

Worst-case capacity available without violating QoS bounds, expressed as a percentage of the total capacity.

NumQoSviolations

Number of times the QoS bound is violated. QoS bounds are set through service class policies and interface queue parameters.

LatencyBoundViolations

Number of demands with maximum latency in excess of the latency bound specified for the demand.

NumUnRoutedLSPs

Number of unrouted non-Fast Reroute (FRR) LSPs in the analysis.

NumUnroutedFRRLSPs

Number of unrouted FRR LSPs in the analysis.

NumRoutedCSRSVPLSPs

Number of routed CS-RSVP LSPs in the analysis.

NumUnroutedCSRSVPLSPs

Number of unrouted CS-RSVP LSPs in the analysis.

NumNonDisjointCSRSVPLSPs

Number of CS-RSVP LSPs with disjointness violations.

NumNodeToLinkDSJCSRSVPLSPs

Number of CS-RSVP LSPs falling back from node disjointness to link disjointness.

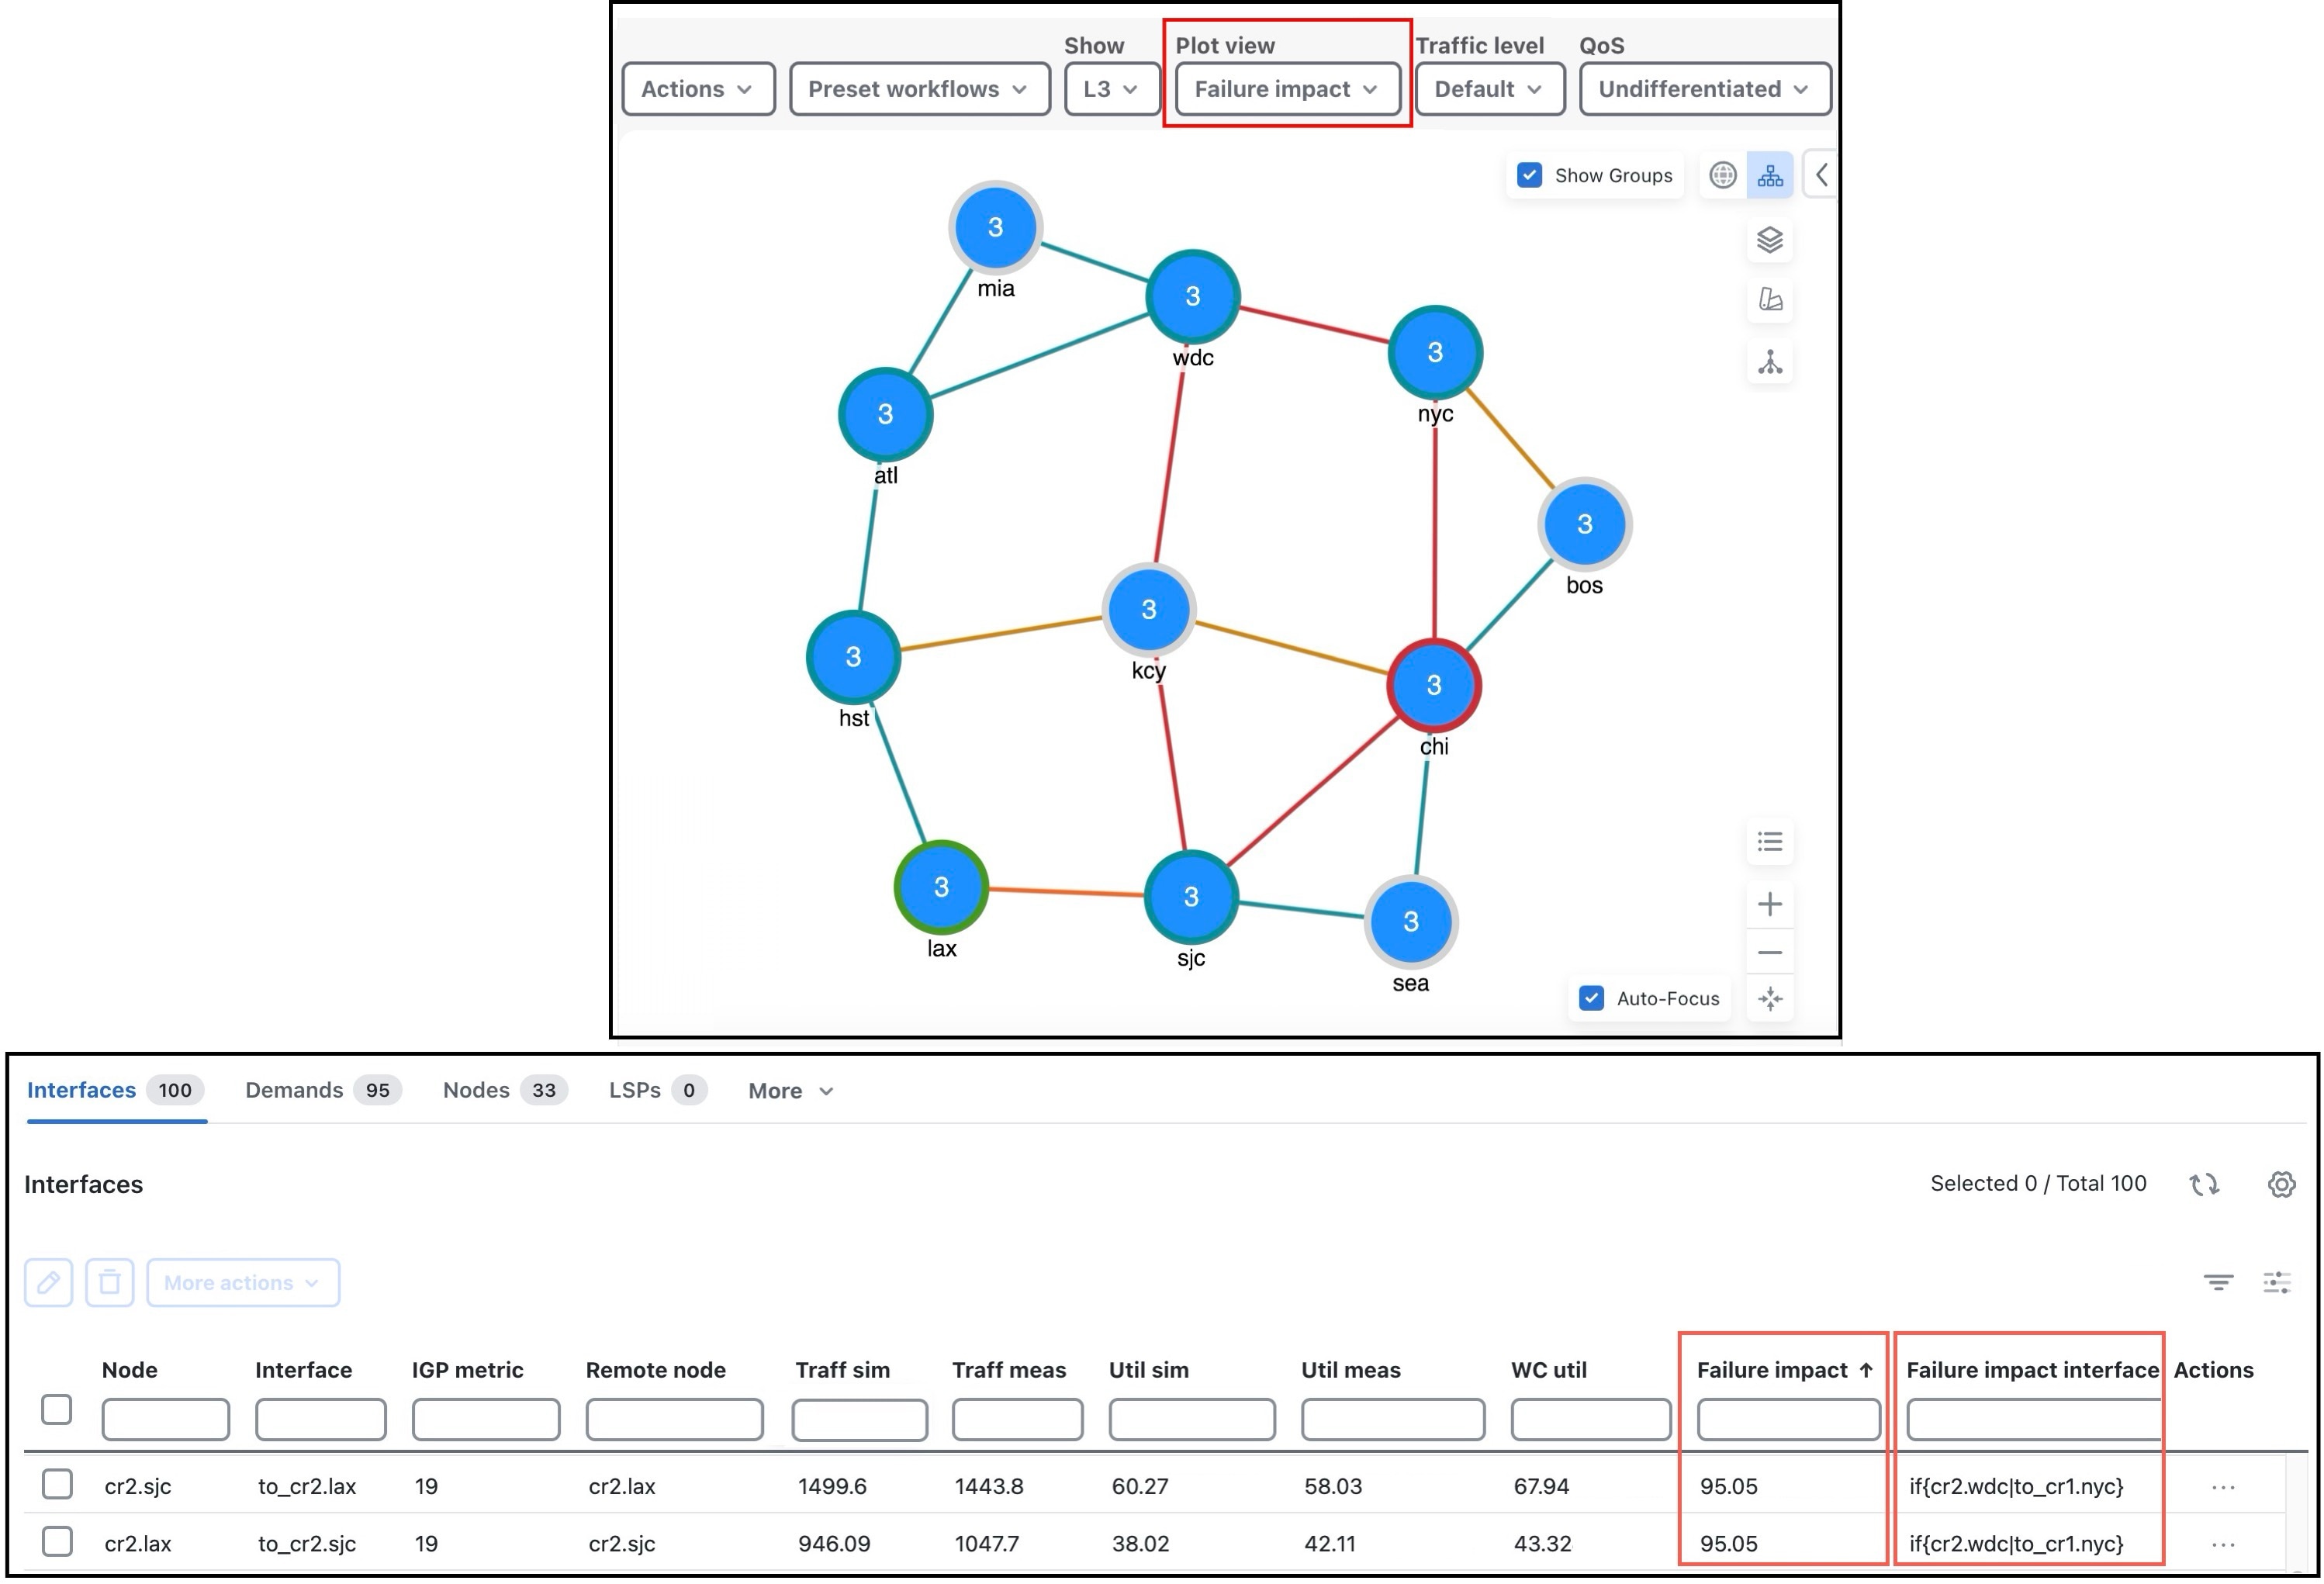
Failure impact view

A failure impact view is a network plot view that

  • colors nodes and circuits according to the maximum utilization level that would be caused elsewhere in the network should the node or circuit fail

  • indicates the resulting utilization and severity of the congestion through color representation, and

  • becomes available upon running a Simulation analysis.

Columns related to failure impact

The Node, Interface, and Circuit tables contain the Failure impact and Failure impact interface columns. In the Interfaces table, the information describes the failure impact of the circuit containing the interface.

  • Failure impact: The failure impact of each node or circuit. For example, if the value is 80%, it means that if this node or circuit failed, the resulting traffic utilization on one or more interfaces would exceed 80%.

  • Failure impact interface: The interface that will experience the highest utilization as a result of the node or circuit going down.

Format = if{Node|Interface}

For example, if{cr2.sjc|to_cr1.kcy} means if the circuit goes down, it will have the greatest traffic impact on the cr2.sjc to cr1.kcy interface.

In the network plot, the Site borders show the maximum utilization level that would be caused elsewhere in the network should nodes within it fail or should intra site circuits within it fail.


Note


The Failure impact view only shows the impact of circuit and node failures. It does not show failures of other objects.

Failure impact view

In Failure impact view, a sjc-lax circuit has a utilization of 90-100% and its color representation is orange red. This means that if sjc-lax were to fail, one or more interfaces would react by exceeding a 90% utilization level and correspondingly, would turn orange red in the plot.

Figure 10. Failure impact view
Failure impact view

Configure parallelization for simulation analysis

Parallelization allows the Simulation Analysis tool to split computation across multiple engines, resulting in faster processing times for large network models with thousands of circuits.

The Simulation Analysis tool supports parallelizing computation to achieve faster results for large network models. For example, if there are 10000 circuits in a network model and 10 different engines are available, the tool can partition the network model into 10 sections with each partition handling 1000 failure scenarios. This creates 10 different result files that are later merged to obtain the final result.

Procedure


Step 1

From the main menu, choose Job Manager.

Step 2

Click The Simulation Analysis tool illustrates how to partition a large network model into sections for parallel computation, enabling faster processing of multiple failure scenarios. > Using CLI.

Step 3

Choose Simulation analysis and click Next.

Step 4

Select the network model in which you want to run the simulation analysis and click Next.

Step 5

In the Simulation Analysis input options field, enter this command.

-failure-sets <failure-sets> -num-partitions <number-of-partitions> -num-threads <number-of-threads> -partition-index <partition-index> -result-file <result-filename>

Parameter definitions:

  • -num-partitions: Number of partitions of the failure scenarios. Each partition has an associated set of failure scenarios and is identified by an index ranging from 0 up to the number of partitions minus 1. Default is 1.

  • -partition-index: Simulate the set of failure scenarios belonging to the specified partition. Default is 0.

  • -result-file: If specified, the simulation analysis report results are written to this file. The file can be a *.txt or a *.db file.

Step 6

To merge the results, invoke the merge_sim_analysis CLI using the Python script. For more information on running tools and initializers using CLI, refer to Run tools or initializers using CLI.

import os
import sys

cmd = "merge_sim_analysis -plan-file {0} -partial-results {1} -out-file out-plan.txt ".format( sys.argv[1], sys.argv[2])
print(cmd)
os.system(cmd)

Parameter definitions:

  • -plan-file: Input plan file.

  • -out-file: Output plan file.

  • -partial-results: Comma separated list of files containing simulation analysis results for each partition. These may be plan files or files generated using the -result-file option while running the Simulation analysis CLI tool.

  • -partial-result-paths-file: File containing list of files, one per line, with simulation analysis results for each partition. These may be plan files or files generated using the -result-file option while running the Simulation analysis CLI tool. This is ignored if the -partial-results option is specified.

Step 7

In the Job Manager, enter the script arguments while running the script (run_cli_merge.py).

run_cli_merge.py input_planfile.pln res_0.txt,res_1.txt,res_2.txt