Simulate Quality of Service (QoS)

Quality of Service (QoS)

Quality of Service (QoS) is a network performance mechanism that

  • ensures high-quality performance for critical applications

  • allows preferential treatment for critical applications

  • differentiates traffic based on user or application requirements, and

  • ensures that service levels are met without reactively expanding or over-provisioning the network.

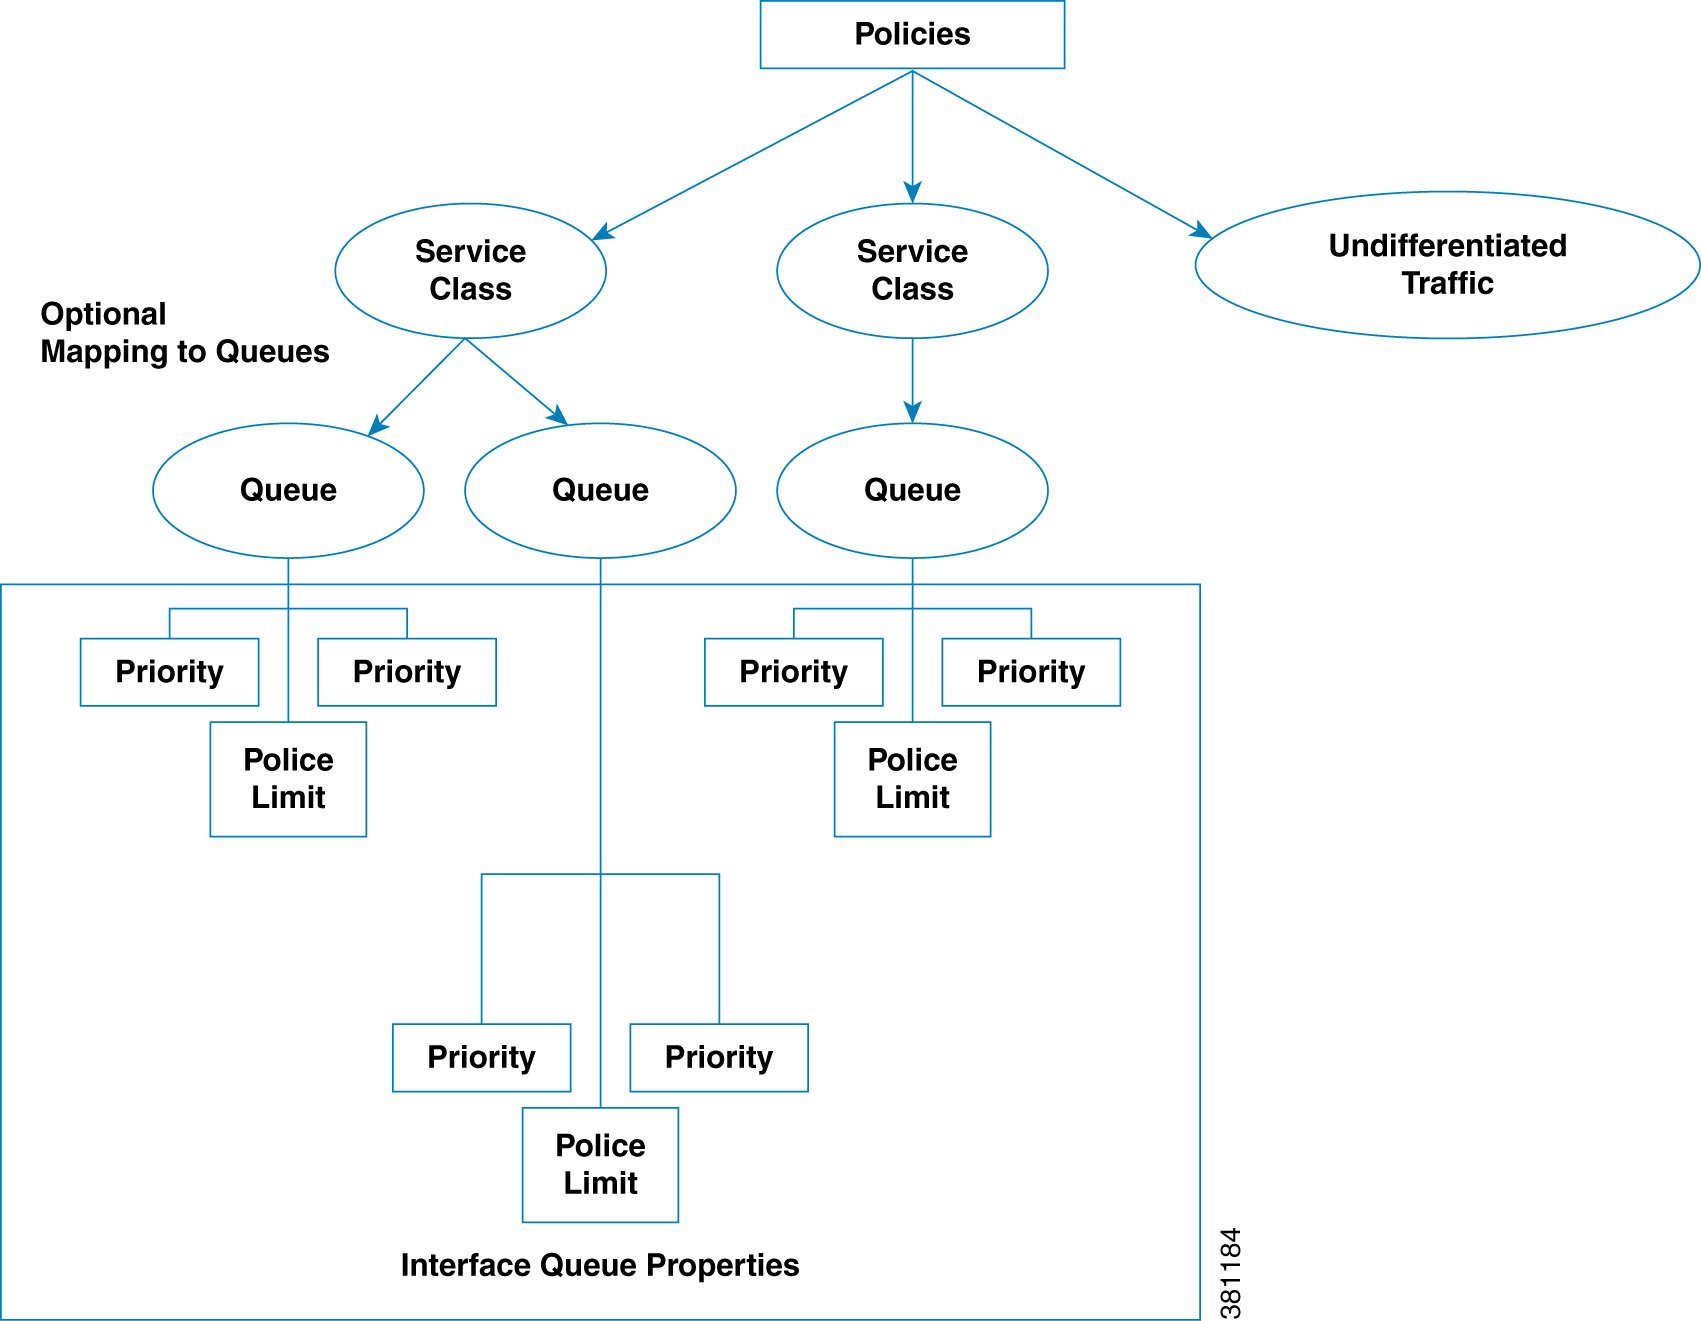
QoS features are available for undifferentiated traffic, for service classes, and for interface queues.

  • Undifferentiated traffic: Aggregate traffic on an interface.

  • Service class: A user-defined classification of traffic that is not discovered by Cisco Crosswork Planning. Examples include voice, video, and data. Service classes apply to the entire network.

  • Interface Queue: In live networks, traffic waits in conceptual lines (queues) and then is forwarded over an interface on a per-queue basis according to QoS parameters. Similarly, in Cisco Crosswork Planning, each queue has a set of user-defined QoS parameters (interface queue properties) that specify how these queues are prioritized and what percentage of traffic they carry. An interface contains zero or more queues that are discoverable by Cisco Crosswork Planning. You can also manually create and configure them. The traffic per queue is also discovered.
QoS requirements

In Cisco Crosswork Planning, QoS requirements are defined by policies and interface queue properties.

Policy

A policy defines the maximum percentage of traffic capacity that can be used by either a service class or by undifferentiated traffic. There are two policies: one for normal operation and one for worst-case scenarios. Policies set on service classes do not affect QoS requirements of any other service class, nor do they affect live network behavior.

Interface queue properties

These parameters affect routing behavior in a live network. In Cisco Crosswork Planning, the interface queue properties are priority, weight, and police limit. To set these properties, refer to Edit interface queue properties.

  • Priority: Identifies the precedence of the queue. For example, traffic in a priority 1 queue is routed before traffic in a priority 2 queue. Queues with the same priority share capacity evenly based on weighted round robin (WRR) calculations. You can change this behavior using the weight and police limit parameters. There are an unlimited number of priorities; however, most networks only use no more than three. By default, queues do not have priorities.

  • Weight: Identifies the percentage of preference given to queues of an equal priority level, which enables the network to fairly distribute the load among available resources. For example, if 10 Gbps were passing through a 10GbE interface on two priority 1 queues, by default 5 Gbps would pass through each queue. However, if you set the weight of one queue to 75% and the other to 25%, the distribution would be 7 Gbps and 2.5 Gbps, respectively. By default, all queues have a weight of 100%.

  • Police limit: Identifies the maximum percentage of available capacity permitted through a queue of a given priority level, thereby preventing traffic from higher priority queues from starving lower priority queues. For example, if the interface is a 20GbE and a priority 1 queue has a police limit of 40%, then only 8 Gbps of interface traffic can go through this queue. By default, all queues have a police limit of 100%. To see examples of this starvation, refer to the examples in Policies and QoS bound calculations, where you can see that lower priority queues received zero traffic due to priority settings.

Figure 1. Policies and interface queue parameters
Policies and interface queue parameters

QoS bound and QoS violations

Cisco Crosswork Planning uses the concepts of QoS bound and QoS violation to identify whether QoS parameters are being met or surpassed. This helps you plan for service requirements across the network. Policies and queue properties determine the QoS bound calculation. In turn, this calculation determines whether there is a violation.

QoS bound

The QoS bound is the maximum interface capacity available without violating these QoS requirements. Separate QoS bounds are calculated for both policy and interface queue properties.

QoS bound for...

Calculated based on...

Interface queues

Combination of interface queue properties, or in live networks, it is the capacity percentage that is discovered.

Service class

Policy

Service class mapped to queues

The lower of these two calculations is used:

  • Policy for service class

  • Queue properties for queues

Undifferentiated traffic

Policy

In the Network Summary table, these columns convey the QoS bound information: QoS bound meas, QoS bound meas (%), QoS bound sim, and QoS bound sim (%).

QoS bound calculations involve determining how to increase traffic on the queues until it reaches the maximum allowable amount. This capacity, or the reason the traffic cannot be increased further, is defined both by the QoS parameters and the amount of traffic. For example, when traffic arrives at Queue X, Cisco Crosswork Planning fixes the traffic on all other queues and then determines how it can increase the traffic on Queue X until some other traffic blocks it.

For those queues that do not reach full capacity, unused queue capacity is made available for other queues.

QoS violation

QoS violation is the total traffic minus the capacity permitted for the queue (QoS bound). A violation occurs if the maximum QoS capacity allotted through policies and interface queue properties is exceeded. If the number appearing in the QoS violation column is positive, the allotted capacity has been surpassed. If the number is negative, the allotted capacity has not been reached.

Policies and QoS bound calculations

If you do not set other QoS parameters such as Priority, Weight, or Police limit in the Interface queue properties, the QoS bound equals the policy that you configure.

This table provides examples of how interface capacity, traffic type, and policy settings affect QoS bound calculations and whether violations occur.

Table 1. Example policies and QoS bound calculations

Example configuration

QoS bound

QoS violation (Positive # = Violation)

Interface capacity = 10,000 Mbps

Undifferentiated traffic = 5000 Mbps

Normal operation policy = 60%

6000 Mbps (60%)

–1000 Mbps (–10%)

Because this number is negative, there is no capacity violation.

Interface capacity = 10,000 Mbps

Undifferentiated traffic = 8000 Mbps

Normal operation policy = 60%

6000 Mbps (60%)

2000 Mbps (20%)

Because this number is positive, there is a capacity violation.

Interface capacity = 10,000 Mbps

Voice traffic = 6000 Mbps

Video traffic = 2000 Mbps

Voice normal operation policy = 90%

Video normal operation policy = 60%

Voice = 9000 Mbps (90%)

Video = 6000 Mbps (60%)

Voice = –3000 Mbps (30%)

Video = –4000 Mbps (40%)

Interface queue properties and QoS bound calculations

Cisco Crosswork Planning simultaneously calculates QoS bound for each queue in the interface. Cisco Crosswork Planning uses the Interface queue parameters (Priority, Weight, and Police limit) and measured or simulated traffic for all queues in the interface. Priority is always considered first. If there are queues of equal Priority, then Weight is applied next.

  • Queues with priority 1 share all available interface capacity. Their weight and police limits further refine how much each priority 1 queue can use (their QoS bound). Each priority 1 queue can borrow available capacity from other priority 1 queues up to the limit of their QoS bound.

  • The available capacity for priority 2 queues is the total interface capacity minus all capacity consumed by priority 1 queues. The process then begins again for all priority 2 queues. Their weight and police limits determine their QoS bound, and priority 2 queues can borrow capacity from each other up to the limits set by the QoS bound.

  • This process continues for each successive priority level. Traffic that is outside any QoS bound is dropped to the lowest priority of all traffic on the interface.

For discovered networks with measured traffic, if no Cisco Crosswork Planning QoS parameters are set, the QoS bound is based on whatever capacity percentages the live network has for each queue.

Priority

If policies are not set that further affect the QoS bound, a queue’s QoS bound is calculated using this pattern:

  • Priority 1 QoS bound = 100% of the interface capacity.

  • Priority 2 QoS bound = Total interface capacity – amount of traffic consumed by priority 1 queues.

  • Priority 3 QoS bound = Total interface capacity – amount of traffic consumed by (priority 1 + priority 2 queues).

  • QoS bound for each succeeding priority follows this same pattern where the traffic consumed by all higher priority queues is subtracted from the total interface capacity.

Table 2. Examples of priority QoS bound calculations

Example configuration

QoS bound

QoS violation (Positive # = Violation)

QoS bound calculations

Interface capacity = 20,000 Mbps

EF traffic = 6000 Mbps; priority = 1

BE traffic = 3000 Mbps; no priority set

EF = 20,000 Mbps

BE = 14,000 Mbps

EF = –14,000 Mbps

BE = –11,000 Mbps

EF = Total interface capacity because it is the only priority 1 queue

BE = 20,000 (interface capacity) – 6000 (consumed by higher priority queues)

Interface capacity = 10,000 Mbps

EF Traffic = 6000 Mbps; priority = 1

BE Traffic = 5000 Mbps; priority = 2

EF = 10,000 Mbps

BE = 4000 Mbps

EF = –4000 Mbps

BE = 1000 Mbps

EF = Total interface capacity because it is the only priority 1 queue

BE = 10,000 (interface capacity) – 6000 (consumed by higher priority queues

Weight

The weight identifies the forwarding precedence for queues of equal priority. If weights for queues of the same priority do not add up to 100%, weights are converted proportionally so they do add up to 100%.

Table 3. Examples of weight QoS bound calculations

Example configuration

QoS bound

QoS violation (Positive # = Violation)

QoS bound calculations

Interface capacity = 10,000 Mbps

AF1 traffic = 3000 Mbps; priority = 1; weight = 100%

AF2 traffic = 6000 Mbps; priority = 1; weight = 100%

AF1 = 5000 Mbps

AF2 = 7000 Mbps

AF1 = –2000 Mbps

AF2 = –1000 Mbps

AF1 = Half of capacity for priority 1 queues because both queues have equal weights

AF2 = 5000 (half of capacity) + 2000 (unused AF1 capacity)

Interface capacity = 10,000 Mbps

AF1 = 5000 Mbps; priority = 1; weight = 60%

AF2 traffic = 6000 Mbps; priority = 1; weight = 40%

AF1 = 6000 Mbps

AF2 = 5000 Mbps

AF1 = –1000 Mbps

AF2 = 1000 Mbps

AF1 = 60% of capacity for all priority 1 queues

AF2= 10,000 (interface capacity) – 5000 (consumed by AF1 queue)

Police limits

Priority 1 queues have 100% of the interface traffic, and thus starve out the remaining queues. To prevent this queue starvation, use police limits to configure how much of the maximum percentage should be available for a given priority level.

Table 4. Examples of police limit QoS bound calculations

Example configuration

QoS bound

QoS violation (Positive # = Violation)

QoS bound calculations

Interface capacity = 10,000 Mbps

EF traffic = 1000 Mbps; priority = 1; police limit = 50%

BE traffic = 2000 Mbps; priority = 2

EF = 5000 Mbps

BE = 9000 Mbps

EF = –4000 Mbps

BE = –7000 Mbps

EF = 50% of total interface capacity

BE = 10,000 (interface capacity) – 1000 (capacity consumed by EF)

Interface capacity = 10,000 Mbps

EF traffic = 1000 Mbps; priority = 1; police limit = 5%

BE traffic = 2000 Mbps; priority = 2

F = 500 Mbps

BE = 9500 Mbps

EF = 500 Mbps

BE = –7500 Mbps

EF = 5% of total interface capacity

BE = 10,000 (interface capacity) – 500 (capacity consumed by EF)

Interface capacity = 10,000 Mbps

EF = 3000 Mbps; priority = 1; police limit = 20%

AF1 traffic = 4000 Mbps; priority = 2; police limit = 75%

AF2 traffic = 2500 Mbps; priority = 2; police limit 25%

EF = 2000 Mbps

AF1 = 6000 Mbps

AF2 = 4000 Mbps

EF = 1000 Mbps

AF1 = –2000 Mbps

AF2 = –1500 Mbps

EF = 20% of total interface capacity

AF1 = 75% of (10,000 [interface capacity] – 2000 [capacity consumed by EF])

AF2 = 10,000 (interface capacity) – 2000 (capacity consumed by EF) – 4000 (capacity consumed by AF1)

Interface QoS bound calculations using multiple QoS parameters

Cisco Crosswork Planning calculates a QoS bound for interface queues based on three parameters—priority, weight, and police limit—when all are configured.

Table 5. Examples of interface QoS bound calculations using multiple QoS parameters

Example configuration

QoS bound

QoS violation (Positive #= Violation)

QoS bound calculation

Interface capacity = 10,000 Mbps

EF = 3000 Mbps; priority = 1; police limit = 20%

AF1 traffic = 4000 Mbps; priority = 2; weight = 75%

AF2 traffic = 2500 Mbps; priority = 2; weight = 25%

EF = 2000 Mbps

AF1 = 6000 Mbps

AF2 = 4000 Mbps

EF = 1000 Mbps

AF1 = –2000 Mbps

AF2 = –1500 Mbps

EF = 20% of total interface capacity

AF1 = Maximum of these two values.

  • 75% of (10,000 [interface capacity] – 2000 [capacity consumed by EF])

  • 8000 (available capacity) – 2500 (AF2 traffic)

AF2 = Maximum of these two values.

  • 25% of (10,000 [interface capacity] – 2000 [capacity consumed by EF])

  • 8000 (available capacity) – 4000 (AF1 traffic)

Service class QoS bound calculations using multiple QoS parameters

When service classes have defined policies and are mapped to queues, Cisco Crosswork Planning calculates a QoS bound for both. The system then uses the lowest value of the two so as to enforce restrictions in the strictest possible manner.

Example calculation

  • Interface capacity = 10,000 Mbps

  • QoS bound for service class = 50%, or 5000 Mbps based on policy

  • QoS bound for EF queue = 7500 Mbps based on combined parameters of priority, weight, and police limit

The QoS bound for this service class is 5000 Mbps because the policy QoS bound calculation is lower.

Queue and service class information

This table lists the options to view different types of queue and service class information.

Table 6. Queue and service class information

To view

Show or select

Queue information

Show the Interface Queues table. Select the queue from the QoS drop-down list in the visualization toolbar. Both the network plot and the Traff meas and Traff sim columns display traffic data specific to the queue type selected.

Per-queue traffic in the Interfaces table

Select the queue from the QoS drop-down list. Both the network plot and the Traff meas and Traff sim columns display traffic data specific to the queue type selected.

Service class demands

Show the Service class column in the Demands table.

Per-service-class traffic

Select the service class from the QoS drop-down list. Both the network plot and the Traff meas and Traff sim columns in the Interfaces table display data specific to the service class selected.

QoS bound and QoS violation columns

This table lists the available column options to display numeric values of the QoS bound calculations. For information on QoS values as they relate to VPNs, refer to Simulate VPN.

Table 7. QoS bounds and QoS violations

To view

Show this column in Interfaces, Circuits, or Interface queues table

Measured Traffic

Maximum capacity before a QoS bound is violated under normal operations

QoS bound meas

QoS bound as a percentage of total interface capacity

QoS bound meas (%)

QoS violations under normal operations; if the number is positive, there is a violation

QoS violation meas

QoS violation as a percent of the total interface capacity

QoS violation meas (%)

Simulated Traffic

Maximum capacity before a QoS bound is violated under normal operations

QoS bound sim

QoS bound as a percentage of total interface capacity

QoS bound sim (%)

QoS violations under normal operations; if the number is positive, there is a violation

QoS violation sim

QoS violation as a percent of the total interface capacity

QoS violation sim (%)

Worst-Case Traffic

Maximum capacity before a QoS bound is violated under worst-case operations

WC QoS bound

WC QoS bound as a percentage of total interface capacity

WC QoS bound (%)

QoS violations under worst-case operations; if the number is positive, there is a violation

WC QoS violation

WC QoS violation as a percent of the total interface capacity

WC QoS violation (%)

Service class causing the worst-case utilization

WC service class

Create queues

Use this task to create new interface queues.

Cisco Crosswork Planning discovers queues. However, you can manually add them. Once discovered or created, queues appear in the Interface Queues table.

Procedure

SUMMARY STEPS

  1. Open the plan file (refer to Open plan files). It opens in the Network Design page.
  2. From the toolbar, choose Actions > Insert > Others > Interface Queues.
  3. Select the required interfaces.
  4. Click Next.
  5. Enter the queue name.
  6. Optionally enter the queue properties of priority, weight, and police limit. For information on how these queue properties behave, refer to Interface queue properties and QoS bound calculations.
  7. Submit your changes.

DETAILED STEPS


Step 1

Open the plan file (refer to Open plan files). It opens in the Network Design page.

Step 2

From the toolbar, choose Actions > Insert > Others > Interface Queues.

Alternatively, in the Network Summary panel, click The Interface queues tab in the Network Summary panel allows users to manage and configure queues for network interfaces. in the Interface queues tab.

The Interface queues tab is available under the More tab. If it is not visible, then click the Show/hide tables icon (The Interface queues tab in the Network Summary panel allows users to manage and configure queues for network interfaces.) and check the Interface queues check box.

Step 3

Select the required interfaces.

Step 4

Click Next.

Step 5

Enter the queue name.

Step 6

Optionally enter the queue properties of priority, weight, and police limit. For information on how these queue properties behave, refer to Interface queue properties and QoS bound calculations.

Step 7

Submit your changes.


The new queue appears as an option in the QoS drop-down list in the toolbar.

What to do next

Map a service class to the queue. For instructions, refer to Map service classes to queues.

Edit interface queue properties

Complete these steps to edit the QoS parameters using Interface queues properties.

Procedure


Step 1

Open the plan file (refer to Open plan files). It opens in the Network Design page.

Step 2

In the Network Summary panel on the right side, select the interface queues from the Interface queues table.

If the Interface queues tab is not visible, then click the Show/hide tables icon (The Interface queues tab allows users to modify Quality of Service (QoS) parameters for network interfaces. The image illustrates the steps to access and edit these properties effectively.), select the Interface queues check box, and click Apply.

Step 3

Click The Interface queues tab displays the properties and settings for managing interface queues in the application..

Step 4

Update one or more QoS fields: Priority, Weight, and Police limit. This enables you to create the desired QoS requirement.

Step 5

Save your changes.


Create service classes

Use this task to create new service classes.

Procedure

SUMMARY STEPS

  1. Open the plan file (refer to Open plan files). It opens in the Network Design page.
  2. In the toolbar, select Manage QoS from the QoS drop-down list, or use the Actions > Edit > Manage QoS option.
  3. In the Service Classes section, click Add icon.
  4. Enter a unique name under the Name column.
  5. (Optional) If queues exist and if you want to map this new service class to one or more queues, select them from the list.
  6. Save the changes.

DETAILED STEPS


Step 1

Open the plan file (refer to Open plan files). It opens in the Network Design page.

Step 2

In the toolbar, select Manage QoS from the QoS drop-down list, or use the Actions > Edit > Manage QoS option.

Step 3

In the Service Classes section, click Add icon.

An empty row appears.

Step 4

Enter a unique name under the Name column.

Step 5

(Optional) If queues exist and if you want to map this new service class to one or more queues, select them from the list.

If queues do not exist, but you want them, you must manually create the queues and then return to this dialog box to select them. For more information, see Map service classes to queues.

Step 6

Save the changes.


The newly created service class appears under this section and in the QoS drop-down list in the toolbar.

Map service classes to queues

Use this task to map service classes to interface queues.

Before you begin

To map service classes to queues, those queues must first exist either because they were discovered by Cisco Crosswork Planning or because you manually added them. For more information on creating queues, refer to Create queues.

Procedure

SUMMARY STEPS

  1. Open the plan file (refer to Open plan files). It opens in the Network Design page.
  2. In the toolbar, select Manage QoS from the QoS drop-down list, or use the Actions > Edit > Manage QoS option.
  3. In the Service Classes section, select the service class.
  4. Click Edit.
  5. In the Mapped to queues column, select one or more queues.
  6. Save your changes.
  7. Repeat for each service class to which you are mapping queues.

DETAILED STEPS


Step 1

Open the plan file (refer to Open plan files). It opens in the Network Design page.

Step 2

In the toolbar, select Manage QoS from the QoS drop-down list, or use the Actions > Edit > Manage QoS option.

Step 3

In the Service Classes section, select the service class.

Step 4

Click Edit.

Step 5

In the Mapped to queues column, select one or more queues.

Step 6

Save your changes.

Step 7

Repeat for each service class to which you are mapping queues.


Create policy groups for interfaces

Creating policy groups for interfaces allows you to apply consistent QoS settings across multiple interfaces from the Manage QoS page.

Procedure


Step 1

Open the plan file (refer to Open plan files). It opens in the Network Design page.

Step 2

In the Network Summary panel on the right side, select one or more interfaces from the Interfaces table.

Step 3

Click Creating a policy group for interfaces allows for the management of QoS policies. The image illustrates the process of adding an interface to an existing policy group or creating a new one..

Step 4

Click the Advanced tab.

Step 5

Expand the QoS panel.

  • To add this interface to an existing policy group, select it from the drop-down list.

  • To add a new policy group, type the name of the new group in the drop-down field and click Add "PoliyGroupName".

Step 6

Save your changes.

Step 7

To assign a service class to this policy group, select this policy group while configuring the Service Class Policy. For more information, refer to Create or edit service class policies.


Create or edit service class policies

This topic describes how to create or edit service class policies.

You can configure policies for undifferentiated traffic and for service classes.

Procedure

SUMMARY STEPS

  1. Open the plan file (refer to Open plan files). It opens in the Network Design page.
  2. In the toolbar, select Manage QoS from the QoS drop-down list, or use the Actions > Edit > Manage QoS option.
  3. To click a new service class policy:
  4. To edit an existing service class policy:

DETAILED STEPS


Step 1

Open the plan file (refer to Open plan files). It opens in the Network Design page.

Step 2

In the toolbar, select Manage QoS from the QoS drop-down list, or use the Actions > Edit > Manage QoS option.

Step 3

To click a new service class policy:

  1. In the Service Class Policies section, click Add icon.

    The New Service Class Policy page opens.

  2. If creating a policy for undifferentiated traffic, select Undifferentiated traffic. If creating a policy for an existing service class, select Service class. Then, select the service class from the Service Class drop-down list.

  3. To apply this service class mapping to a group of interfaces, select from or enter the name in the Interface policy group drop-down list. You can enter a name that does not exist and a policy group will be created with the name you entered. For details on creating policy groups for interfaces, refer to Create policy groups for interfaces.

  4. In Normal operation (in %), enter the percentage of bandwidth capacity that you do not want this interface (or group of interfaces) to exceed for this traffic or service class under normal conditions.

  5. In Worst-case (in %), enter the percentage of bandwidth capacity that you do not want this interface (or group of interfaces) to exceed for this traffic or service under worst-case operating conditions.

  6. Click Submit.

Step 4

To edit an existing service class policy:

  1. In the Service Class Policies section, select the service class row you want to edit.

  2. In the Actions column, click > Edit.

    The Edit Service Class Policy page opens.

  3. Enter the details as described in Step 3.

  4. Click Save.


Apply QoS settings globally

Selecting QoS settings and the traffic level at the global level determines the network summary table calculations and what is displayed in the network plot.

Before you begin

Ensure that the required queue or the service class is available.

Complete these steps to apply the QoS parameters globally for an opened plan file.

Procedure


Step 1

Open the plan file (refer to Open plan files). It opens in the Network Design page.

Step 2

In the toolbar, select Manage QoS from the QoS drop-down list, or use the Actions > Edit > Manage QoS option.

Step 3

Select the service class or queue from the QoS drop-down list.


The selected QoS setting applies globally to your network plan. The network plot and the network summary table display data based on the selected QoS parameter.

How QoS violations are indicated in the topology

Summary

Cisco Crosswork Planning visually signals when network interfaces exceed QoS bounds. This feature helps you quickly identify and address potential performance issues.

The key components involved in the process are:

  • Topology plot: Displays network interfaces and their current status.

  • QoS violation icon (): Marks interfaces that violate QoS thresholds.
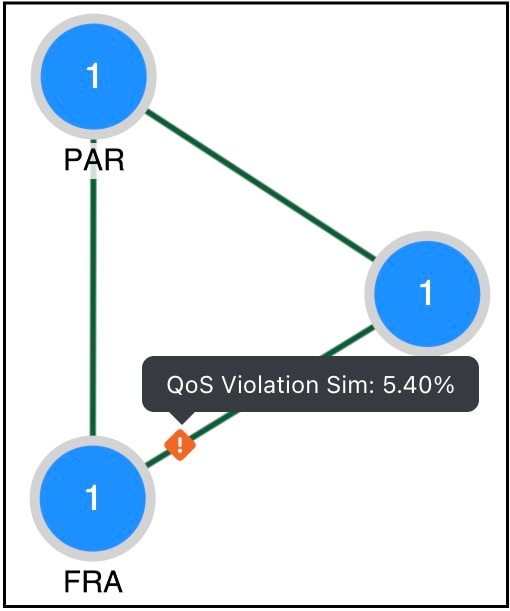
  • Severity text: Provides details about the violation.

Workflow

The process includes these stages:

  1. The system monitors interface utilization and QoS thresholds.
  2. When an interface exceeds its QoS bound, a violation icon appears on the topology plot.
  3. The severity text provides details about the violation.
    Figure 2. QoS violation indication
    qos-violation-indication

    Note


    Cisco Crosswork Planning indicates when an interface violates a QoS bound in the network plot, but does not display the QoS bound values on the interfaces.