Viewing and Responding to Alarms
Available Languages
Table Of Contents
Viewing and Responding to Alarms
Viewing and Responding to Alarms using Physical Switch Controls
Displaying Alarm Reports in the CLI
Displaying Event Log Information
Viewing and Responding to Alarms
The SES displays alarm information on the PXM1 cards, and it stores information on these inside the switch. This chapter describes how to interpret the alarm LEDs on the switch and how to obtain alarm reports through the CLI.
Viewing and Responding to Alarms using Physical Switch Controls
The PXM1 cards host LEDs and switches that you can use to view alarm status and respond to alarms. The following sections describe the controls on each of these cards.
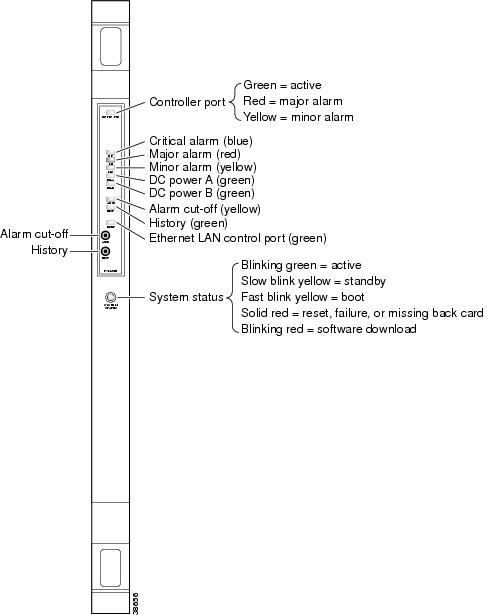
PXM1 Card Controls
Figure 9-1 shows the LEDs and switches available on the front of the PXM1 card. Table 9-1 describes these controls.

Note
Although there are LEDs for critical, major, and minor alarms on the PXM1, only one of these LEDs is set to on when multiple alarms are active. The switch always displays the status of the most severe alarm. Critical alarms are the most severe, and minor alarms are the least severe. For example if there were 2 major alarms and 10 minor alarms, the switch would set the major alarm LED to on.
Figure 9-1 PXM1 Front Card Controls
Displaying Alarm Reports in the CLI
You can use CLI commands to view the status of switch alarms. Alarms are reported in the following categories:
•
•
•
•
•
•
This section describes how to display the different types of alarm reports.
Displaying Node Alarms
A node alarm report displays a summary report of all alarms on the node. To display node alarms, enter the following command:
spirit.1.PXM.a > dspndalmsThe following is an example of the node alarm report.
spirit.1.PXM.a > dspndalmsNode Alarm SummaryAlarm Type Critical Major MinorClock Alarms 0 0 0Switching Alarms 0 0 0Shelf Slot Alarms 0 2 0Environment Alarms 0 0 0Alarms From Cards 0 1 0Typically, you would start investigating alarms by displaying the node alarms. Once you have identified the area that is producing the alarms, you would enter additional commands to display detailed information on those alarms. The following sections describe how to display these detailed reports.
Displaying Card Alarms
A card alarm report can display the alarm status of all the cards within the node or the alarm status of a single card. To display card alarms, enter the following command:
spirit.1.PXM.a > dspcdalms [slot]Replace slot with the number of the card for which you want to display alarms.
Note
The following example shows a partial card alarm report for all cards:
spirit.1.PXM.a > dspcdalmsNode Card Alarm SummaryLine Alarm Slot 1 Critical 0 Major 1 Minor 0Port Alarm Slot 1 Critical 0 Major 0 Minor 0Channel Alarm Slot 1 Critical 0 Major 0 Minor 0Displaying Environment Alarms
An environmental alarm report displays the alarm status and operating statistics for the switch power supplies and cooling fans. To display the environmental alarm report, enter the following command:
spirit.1.PXM.a > dspenvalmsThe following is an example environmental alarm report:
spirit.1.PXM.a > dspenvalmsspirita System Rev:01.00 May. 19, 2000 07:52:19 PSTSES-CNTL Node Alarm:MAJORENVIRONMENTAL ALARM STATE INFO ^Notification DisabledAlarm Type Unit Threshold DataType Value State---------------- ---- -------------- -------- ---------- -------------Temperature <= 50 Celsius 26 NormalPower Supply A1 none None none NormalPower Supply A2 none None none MissingPower Supply A3 none None none MissingDC Voltage A 42 to 54 VoltsDC 49 NormalPower Supply B1 none None none MissingPower Supply B2 none None none MissingPower Supply B3 none None none MissingDC Voltage B 42 to 54 VoltsDC 0 NormalFan Tray 1 >= 2000 RPM 2784 NormalFan Tray 2 >= 2000 RPM 2760 NormalFan Tray 3 >= 2000 RPM 2700 NormalFan Tray 4 >= 2000 RPM 2646 NormalFan Tray 5 >= 2000 RPM 2670 NormalType <CR> to continue, Q<CR> to stop:spirita System Rev:01.00 May. 19, 2000 07:52:19 PSTSES-CNTL Node Alarm:MAJORENVIRONMENTAL ALARM STATE INFO ^Notification DisabledAlarm Type Unit Threshold DataType Value State---------------- ---- -------------- -------- ---------- -------------Fan Tray 6 >= 2000 RPM 2616 NormalFan Tray 7 >= 2000 RPM 2670 NormalFan Tray 8 >= 2000 RPM 2676 Normal+5V Input 4.850^ to 5.150^ VoltsDC 4.978 Informational+3.3V Input 3.200^ to 3.400^ VoltsDC 3.259 InformationalCalibration VDC 0x7e^ to 0x82^ Other 0x80 InformationalDisplaying Slot Alarms
Slot alarms identify issues with the physical slots that host the PXM1 card. To display a report of all active slot alarms, enter the following command:
spirit.1.PXM.a > dspslotalmsThe following is a sample report showing no slot alarms.
spirit.1.PXM.a > dspslotalmsNode Slot Alarm SummaryCard Alarm Critical 0 Major 2 Minor 0Displaying Switching Alarms
Switching alarms identify problems with the switching components within the SESPXM1. To display a report of all switching alarms, enter the following command:
spirit.1.PXM.a > dspswalmsThe following is a sample report showing no switching alarms.
spirit.1.PXM.a > dspswalmsCard Crossbar Critical 0 Major 0 Minor 0Crossbar Fabric Critical 0 Major 0 Minor 0Humvee Alarm Critical 0 Major 0 Minor 0Displaying Event Log Information
Log files record switch events such as operator login and command entry. The syntax for the dsplog command is as follows:
dsplog [-sl <slot>] [-mod <module>]To limit the log display to the events for a single slot, use the -sl option and replace slot with the appropriate slot number.
To limit the log display to events from a single module, use the -mod option with the module name, for example LDRV.
To display the current log file number, enter the following command:
spirit.1.PXM.a > dsplogsThe log files are stored in the C:/LOG directory, under the names event 01.log through event 50.log.
The following is a sample report showing event log information.
spirit.1.PXM.a > dsplog01-00369 05/19/2000-07:56:51 CLI-7-CMDLOGtDbgInTask 0x80199084cliCmdLog:cisco@console:(cc 1).01-00368 05/19/2000-07:56:51 CLI-7-CMDLOGtDbgInTask 0x80199084cliCmdLog:cisco@console:(cc 1).01-00367 05/19/2000-07:56:51 CLI-7-CMDLOGtDbgInTask 0x80199084cliCmdLog:cisco@console:(cc 1).01-00366 05/19/2000-07:40:39 CLI-7-CMDLOGtDbgInTask 0x80199084cliCmdLog:cisco@console:(cc 1).01-00365 05/19/2000-07:38:06 CLI-7-CMDLOGtDbgInTask 0x80199084cliCmdLog:cisco@console:(cc 1).01-00364 05/19/2000-07:38:06 CLI-7-CMDLOGtDbgInTask 0x80199084cliCmdLog:cisco@console:(login).01-00363 05/19/2000-05:17:43 CLI-7-CMDLOGtDbgInTask 0x80199084cliCmdLog:cisco@console:(logout). - 1 dropped01-00362 05/19/2000-05:03:10 CLI-7-CMDLOGType <CR> to continue, Q<CR> to stop:Displaying Error Information
Error files record all errors on the system. To view the contents of the current error log file, enter the dsperr command. The syntax for the dsperr command is as follows:
dsperr [-en <error slot>] [-sl<slot number>]The following is a sample report showing error log information.
spirita.1.PXM.a > dsperrError Log for Slot 01:Error Num 32Firmware version:002.000.001-D_mdamle Product Id:3Timestamp:05/17/2000-02:29:55 Node name:spiritaSection Number 0:Event Logged:01-00304 05/17/2000-02:29:55 SSI-4-MEMBLKERRORE:00032 tTnCmdTsk0 0x80063614Memory Block Error:invalid start magic word value 0x80898b00 block0x81f866a8 in ssiFree.Section Number 1:Stack Trace:0x805d2d24 vxTaskEntry +00c:sysTaskSetup+0()0x80072114 sysTaskSetup +09c:cliCmdTask+0()0x8019c824 cliCmdTask +478:cliCmdExec+0()0x8019bf98 cliCmdExec +270:GetSizes+0()0x801f9e1c GetSizes +3a8:sysDiskPartitionInfoShow+0()0x801f9a50 sysDiskPartitionInfoShow +0e0:snmpSsiFree+0()0x8055d818 snmpSsiFree +024:ssiFree+0()0x8006181c ssiFree +0e8:ssiMemErrorLog+0()0x80063614 ssiMemErrorLog +06c:ssiEvent+0()0x8005e10c ssiEvent +24c:ssiEventMsgReport+0()0x8005e648 ssiEventMsgReport +284:ssiStackTrace+0()+--------------Type <CR> to continue, Q<CR> to stop:
 Feedback
Contact Cisco
- Open a Support Case

- (Requires a Cisco Service Contract)
This Document Applies to These Products
- Collaboration Endpoints - Retired Products
- Conferencing - Retired Products
- Contact Center - Retired Products
- Optical Networking - Retired Products
- Routers - Retired Products
- Security - Retired Products
- Servers - Unified Computing (UCS) Retired Products
- Storage Networking Retired Products
- Switches - Retired Products
- Video - Retired Products
- Wireless - Retired Products