- Overview
- User Interface
- Plan Objects
- Traffic Demand Modeling
- Simulation
- Simulation Analysis
- Traffic Forecasting
- IGP Simulation
- MPLS Simulation
- RSVP-TE Simulation
- Segment Routing Simulation
- Layer 1 Simulation
- Quality of Service Simulation
- BGP Simulation
- Advanced Routing with External Endpoints
- VPN Simulation
- Multicast Simulation
- Metric Optimization
- LSP Optimization
- RSVP-TE Optimization
- Explicit and Tactical RSVP-TE LSP Optimization
- Segment Routing Optimization
- Capacity Planning Optimization
- L1 Circuit Path Optimization
- Changeover
- Patch Files
- Reports
- Cost Modeling
- Plot Legend for Design Layouts
Cisco WAE Design 7.0.1 User Guide
Bias-Free Language
The documentation set for this product strives to use bias-free language. For the purposes of this documentation set, bias-free is defined as language that does not imply discrimination based on age, disability, gender, racial identity, ethnic identity, sexual orientation, socioeconomic status, and intersectionality. Exceptions may be present in the documentation due to language that is hardcoded in the user interfaces of the product software, language used based on RFP documentation, or language that is used by a referenced third-party product. Learn more about how Cisco is using Inclusive Language.
- Updated:
- May 4, 2017
Chapter: Reports
Reports
WAE Design lets you generate reports that compare IP/MPLS topology and configuration information, demand routings, LSP routings, or traffic between two plan files. You can use these reports to:
- Plan for upgrades—Compare plan files before and after topology and configuration changes are made to a current network. For example, you could compare the original plan file to a proposed new plan in which circuits or nodes are added or upgraded.
- Mitigate congestion—Compare plans before and after making configuration changes to mitigate congestion due to a failure or planned maintenance, such as metric changes or LSP additions and reroutings.
- Validate simulations—Compare the simulated traffic under failure in one plan to the measured traffic after a failure has occurred in another plan to validate the accuracy of the simulation.
- Audit plans—Review any changes between two plan files.
- Identify demand and LSP reroutes—Compare plans to determine which demands or LSPs experienced routing changes, for example as the result of an interface metric change or capacity upgrades.
Upon comparing plan files, a report of the results opens automatically. You can access this report later by choosing Window > Reports.
|
|
|
|---|---|
Plan Comparison Reports
Comparison reports let you compare objects between two plan files to determine:
- Which objects are present in one plan, but not in the other.
- Which objects are present in both plans and which, if any, have different properties.
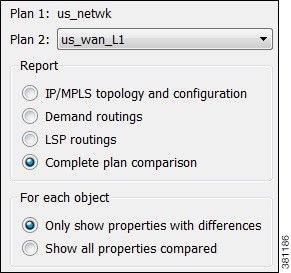
You can run four types of plan comparison reports:
- IP/MPLS topology and configuration—Objects describing the topology (such as nodes, circuits, and interfaces), configured objects (such as LSPs and LSP paths), and related properties (such as IGP metrics and capacity).
- Demand routings—Demand paths and the properties that indicate routing changes, such as Path Length and Max Latency. For a complete list of compared properties, see Table 27-1 .
- LSP routings—Properties of LSPs that indicate routing changes, such as TE Path Metric and Active Path Sim. For a complete list of compared properties, see Table 27-2 .
- Complete plan comparison—All tables in the table schema are compared, except for internal simulation caching tables. For a complete list of these tables, refer to the
$CARIDEN_HOME/docs/table_schemafile.
Report Columns
Each WAE Design table has key columns that uniquely identify objects. For example, the key columns in the Interfaces table are the Node and Interface columns, which represent the name of the node containing the interface and the name of the interface itself. In a Plan Comparison report, an object in one plan is identified with an object in another plan only if the key columns of the two objects match. That is, key columns determine if an object is present in both plans or in only one of the plans.
The Plan Comparison report displays three other types of columns. Table 27-1 , Table 27-2 , and Table 27-3 list the properties reported upon and their associated column type.
- Information only (Info)—There are no comparisons made. Information is reported for the plan file from which you are running the report (Plan 1).
- Differences (Diff)—Specific properties are compared for each object that has matching key columns across the two plan files. Objects are then identified as belonging in either Plan 1 only (file from which you are running the report), in Plan 2 only (plan file to which you are comparing), or in both Plan 1 and Plan 2. If the object exists in both plan files, but has different properties, a Diff column shows T (true) if there are any differences or F (false) if there are none.
Differences are based on the current state of the open plan files. For example, if a circuit has failed, the demand routings change to route around the failure.
- Summary Differences (Summ Diff)—These are not columns within WAE Design tables. They are T/F (true or false) values, depending on some differences in the table objects that are not represented in the table columns. For example, if a common LSP path is configured differently between plans, this difference is represented in a summary difference column in the LSP section. If demand routings differ, this is represented in a summary difference column in the Demands section.

Note![]() For easy reference, the following tables list columns in the order of type first: Key, Info, Diff, and Summ Diff. Properties within each column type are alphabetical.
For easy reference, the following tables list columns in the order of type first: Key, Info, Diff, and Summ Diff. Properties within each column type are alphabetical.
|
|
|
|
|
|---|---|---|---|
T (true) if there are any differences in routing of the demand. |
Report Sections
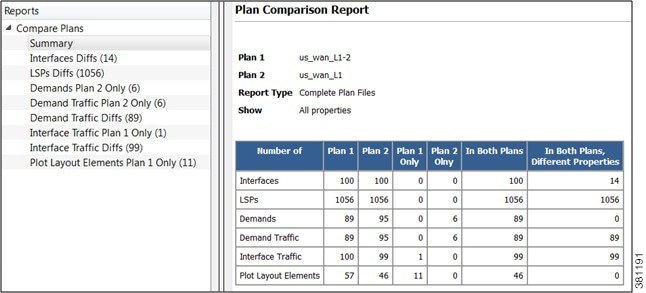
The Summary section shows the number of objects in each plan file, the number of objects in both plan files, and the number of objects with property differences (Figure 27-1).
Example: Nodes A, B, and C are in Plan 1, and B, C, and D are in Plan 2. Nodes B and C have matching key columns. The B nodes have identical properties, but the C nodes have different IP addresses. Therefore, in the Summary section, the In Both Plans column shows 2, and the Different Properties column shows 1.
An individual section is generated for each object that appears in only one plan file and if there are differences between the properties, a section is generated showing these differences. Thus, there is the potential of generating one to three sections per compared table: one for objects appearing only in Plan 1, one for objects appearing only in Plan 2, and one listing objects existing in both plan files, along with their differences noted with a T (true) or F (false).
Figure 27-1 Example Plan Comparison Report Summary
Other than Summary, the report sections and columns (properties) that appear depend on the options selected when generating the report.
- If you select to show only properties with differences, only those columns with differences in properties appear in the report. If only one value is different, all objects are listed (not just the one with the different property).
- If you select to show all properties compared, all compared properties appear in the report whether there are differences between the two plan files or not.
Creating Plan File Comparison Reports
Step 1![]() Open the two plan files you want to compare.
Open the two plan files you want to compare.
Step 2![]() In either of these two plan files, choose Tools > Reports > Compare Plans.
In either of these two plan files, choose Tools > Reports > Compare Plans.
Step 3![]() Choose the plan file to which you are comparing the open plan.
Choose the plan file to which you are comparing the open plan.
Step 4![]() Choose the type of comparisons you want to generate:
Choose the type of comparisons you want to generate:
Step 5![]() Choose whether to show only properties with differences or whether to show all properties compared.
Choose whether to show only properties with differences or whether to show all properties compared.
Traffic Comparison Reports
Traffic Comparison reports compare traffic values within a single plan or between two plan files. You can compare traffic on one object at a time (nodes, interfaces, circuits, demands, LSPs, multicast flows, and flows). Each object has a different set of comparisons from which to choose. For example, interface traffic and capacity can be compared, and LSP traffic and setup bandwidth can be compared. Another example would be to compare the simulated interface traffic in a plan file before a failure to the measured interface traffic of a plan file in which a failure occurred. Such a comparison lets you determine which interfaces show the greatest differences.
For each plan file compared, the current traffic level and either the selected service class or queue are used. They can be different in each plan.
The Summary section shows a high-level summary of what is being compared. Additionally, a section of the difference on the selected object and traffic columns is generated and named accordingly.
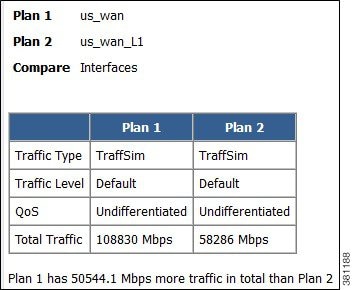
Creating Traffic Comparison Reports
Step 1![]() If comparing traffic from the open plan file to another, open the other plan file.
If comparing traffic from the open plan file to another, open the other plan file.
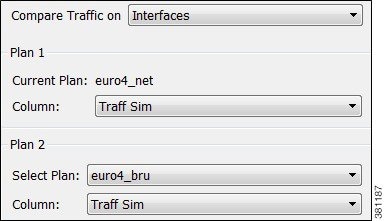
Step 2![]() In each plan file, choose the travel levels and choose either the service class or queue traffic to compare.
In each plan file, choose the travel levels and choose either the service class or queue traffic to compare.
Step 3![]() Choose Tools > Reports > Compare Traffic. This plan file is identified as Plan 1 in the Compare Traffic dialog box that opens.
Choose Tools > Reports > Compare Traffic. This plan file is identified as Plan 1 in the Compare Traffic dialog box that opens.
Step 4![]() Choose the object type on which to compare traffic (interfaces, circuits, nodes, and so on).
Choose the object type on which to compare traffic (interfaces, circuits, nodes, and so on).
Step 5![]() Choose the traffic column in the current plan that you want to compare (Plan 1).
Choose the traffic column in the current plan that you want to compare (Plan 1).
Step 6![]() The default Plan 2 is the current plan file. To change this, choose a different plan file for Plan 2.
The default Plan 2 is the current plan file. To change this, choose a different plan file for Plan 2.
Step 7![]() Choose the traffic column being compared for Plan 2.
Choose the traffic column being compared for Plan 2.
Viewing or Exporting Reports
Upon generating a report, it opens automatically. From there you can select the various sections of the report from the left navigation pane.
To view a report after having closed it, choose Window > Reports. All reports generated on that plan file appear and are selectable from one report window.
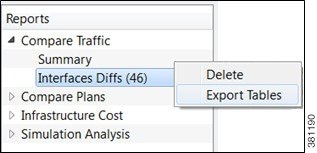
If you want to save these reports for later use, you must save the plan file. However, running the report again overwrites the report. To preserve the information, you can export the data by report section. Right-click any of the sections in the left navigation pane and choose Export Tables.
 Feedback