- Overview
- User Interface
- Plan Objects
- Traffic Demand Modeling
- Simulation
- Simulation Analysis
- Traffic Forecasting
- IGP Simulation
- MPLS Simulation
- RSVP-TE Simulation
- Segment Routing Simulation
- Layer 1 Simulation
- Quality of Service Simulation
- BGP Simulation
- Advanced Routing with External Endpoints
- VPN Simulation
- Multicast Simulation
- Metric Optimization
- LSP Optimization
- RSVP-TE Optimization
- Explicit and Tactical RSVP-TE LSP Optimization
- Segment Routing Optimization
- Capacity Planning Optimization
- L1 Circuit Path Optimization
- Changeover
- Patch Files
- Reports
- Cost Modeling
- Plot Legend for Design Layouts
Cisco WAE Design 7.0.1 User Guide
Bias-Free Language
The documentation set for this product strives to use bias-free language. For the purposes of this documentation set, bias-free is defined as language that does not imply discrimination based on age, disability, gender, racial identity, ethnic identity, sexual orientation, socioeconomic status, and intersectionality. Exceptions may be present in the documentation due to language that is hardcoded in the user interfaces of the product software, language used based on RFP documentation, or language that is used by a referenced third-party product. Learn more about how Cisco is using Inclusive Language.
- Updated:
- May 4, 2017
Chapter: Plot Legend for Design Layouts
Plot Legend for Design Layouts
This legend is for Design layouts used in the WAE Design GUI.

Note![]() All traffic is displayed in Mbps. In the network plot, the traffic utilization colors represent outbound traffic. L3 means Layer 3, and L1 means Layer 1.
All traffic is displayed in Mbps. In the network plot, the traffic utilization colors represent outbound traffic. L3 means Layer 3, and L1 means Layer 1.
|
|
|
|---|---|
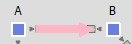
Interfaces and Circuits


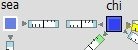

Circuit Colors


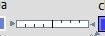


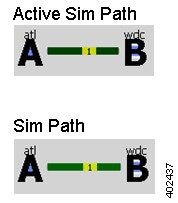
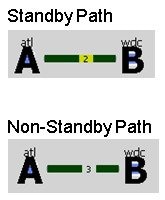
Circuit Active, Failed, and Operational States


L3 Nodes


Sites
Site utilization colors and symbols are based on intrasite objects. Note that intrasite objects include child sites and the objects contained within them.


 Feedback